

Analys
SEB Jordbruksprodukter, 18 augusti 2014


 Spänningen var stor i marknaden inför WASDE-rapporten från USDA tisdags kväll. När den väl kom var den någorlunda i linje med förväntningarna, med övervikt åt det negativa hållet. Den här rapporten var dock inte tillräckligt ”bearish” för att trycka ner priserna ytterligare.
Fredagens handel präglades annars av att en rysk pansarkolonn setts rulla över gränsen och in i Ukraina (av journalister från ansedda the Guardian och the Telegraph). Pansarkolonnen besköts och förstördes delvis av ukrainskt artilleri. NATO-chefen kallade detta för en ”incursion”, vilket är en eufemism för ”invasion”. De vita lastbilarna med humanitär hjälp, som följts av media när de färdats söderut på den ryska sidan har också befunnits vara till stor del tomma. Oron för fullskaligt och öppet krig oroar, men en öppning för detta har ännu inte getts. Ett fullskaligt krig skulle kunna betyda allvarliga störningar i importländerna i Nordafrika och Mellanösterns försörjning på kort sikt. På längre sikt är den här typen av reaktioner ofta säljtillfällen.
Importembargot som Ryssland införde märks hittills på varor som handlas på EUREX-börsen: Potatis, gris och mjölk. Mjölkpriset har fortsatt att rasa. Prisfallet är 25% hittills i år räknat på terminspriserna. Räknat på spotkontrakten, är raset ca 25% bara i augusti. Terminspriserna visar att detta inte är en temporär chock. Marknaden förväntar sig inte en prisuppgång inom ett och ett halvt års tid. Det är så långt terminsmarknaden sträcker sig. Potatispriset, som redan var riktigt lågt pga nederbörden i sommar, föll ytterligare i veckan som gick. Grispriset har nu också börjat falla.
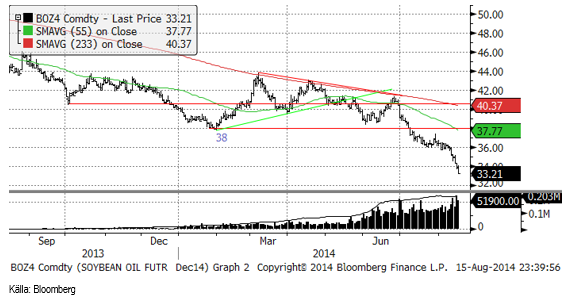
Förutom dessa, är även sojaoljan (vegetabilisk olja generellt) också en betydande förlorare med en prisnedgång på 7%.
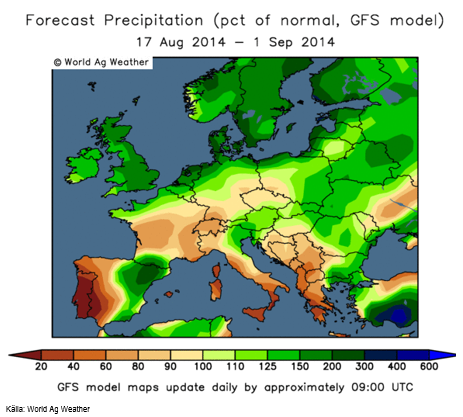
Odlingsväder
Kontinentaleuropa väntas torka upp de kommande två veckorna, medan Norden får ungefär dubbla nederbörden jämfört med den normala.
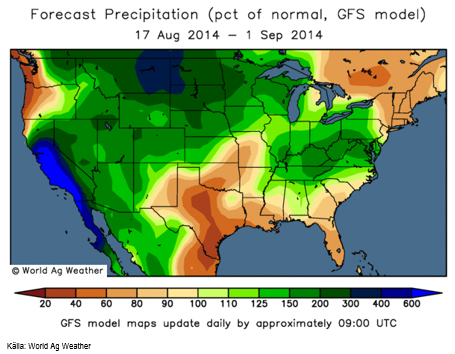
Prognoskartan för nederbörden i USA de kommande två veckorna ser fortsatt ”bearish” ut för majs och sojabönor:
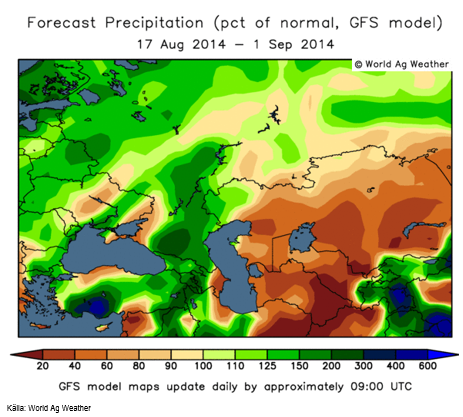
Prognosen för Ryssland och Ukraina visar fortsatt lite över normal nederbörd. Det ser inte ut att vara någon risk för lägre skörd av majs, t ex.
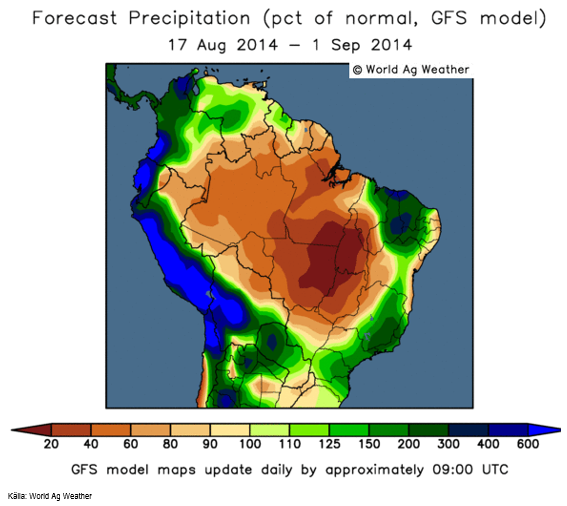
Brasilien får mer nederbörd än normalt längs kusten och mindre än normalt inåt landet.
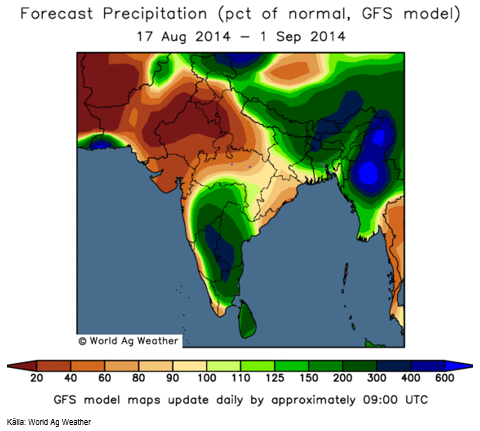
Det talas om att Indiens monsun är normal nu, men att den ackumulerat sedan starten är svagare än normalt. Ser man på väderlekskartorna kan man dock se att nederbörden faktiskt INTE ser riktigt normal ut. Området kring New Delhi, där det odlas mycket sockerrör, bland annat, har fått ungefär hälften och ännu mindre än normal nederbörd. Det hjälper inte särskilt mycket om vissa områden får väsentligt mycket mer nederbörd än normalt, medan andra delar inte får något alls, men jag begriper kanske inte det här. ”Nästan normalt” ser det i var fall inte ut, och inte heller i prognosen fram till den 1 september.
Vete
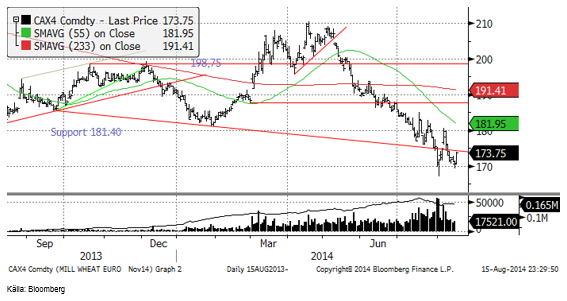
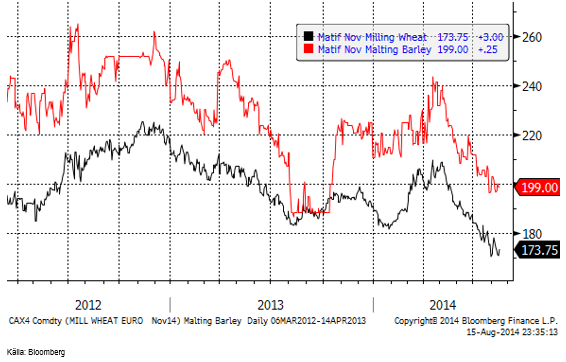
Matifvetet fann stöd på 170 och steg kraftigt i fredags efter att det blivit känt att en fordonskolonn med ryska nationalitetsbeteckningar kört över gränsen till Ukraina och delvis blivit förstörd av ukrainskt artilleri. Enligt ukrainarna är detta ingen nyhet, men nu var det två journalister från väst (Guardian och Telegraph) som fotograferade, filmade och skrev om den. Natochefen kallar detta för en ”incursion” (Webster’s New World Dictionary säger att det betyder ”an invasion or raid”; om ”invasion” står ”an invading or being invaded, as by an army”). Så om det betyder samma sak, varför inte använda det enklare ”invasion”, när det uppenbarligen också är en exakt beskrivning av vad som händer? Förmodligen för att ge Ryssland en möjlighet att dra sig tillbaka.
Marknaden tyckte nog att det var sak samma i alla fall, och handlade upp veteterminerna överlag och novemberterminen stängde på dagshögsta 173.75. Detta är dock precis under ett tekniskt stöd och geopolitik styr inte priset på vete på längre sikt.
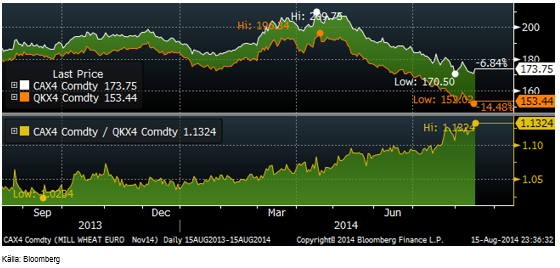
Skillnaden mellan ”London-vete” (foder) och Matif (kvarnvete) har fortsatt att öka den senaste veckan, om än marginellt.
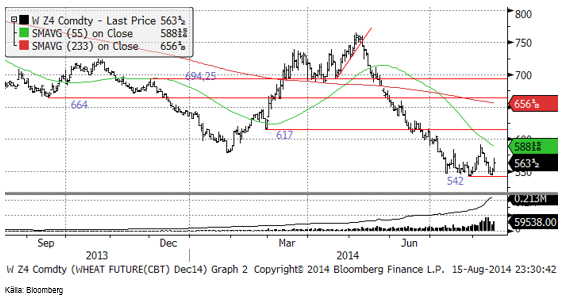
Chicagovetet (december)steg under större delen av veckan, men steg kraftigt i fredags.
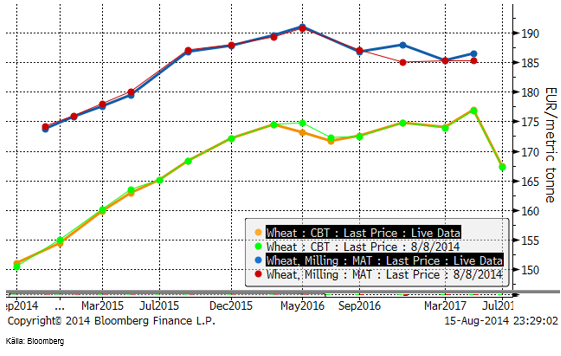
Nedan ser vi terminskurvorna för Chicagovete och Matif i fredags och veckan innan. Det har varit rörelse ner och sedan upp, nästan exakt tillbaka till hur det var för en vecka sedan.
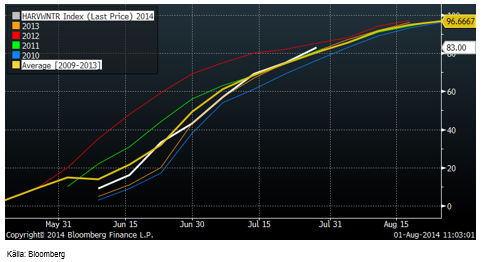
Skörden av höstvetet i USA hade i måndags för en vecka sedan avancerat 7% till 90% skördat. Därmed är skörden i praktiken klar nu i USA.
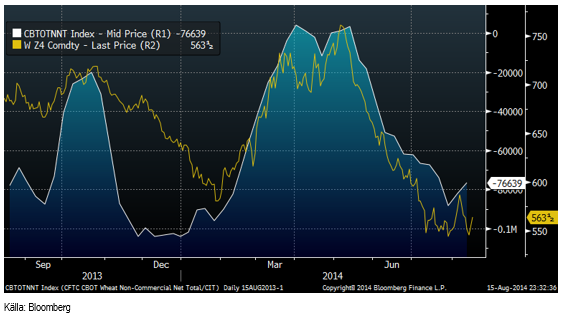
Non-commercials i CFTC:s rapport har köpt tillbaka ytterligare nästan 6000 kontrakt och är nu ”bara” sålda 76 639 kontrakt.
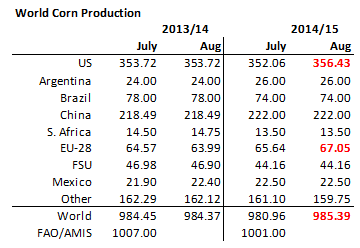
USDA:s WASDE-rapport kom i veckan. Det var stora förväntningar på den, men det blev bara en tumme. Produktionen justeras upp i USA, Kina och Ryssland. För FSU som helhet höjdes produktionen med massiva 8 mt. Detta är dock mindre än vad lokala rapporter om hektarskörden indikerar. Den allmänna uppfattningen är att USDA inte genomfört hela revideringen uppåt nu, och att mer kan komma i septemberrapporten. 8 mt högre produktion i ett nafs är en ovanligt stor höjning och en höjning med 15 mt hade varit sensationellt. Men vi räknar med att mer kommer. Detta var egentligen inte alls en positiv rapport, men marknaden reagerade nästan inte alls.
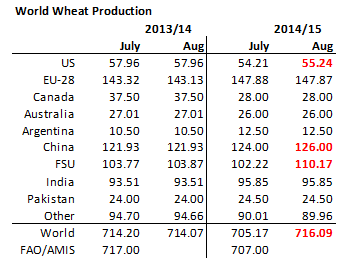
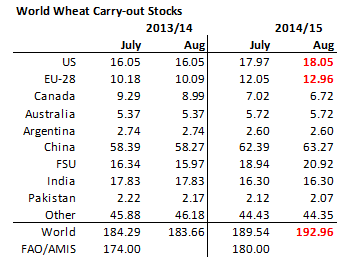
Med så här lågt vetepris, ökar också konsumtionen. Framförallt i EU väntar sig USDA att den högre andelen fodervete leder till högre konsumtion av denna till foder. Utgående lager öakr därför med nästan 3.5 mt (medan produktionen ökar med 11 mt). De senaste åren har vi sett utgående lager i EU som i princip har inneburit att det varit helt tomt innan ny skörd kommer in. Nu ser vi lagernivåerna öka i EU och i USA.
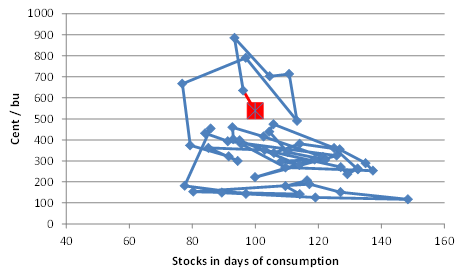
Pris i förhållande till lager på global basis visar att priset ser ”lågt” ut i förhållande till de senaste årens relation. Å andra sidan har vi inte samma paradigm som de senaste åren. Kinas sug efter mer spannmål håller på att mattas. Produktionen har kommit i kapp efterfrågan. Relationen mellan pris och lager håller på att ansluta sig till den nivå som gällde innan råvaruboomen driven av Kina inleddes vid mitten av 00-talet.
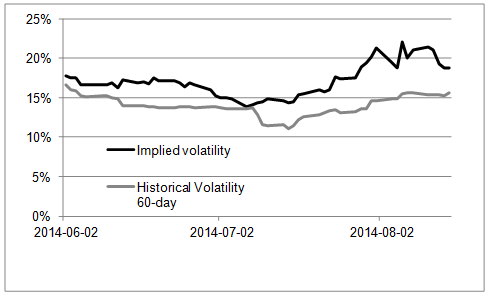
Optionsmarknaden prissätter optioner till lägre implicit volatilitet efter WASDE-rapporten. Den handlade volatiliteten har minskat från 21% till 19% sedan i tisdags.
I torsdags höjde StrategieGrains sitt estimat för veteproduktionen i EU ytterligare lite till 144.1 mt. USDA låg som vi såg i princip oförändrat på 147.87 mt ovan. Madame Defois & Co anger däremot att volymen av vete som når kvarnvetekvalitet blir 11 mt lägre än förra året, 85 mt istället för 96 mt förra året.
StrategieGrains estimerar att EU:s export av vete 2014/15 uppgår till 23.7 mt, 0.9 mt lägre än 2013/14. Frankrike väntas exportera 3 mt mindre, men detta kompenseras av högre export från främst Polen och Tyskland.
Från Tyskland verkar veteskörden komma in till bättre falltal än befarat.
Fundamenta pekar på fallande pris, men marknaden vill inte handla åt det hållet. Om den ville det, hade den gjort det i veckan som gick. Även om det inte betyder något på längre sikt för utbud och efterfrågan, kan Rysslands nu allt mer öppna aggressivitet, få folk att vilja skaffa sig egna lager av vete. Detta innebär kortsiktigt att risken är på uppsidan i priset. Vi fortsätter med köprekommendation.
Maltkorn
Maltkornsterminen för leverans i november ligger fortsatt under 200 euro och spreaden till kvarnvete är ca 25 euro.
Majs
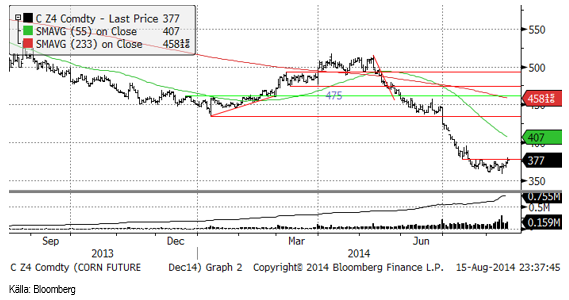
Majspriset vände upp i takt med ökande aggression från Ryssland mot sitt grannland Ukraina. Priset testar just nu ett tekniskt motstånd vid 380 cent. Bryts det, kommer det att släppa loss en våg av köpordrar.
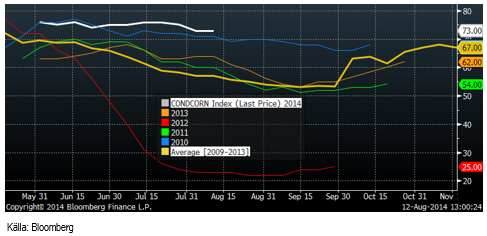
Crop condition var oförändrat på 73% good/excellent.
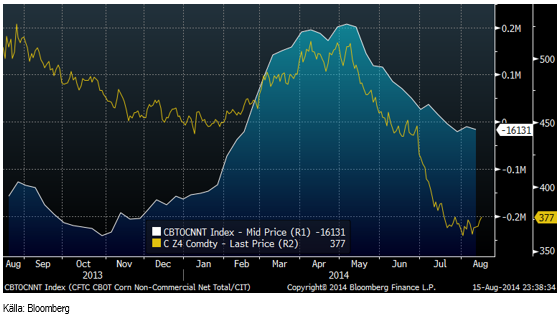
Non-commercials är nettosålda 16,131 kontrakt (förra veckan 10,500).
WASDE-rapporten innehöll, som väntat, en höjning av USA:s produktion och även av EU:s, som också var väntat. Den mycket omdiskuterade hektarskörden i USA hamnade på 167.4 bu/acre och den är survey-baserad. Det är lägre än vad marknaden hade förväntat sig. Spannet i prognoserna låg på 168 – 172, med ett medelvärde på 170. Marknaden reagerade dock varken ”bullish” eller ”bearish”, och marknaden stängde inom några cent från i dagarna innan.
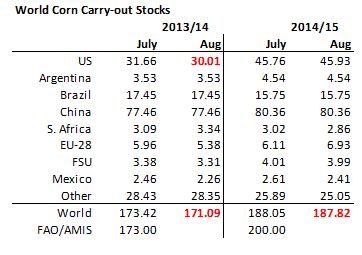
Konsumtionen av majs ökar inte lika mycket som konsumtionen av vete. Det beror på att foderkonsumtionen ökar extra mycket för vete, vilket tar marknad från majsen. Utgående lager väntas nu öka med nästan 17 mt i förhållande till förra året. Däremot ser vi en sänkning av utgående lager, faktiskt, från juli månads estimat. Att det faktiskt blev en sänkning beror på att USDA sänkte carry-in-stocks 2014/15 (carry out 2013/14) med drygt 2 mt.
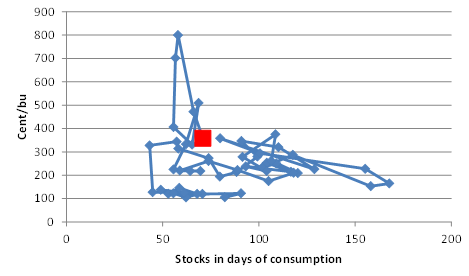
Också för majs är relationen mellan utgående lager och pris nere på nivåer som gällde innan den Kina-drivna råvaruboomen startade för ungefär 10 år sedan.
Bryts det tekniska motståndet i veckan som kommer, signaleras att den fallande pristrenden är bruten. Vädret i Ryssland / Ukraina är gynnsamt för odlingen där, liksom vädret i USA. Fundamentalt sett borde priset gå ner, men på kort sikt skulle ett krig mellan Ryssland och Ukraina driva upp priset. Vi fortsätter med neutral rekommendation, men med rekommendationen att köpa om 380 cent bryts för CZ4.
Sojabönor
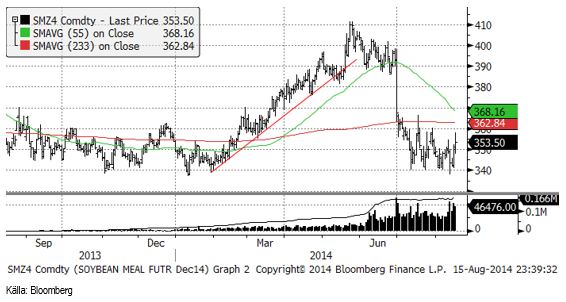
Sojabönorna tycks hålla emot på 1050 cent. Det beror helt och hållet på sojamjölet, medan sojaoljan fortsätter falla.
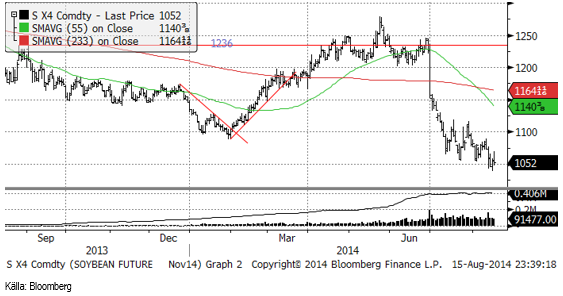
Priset på sojamjöl steg kraftigt i fredags på Rysslands-oro. Sojamjöl är en trång resurs och skulle världen bli oroligare är det en vara som man vill ha i lager.
Sojaoljans prisnedgång i maklig takt, övergick i brant fall efter WASDE-rapporten.
Crop condition för sojabönor backade 1% till 70% good/excellent.
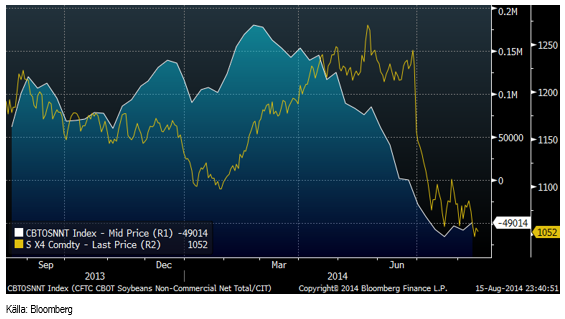
Non-commmercials är nettosålda 49,000 kontrakt (förra veckan 58,000), fortfarande är det ovanligt mycket.
WASDE-rapporten innehöll inga förändringar alls (nästan) vad gäller produktionen av sojabönor.
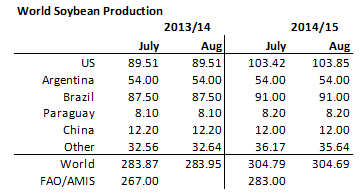
Inte heller utgående lager förändrades nämnvärt i WASDE-rapporten.
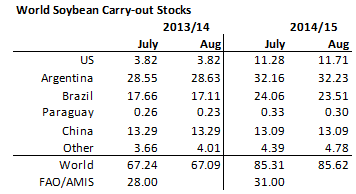
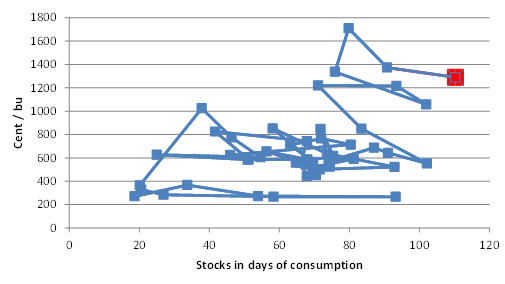
Priset på sojabönor i förhållande till utgående lager på global basis, fortsätter att vara helt ”off the chart”.
Vi fortsätter med neutral rekommendation tills vidare.
Raps
Novemberkontraktet på raps fortsätter att ligga väldigt nära den tekniska stödnivån på 320 euro.
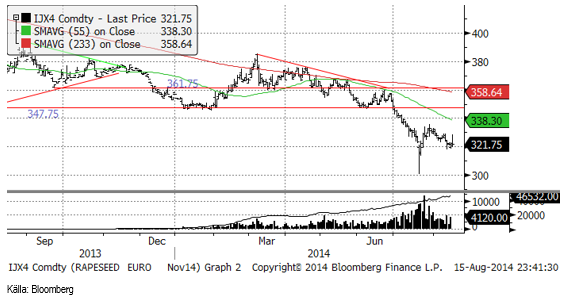
Vi behåller säljrekommendationen på rapsfröterminer.
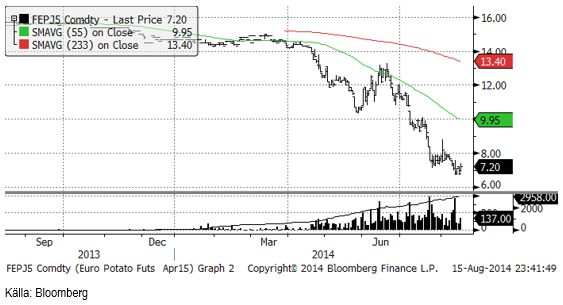
Potatis
Potatis till hör de jordbruksprodukter som drabbas hårdast av Rysslands importembargo. När priset låg under 8 EUR / 100 Kg fanns säkerligen producenter av pommes frites som tyckte att priset fallit tillräckligt för att motivera en prissäkring av inköpen. När sedan Rysslands embargo slog till, kanske dessa insåg att de inte kan exportera lika mycket till Ryssland, och intresset föll av. 7 Euro är nu ett tekniskt stöd och priset stängde på 7.20 i fredags.
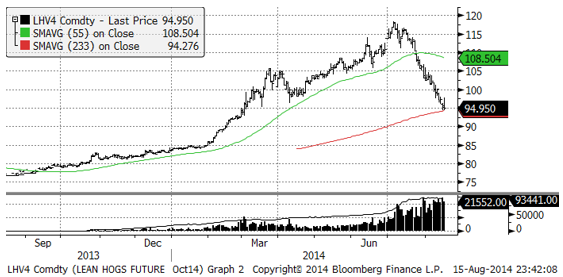
Gris
Lean hogs fortsatte prisfallet och nådde ner till under 95 cent per pund i fredags.
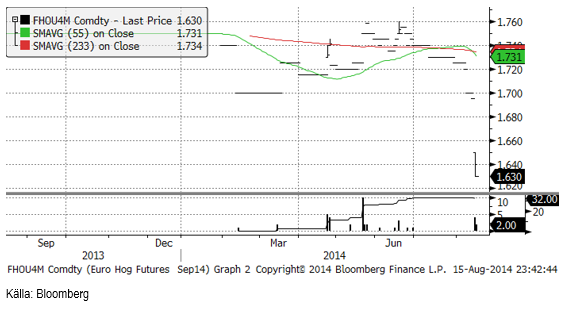
Nedan ser vi kursdiagrammet för septemberkontraktet på EUREX Hogs. Priset har fallit från 1.70 EUR/Kg till 1.63 när marknaden stängde i fredags. Orsaken är Rysslands embargo och ekonomisk statistik som visar att EU tycks vara på väg mot recession igen.
Mjölk
Mjölkpriset har fortsatt att falla handlöst. Det går inte att säga var botten är. Priset kan falla avsevärt mycket lägre. Den mjölk som nu inte används till osttillverkning kommer förmodligen att gå till smör och pulver, vilket sätter ytterligare press på dessa produktmarknaders priser, när väl omställningen skett.
På tisdag 19 augusti är det dags för den andra Global Dairy Trade – auktionen i augusti. Den första, den 5 augusti ägde rum innan Ryssland hade tillkännagivit sitt importembargo på bland annat mjölkprodukter.
Enligt Eurostat var mjölkproduktionen i EU-28 i maj högre än i april på 13.5 mt mot 12.9 mt. Det var en ökning med 4.7%. Alla siffror har ännu inte publicerats för juni, men det verkar som om det kan bli en nedgång med 4% om man tittar på några av de som har rapporterat juni månads statistik. De lägre priserna börjar alltså ha en effekt på produktionen, såsom man kan förvänta sig.
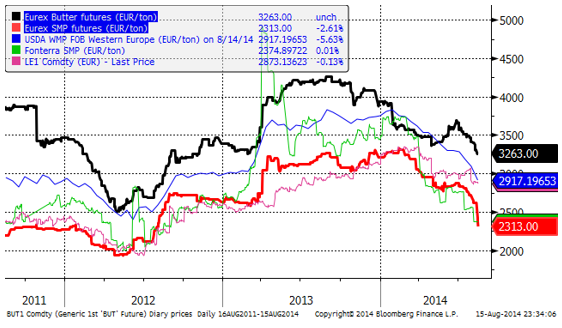
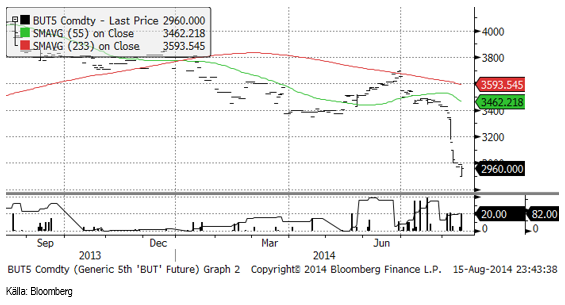
Decemberkontraktet på smör har fortsatt att falla, efter Rysslands embargo.
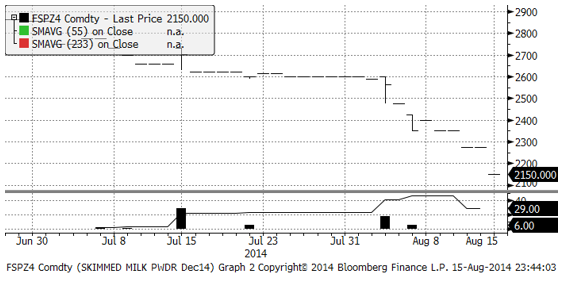
Även terminerna på SMP föll abrupt. Nedan ser vi terminskontrakten för SMP på EUREX. Nedan ser vi decemberkontraktet på SMP, som för en vecka sedan handlades i 2400 EUR/ton. Vid stängning i fredags hade priset för leverans i december av ett ton SMP fallit till 2150 EUR/ton.
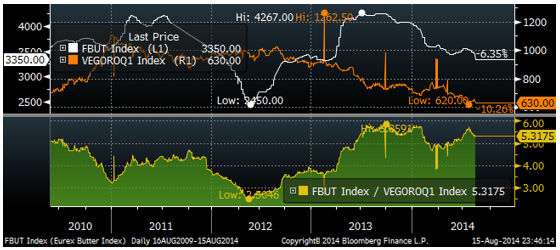
Smör är fortfarande dyrt om man jämför EUREX smör-index för spotpriset i norra Kontinentaleuropa med rapsolja (UkrAgroConsults notering för rapsolja FOB Rotterdam).
Nedan ser vi terminspriserna för mjölkråvara basis köpkurserna på terminerna för smör och SMP på EUREX, omräknat till kronor per kilo. Det genomsnittliga priset för leverans av 1 Kg per månad från september till och med augusti nästa år är 2.92 kr / Kg. Det är en nedgång i terminspriserna på 25% från början på året.
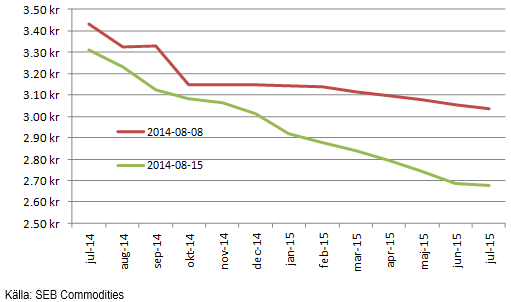
Vi kan inte bedöma om detta är rätt nivå just nu. Osäkerheten är mycket stor. Risken är stor att prisraset fortsätter och det går inte att säga hur djupt det kan bli. Prisuppgång, mer än marginellt, är uteslutet. Så vi fortsätter med säljrekommendation.
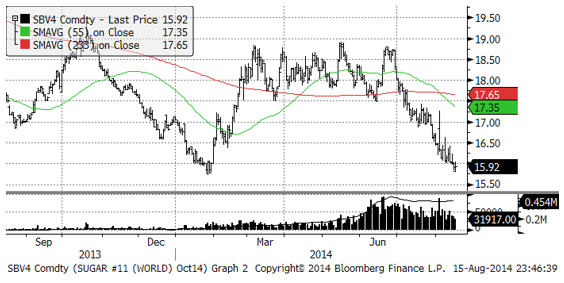
Socker
Priset på socker fortsatte falla i veckan och är nu nere på bottennivåerna som registrerades i början av året.
[box]SEB Veckobrev Jordbruksprodukter är producerat av SEB Commodities Sales desk och publiceras i samarbete och med tillstånd på Råvarumarknaden.se[/box]
Detta marknadsföringsmaterial, framtaget av SEB’s Commodities Sales desk, har upprättats enbart i informationssyfte.
Även om innehållet är baserat på källor som SEB bedömt som tillförlitliga ansvarar SEB inte för fel eller brister i informationen. Den utgör inte oberoende, objektiv investeringsanalys och skyddas därför inte av de bestämmelser som SEB har infört för att förebygga potentiella intressekonflikter. Yttranden från SEB’s Commodities Sales desk kan vara oförenliga med tidigare publicerat material från SEB, då den senare hänvisas uppmanas du att läsa den fullständiga rapporten innan någon åtgärd vidtas.
Dokumentationen utgör inte någon investeringsrådgivning och tillhandahålls till dig utan hänsyn till dina investeringsmål. Du uppmanas att självständigt bedöma och komplettera uppgifterna i denna dokumentation och att basera dina investeringsbeslut på material som bedöms erforderligt. Alla framåtblickande uttalanden, åsikter och förväntningar är föremål för risker, osäkerheter och andra faktorer och kan orsaka att det faktiska resultatet avviker väsentligt från det förväntade. Historisk avkastning är ingen garanti för framtida resultat. Detta dokument utgör inte ett erbjudande att teckna några värdepapper eller andra finansiella instrument. SEB svarar inte för förlust eller skada – direkt eller indirekt, eller av vad slag det vara må – som kan uppkomma till följd av användandet av detta material eller dess innehåll.
Observera att det kan förekomma att SEB, dess ledamöter, dess anställda eller dess moder- och/eller dotterbolag vid olika tillfällen innehar, har innehaft eller kommer att inneha aktier, positioner, rådgivningsuppdrag i samband med corporate finance-transaktioner, investment- eller merchantbankinguppdrag och/eller lån i de bolag/finansiella instrument som nämns i materialet.
Materialet är avsett för mottagaren, all spridning, distribuering mångfaldigande eller annan användning av detta meddelande får inte ske utan SEB:s medgivande. Oaktat detta får SEB tillåta omfördelning av materialet till utvald tredje part i enlighet med gällande avtal. Materialet får inte spridas till fysiska eller juridiska personer som är medborgare eller har hemvist i ett land där sådan spridning är otillåten enligt tillämplig lag eller annan bestämmelse.
Skandinaviska Enskilda Banken AB (publ) är ett [publikt] aktiebolag och står under tillsyn av Finansinspektionen samt de lokala finansiella tillsynsmyndigheter i varje jurisdiktionen där SEB har filial eller dotterbolag.


The latest weekly report from the US DOE showed a substantial drawdown across key petroleum categories, adding more upside potential to the fundamental picture.

Commercial crude inventories (excl. SPR) fell by 5.8 million barrels, bringing total inventories down to 415.1 million barrels. Now sitting 11% below the five-year seasonal norm and placed in the lowest 2015-2022 range (see picture below).
Product inventories also tightened further last week. Gasoline inventories declined by 2.1 million barrels, with reductions seen in both finished gasoline and blending components. Current gasoline levels are about 3% below the five-year average for this time of year.
Among products, the most notable move came in diesel, where inventories dropped by almost 4.1 million barrels, deepening the deficit to around 20% below seasonal norms – continuing to underscore the persistent supply tightness in diesel markets.
The only area of inventory growth was in propane/propylene, which posted a significant 5.1-million-barrel build and now stands 9% above the five-year average.
Total commercial petroleum inventories (crude plus refined products) declined by 4.2 million barrels on the week, reinforcing the overall tightening of US crude and products.


A classic case of “buy the rumor, sell the news” played out in oil markets, as Brent crude has dropped sharply – down nearly USD 10 per barrel since yesterday evening – following Iran’s retaliatory strike on a U.S. air base in Qatar. The immediate reaction was: “That was it?” The strike followed a carefully calibrated, non-escalatory playbook, avoiding direct threats to energy infrastructure or disruption of shipping through the Strait of Hormuz – thus calming worst-case fears.
After Monday morning’s sharp spike to USD 81.4 per barrel, triggered by the U.S. bombing of Iranian nuclear facilities, oil prices drifted sideways in anticipation of a potential Iranian response. That response came with advance warning and caused limited physical damage. Early this morning, both the U.S. President and Iranian state media announced a ceasefire, effectively placing a lid on the immediate conflict risk – at least for now.
As a result, Brent crude has now fallen by a total of USD 12 from Monday’s peak, currently trading around USD 69 per barrel.
Looking beyond geopolitics, the market will now shift its focus to the upcoming OPEC+ meeting in early July. Saudi Arabia’s decision to increase output earlier this year – despite falling prices – has drawn renewed attention considering recent developments. Some suggest this was a response to U.S. pressure to offset potential Iranian supply losses.
However, consensus is that the move was driven more by internal OPEC+ dynamics. After years of curbing production to support prices, Riyadh had grown frustrated with quota-busting by several members (notably Kazakhstan). With Saudi Arabia cutting up to 2 million barrels per day – roughly 2% of global supply – returns were diminishing, and the risk of losing market share was rising. The production increase is widely seen as an effort to reassert leadership and restore discipline within the group.
That said, the FT recently stated that, the Saudis remain wary of past missteps. In 2018, Riyadh ramped up output at Trump’s request ahead of Iran sanctions, only to see prices collapse when the U.S. granted broad waivers – triggering oversupply. Officials have reportedly made it clear they don’t intend to repeat that mistake.
The recent visit by President Trump to Saudi Arabia, which included agreements on AI, defense, and nuclear cooperation, suggests a broader strategic alignment. This has fueled speculation about a quiet “pump-for-politics” deal behind recent production moves.
Looking ahead, oil prices have now retraced the entire rally sparked by the June 13 Israel–Iran escalation. This retreat provides more political and policy space for both the U.S. and Saudi Arabia. Specifically, it makes it easier for Riyadh to scale back its three recent production hikes of 411,000 barrels each, potentially returning to more moderate increases of 137,000 barrels for August and September.
In short: with no major loss of Iranian supply to the market, OPEC+ – led by Saudi Arabia – no longer needs to compensate for a disruption that hasn’t materialized, especially not to please the U.S. at the cost of its own market strategy. As the Saudis themselves have signaled, they are unlikely to repeat previous mistakes.
Conclusion: With Brent now in the high USD 60s, buying oil looks fundamentally justified. The geopolitical premium has deflated, but tensions between Israel and Iran remain unresolved – and the risk of missteps and renewed escalation still lingers. In fact, even this morning, reports have emerged of renewed missile fire despite the declared “truce.” The path forward may be calmer – but it is far from stable.
Analys
A muted price reaction. Market looks relaxed, but it is still on edge waiting for what Iran will do
Brent crossed the 80-line this morning but quickly fell back assigning limited probability for Iran choosing to close the Strait of Hormuz. Brent traded in a range of USD 70.56 – 79.04/b last week as the market fluctuated between ”Iran wants a deal” and ”US is about to attack Iran”. At the end of the week though, Donald Trump managed to convince markets (and probably also Iran) that he would make a decision within two weeks. I.e. no imminent attack. Previously when when he has talked about ”making a decision within two weeks” he has often ended up doing nothing in the end. The oil market relaxed as a result and the week ended at USD 77.01/b which is just USD 6/b above the year to date average of USD 71/b.

Brent jumped to USD 81.4/b this morning, the highest since mid-January, but then quickly fell back to a current price of USD 78.2/b which is only up 1.5% versus the close on Friday. As such the market is pricing a fairly low probability that Iran will actually close the Strait of Hormuz. Probably because it will hurt Iranian oil exports as well as the global oil market.
It was however all smoke and mirrors. Deception. The US attacked Iran on Saturday. The attack involved 125 warplanes, submarines and surface warships and 14 bunker buster bombs were dropped on Iranian nuclear sites including Fordow, Natanz and Isfahan. In response the Iranian Parliament voted in support of closing the Strait of Hormuz where some 17 mb of crude and products is transported to the global market every day plus significant volumes of LNG. This is however merely an advise to the Supreme leader Ayatollah Ali Khamenei and the Supreme National Security Council which sits with the final and actual decision.
No supply of oil is lost yet. It is about the risk of Iran closing the Strait of Hormuz or not. So far not a single drop of oil supply has been lost to the global market. The price at the moment is all about the assessed risk of loss of supply. Will Iran choose to choke of the Strait of Hormuz or not? That is the big question. It would be painful for US consumers, for Donald Trump’s voter base, for the global economy but also for Iran and its population which relies on oil exports and income from selling oil out of that Strait as well. As such it is not a no-brainer choice for Iran to close the Strait for oil exports. And looking at the il price this morning it is clear that the oil market doesn’t assign a very high probability of it happening. It is however probably well within the capability of Iran to close the Strait off with rockets, mines, air-drones and possibly sea-drones. Just look at how Ukraine has been able to control and damage the Russian Black Sea fleet.
What to do about the highly enriched uranium which has gone missing? While the US and Israel can celebrate their destruction of Iranian nuclear facilities they are also scratching their heads over what to do with the lost Iranian nuclear material. Iran had 408 kg of highly enriched uranium (IAEA). Almost weapons grade. Enough for some 10 nuclear warheads. It seems to have been transported out of Fordow before the attack this weekend.
The market is still on edge. USD 80-something/b seems sensible while we wait. The oil market reaction to this weekend’s events is very muted so far. The market is still on edge awaiting what Iran will do. Because Iran will do something. But what and when? An oil price of 80-something seems like a sensible level until something do happen.


USA ska införa 50 procent tull på koppar

Ryska staten siktar på att konfiskera en av landets största guldproducenter

Hur säkrar vi Sveriges tillgång till kritiska metaller och mineral i en ny geopolitisk verklighet?

Lundin Mining ska bli en av de tio största kopparproducenterna i världen

Sommarvädret styr elpriset i Sverige

Uppgången i oljepriset planade ut under helgen

Mahvie Minerals växlar spår – satsar fullt ut på guld

Låga elpriser i sommar – men mellersta Sverige får en ökning

Oljan, guldet och marknadens oroande tystnad
Very relaxed at USD 75/b. Risk barometer will likely fluctuate to higher levels with Brent into the 80ies or higher coming 2-3 weeks
-
 Nyheter4 veckor sedan
Uppgången i oljepriset planade ut under helgen
-
 Nyheter3 veckor sedan
Mahvie Minerals växlar spår – satsar fullt ut på guld
-
 Nyheter4 veckor sedan
Låga elpriser i sommar – men mellersta Sverige får en ökning
-
 Nyheter2 veckor sedan
Oljan, guldet och marknadens oroande tystnad
-
Analys4 veckor sedan
Very relaxed at USD 75/b. Risk barometer will likely fluctuate to higher levels with Brent into the 80ies or higher coming 2-3 weeks
-

 Nyheter2 veckor sedan
Jonas Lindvall är tillbaka med ett nytt oljebolag, Perthro, som ska börsnoteras
-
Analys3 veckor sedan
A muted price reaction. Market looks relaxed, but it is still on edge waiting for what Iran will do
-

 Nyheter2 veckor sedan
Domstolen ger klartecken till Lappland Guldprospektering