

Analys
SEB – Råvarukommentarer, 18 augusti 2014

Rekommendationer
*) Senaste veckobrevet kom den 4 augusti, men prisförändringen avser senaste veckan.
Kort sammanfattning
EU går av allt att döma in i recession igen. Ryska förband har gått över gränsen till Ukraina, vilket lär ha skett då och då under lång tid. Skillnaden är att journalister från väst (Guardian, Telegraph) nu fotograferat, filmat och skrivit om det. NATO:s danske chef talar om ”incursion”, istället för ”invasion”. Båda orden betyder invasion. ”Incursion” är en eufemism för ”invasion”.
Den här konflikten börjar nu sätta sin prägel på de globala råvarumarknaderna. Direkt på invasionsnyheten i fredags steg vete och majspriset, som mest med 3.5%, en ovanligt stor prisrörelse. Mjölkpriset rasade ytterligare 10% i veckan som gick. Potatis och grispriset i Europa föll också med 5 – 10%. Marknaden gör tolkningen att priset inte hämtar sig. Sojamjölspriset steg (sojamjöl är också en matvara som är bra att ha i skafferiet om det blir oroligt på världshaven).
Oljepriset steg i fredags, men guldpriset har inte rört sig som man kunnat förvänta sig av historiska liknande situationer.
Råolja – Brent
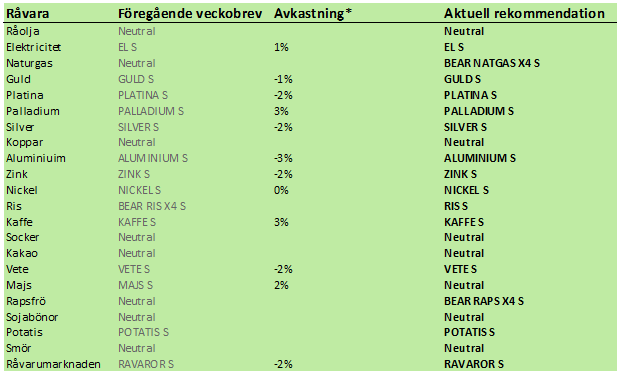
Oljepriset studsade på 102 dollar. Nedgången från 106-108 är ungefär lika lång som från 116 till 106-108. Enligt teknisk analys skulle därför nedgångsfasen vara över och vi skulle kunna förvänta oss en konsolidering vid 102-106, ungefär.
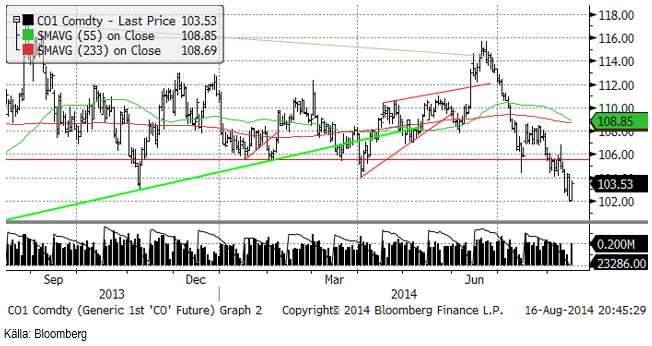
I juni bröt oljepriset den stora triangelformationen på uppsidan, vilket var en köpsignal. Därefter vände priset ner kraftigt och ligger nu under triangelformationen. Det är alltså en teknisk säljsignal. Vi skulle kunna få en uppgång till 110 dollar per fat igen, utan att den negativa bilden skulle störas på längre sikt. Det är ofta, men inte alltid, man ser en sådan sista uppgång innan prisfallet sätter in.
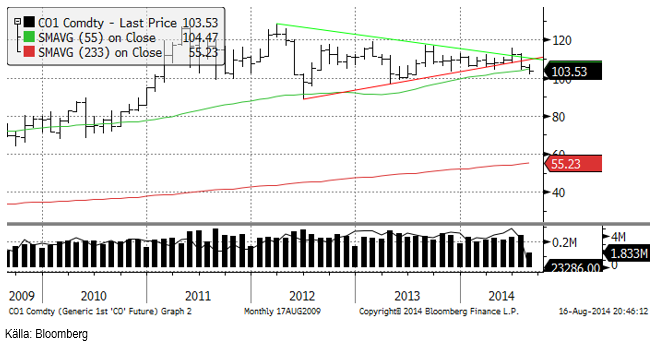
Det råder contango det första halvåret i Brent-marknaden.
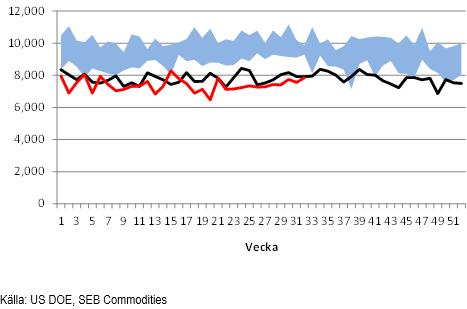
Råoljelagren i USA minskar fortfarande säsongsmässigt, men nedgången börjar plana ut – på rekordnivåer.
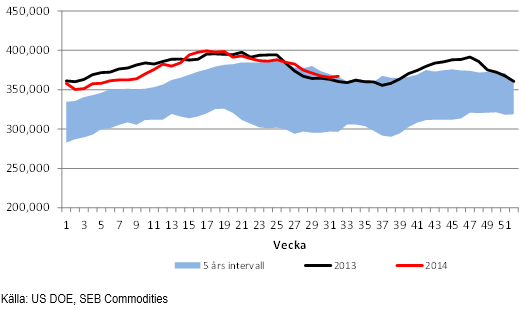
Importvolymerna till USA ligger under förra årets, men importen har ökat de senaste veckorna. Detta kan bero på det lite spända läget i världen.
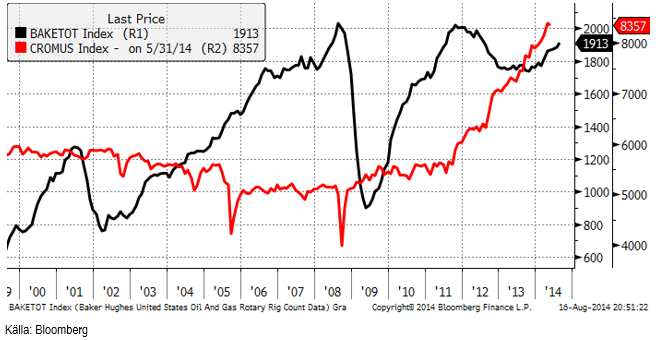
Nedan ser vi ett diagram på antalet oljeriggar i USA, som fortsatt att stiga enligt Baker Hughes statistik (svart) och USA:s oljeproduktion enligt US DOE på 8.357 mbpd. Av antalet riggar kan man inte förstå att oljeproduktionen skulle stiga. Det är ny teknik efter 2008/09 (fracking) som gör att riggarna är mer produktiva än de var på tidigt 00-tal.
USA kommer att gå förbi Ryssland och Saudiarabien i år eller nästa år och återigen bli världens största producent av råolja. Tekniken går naturligtvis att använda på andra ställen, men den har ännu inte fått någon större spridning.
Med det contango som nu råder, får man betalt för att ligga kort. Vi tror inte på en köpt position, men nöjer oss för närvarande med att inte ha någon position alls.
Elektricitet
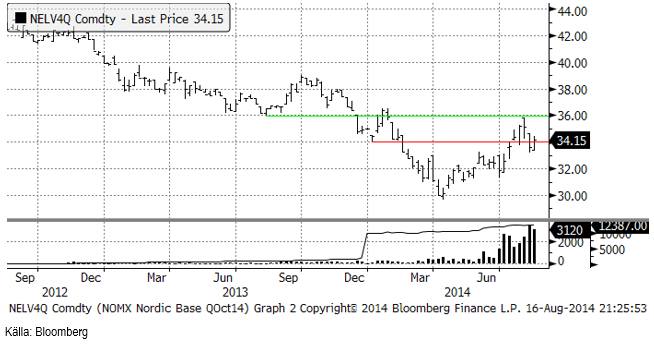
Terminskontraktet för det fjärde kvartalet befinner sig sedan ett par veckor i rekyl nedåt. Tekniskt stöd finns vid 33 och motstånd vid 36 euro per MWh. Den medellångsiktiga trenden är uppåtriktad och vi tror att man hellre ska köpa än sälja. Vi fortsätter alltså med köprekommendation.
Hydrologisk balans har de senaste månaderna sjunit till ett underskott.
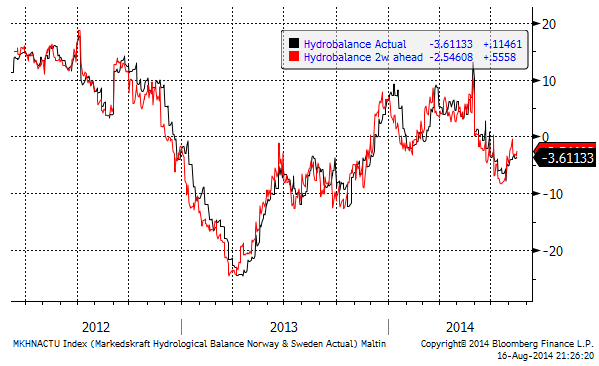
Vi rekommenderar köp av EL S om priset kommer ner lite. Som vi ser av väderleksprognosen för de kommande två veckorna nedan under ”Odlingsväder”, ser det väldigt blött ut för Norden.
Naturgas
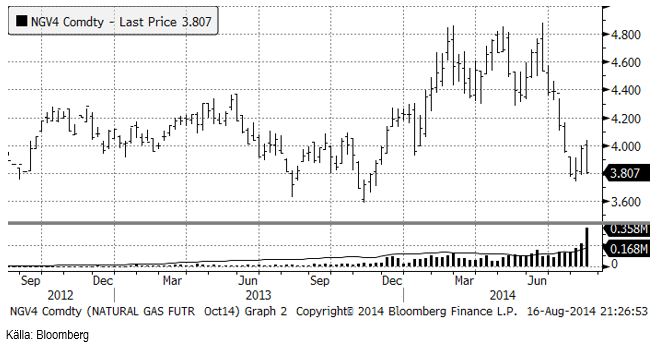
De senaste veckorna har priset på naturgas konsoliderat sig efter det kraftiga prisfallet från 4.80 ner till 3.80. Den ”absoluta botten” ligger vid 3.60 dollar. Det är nu inte helt säkert att det är en så absolut botten. Som vi såg ovan fortsätter antalet riggar att öka, vilket framförallt ger extra produktion av naturgas i USA.
Vi noterar också den stora ökningen i omsättning i veckan som gick, vilket skedde på sjunkande pris. Att intresset ökar på sjunkande pris, säger oss att dynamiken är på nedsidan.
Vi fortsätter alltså med säljrekommendation, och rekommenderar därför köp av t ex BEAR NATGAS X4 S.
Koppar
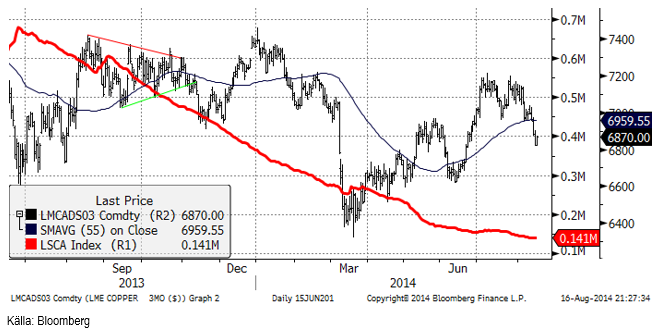
Fundamenta ter sig lite svagare och ur ett tekniskt perspektiv finns risken att kopparpriset fortsätter ner, trots det stora prisfallet. Prisutvecklingen för koppar skiljer sig från de andra basmetallerna, som alla har brutit sina fleråriga fallande pristrender. Detta återspeglar också den fundamentala situationen för koppar, som troligtvis går mot överskott i utbuds/efterfråge-balansen, efter flera år av underskott.
Vi anser dock att det är för tidigt att gå kort koppar. Man måste komma ihåg att lagernivåerna fortfarande är ganska små, vilket gör marknaden känslig för förändringar i efterfrågesidan. Detta verkar inte finnas i korten just nu, men med Kinas köp av lager till sin strategiska reserv i minne (det senaste stora köpet satte punkt för prisnedgången i mars i år), kan aktörer vara försiktiga med att gå kort koppar. Den psykologiska effekten av detta kan i sig självt vara den stödjande faktor för priset som håller det uppe.
Vi rekommenderar neutral position i koppar.
Aluminium
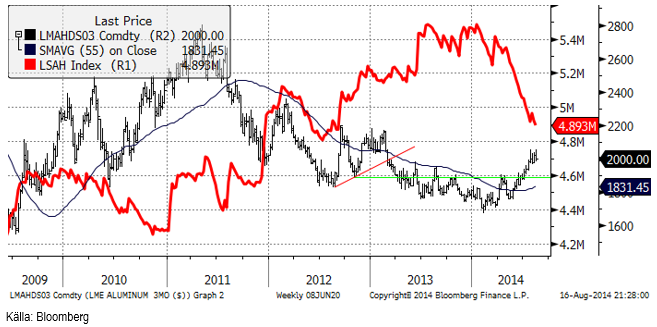
Som man kunde vänta sig, ledde det överköpta läget till en rekyl i aluminiumpriset. Den utlösande händelsen var uppenbarligen onsdagens kinesiska statistik. Efter att ha testat den tidigare toppnoteringen på strax över 2050 dollar, blev aluminium rätt påsåld under resten av veckan. Ur en teknisk synvinkel utgör fredagens stängning utanför trendkanalen en signal om ett fall ner till juli månads lägsta vid 1970 dollar. Trots likvideringen i veckan som gick, håller aluminium emot bättre än resten av basmetallerna. Det kan hända att marknaden oroar sig för möjliga störningar i den ryska exporten om sanktionskriget fortsätter att eskalera. Ryssland exporterar 80% av sin produktion på 3.7 miljoner ton.
Vi fortsätter alltså med köprekommendation på ALUMINIUM S.
Zink
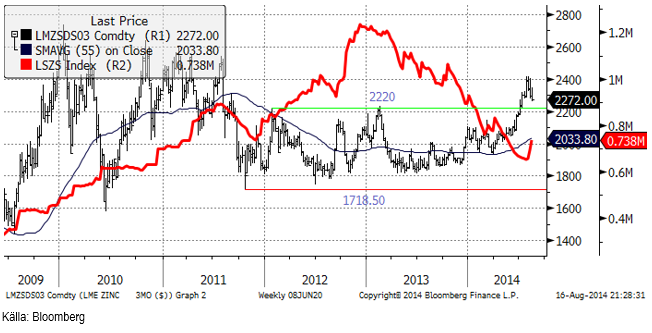
Zinkmarknaden drabbades av lite tyngre vinsthemtagningar i veckan än vi hade räknat med. Vinsthemtagningarna började redan förra veckan oh fortsatte som sagt. Tekniskt stöd finns på 2220 dollar. Det har kommit ett par stora inleveranser till LME:s lager, som vi ser av den röda kurvan nedan. Den positiva trenden har tidigare ridit på det sjunkande LME-lagret. De stora inleveranserna antyder att det handlar om material som flyttas från finansieringsaffärer i lager utanför LME, in till den mer likvida LME-marknaden. Det handlar alltså inte egentligen om material som blivit över när gruvbolag säljer metall till konsumenter.
Vi anser fortsatt att zink-balansen går mot en stadig förbättring och att man ska betrakta den här rekylen som ett köptillfälle. Tekniskt stöd finns som tidigare nämnt vid 2220. Det är sällan priset når ända till ett stöd om flera vill köpa.
Vi rekommenderar köp på en sådan rekyl, av t ex ZINK S.
Nickel
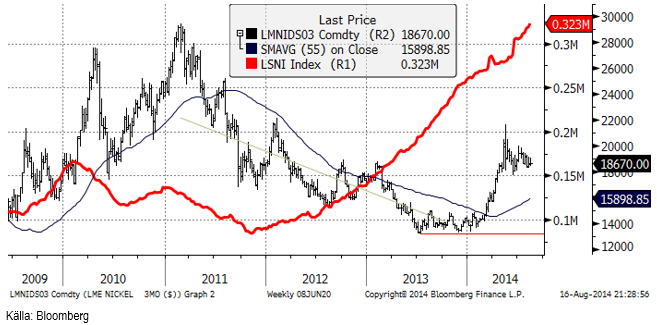
I en rapport från Metal Bulletin kommenterar de marknaden så här: ”LME-priset på nickel fortsätter att konsolidera sig, terminsmarknaden har gått in i contango, antalet utestående terminskontrakt minskar, då spekulanter som vill köpa intresserar sig för andra håll för närvarande, lagren på LME stiger fortfarande, fysiska premier är oförändrade i USA, men lägre i Asien och Europa och NPI och nickelmalmspriserna har planat ut under sina tidigare toppar.” Det låter inte särskilt inspirerande, men allt det är i stort sett i linje med vad vi hört från andra håll.
Detta förtar in att det finns en risk för ökad brist senare i år. Det indonesiska energi- och resursministeriet sade i veckan att nästa regering (som tar över i mitten av oktober) kommer att behålla exportförbudet. Detta är alltså utgångspunkten för närvarande och vi behåller vår positiva vy på prisutvecklingen på nickel. På kort sikt är dock risken på uppsidan begränsad, eftersom nickelmarknaden alltid är svag, säsongsmässigt, så här års. Vi anser att prisnedgångar kan utnyttjas för att köpa, i synnerhet om priset går ner till mellan 18000 och 18500 dollar.
Guld
I torsdags publicerade World Gold Council sin rapport Gold Demand Trends för det andra kvartalet i år. Den visade att smyckesefterfrågan på guld är följer den tillväxttrend som pågått sedan år 2009. WGC rapporterar också att investeringsefterfrågan ökat med 4% och att utflödet ur guld-ETC:er minskat. Centralbankerna köpte 118 ton guld under det andra kvartalet, vilket är en ökning med 28% sedan samma period förra året. Samtidigt ökade gruvproduktionen med 13%. Skrotningen av gamla smycken minskade dock, vilket innebär att utbudet ökade med 10%. I torsdags rapporterade Sydafrika hur stor landets guldproduktion var i 1.2% lägre i juni än samma månad förra året. Det är en förändring i nivå med de senaste åren.
Svenska placerare har ökat sina innehav i SEB:s certifikat på ädelmetaller med 80% i år. Nivån ligger dock fortfarande under toppnivåerna kring årsskiftet 2012/13. En skillnad är att fler investerat i silver, platina och palladium och inte enbart i guld som tidigare varit helt dominerande inom ädelmetallsegmentet.
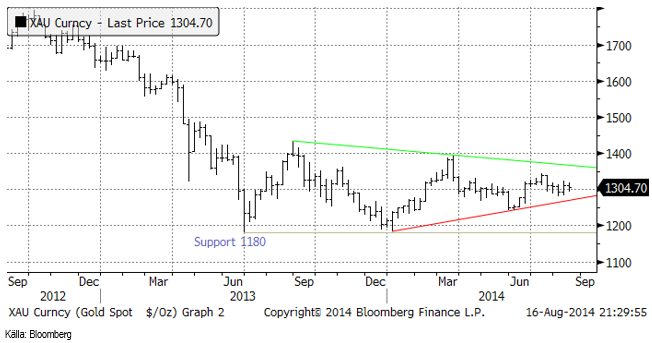
Nedan ser vi ett veckochart över guldprisets utveckling i dollar. Den stora konsolidering med en triangelformation som bildades efter prisnedgången förra året är fortfarande intakt. Vi väntar på utbrott uppåt eller nedåt.
Nedan ser vi antalet andelar i GLD-fonden och guldprisets utveckling. Vi ser att sedan mitten av juli har investerare faktiskt sålt av andelar.
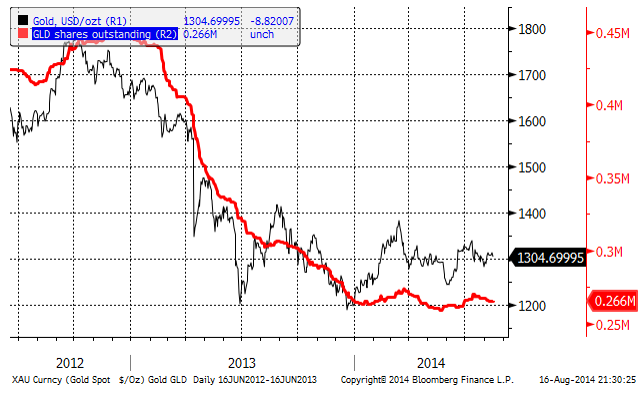
Guldpriset har utklassat svenska aktier i år. Guldpriset har stigit från 7907 kr / uns vid årsskiftet till 8918 kr i fredags. Det är en uppgång på 12.8%. OMXS30 har samtidigt gått från 1334 till 1353, en betydligt blygsammare uppgång på 1.4%.
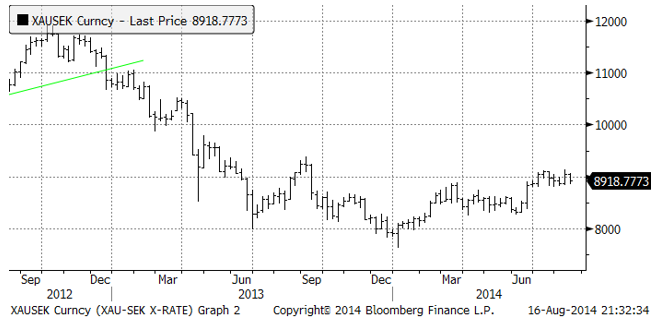
Vi rekommenderar köp av GULD S.
Silver
Den sista fastställningen av “London silver fix” ägde rum i torsdags. I 117 år har silver-fixen varit ledstjärnan i silvermarknaden. I fredags handlades silver elektroniskt. CME Group förser marknaden med den elektroniska handelsplattformen och algoritmen, medan Thomson Reuters ansvarar för administrationen. Auktionen börjar klockan 12:00 GMT, som förut.
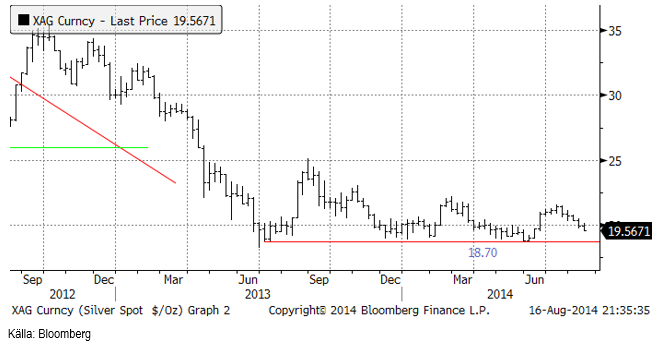
Silverpriset befinner sig ännu tydligare i konsolidering inom ett snävt prisintervall. I diagrammet nedan ser vi hur 18.70 dollar per uns gett stöd varje gång priset gått ner till den nivån i över ett år.
Nedan ser vi ett diagram över priset på guld uttryckt i silver. Silver, har återigen blivit historiskt billigt i förhållande till guld och det talar för att hellre köpa silver än guld just nu.
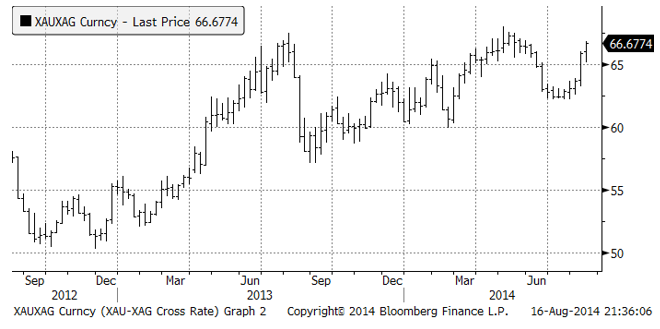
Vi anser att silver är mer köpvärt än guld och skulle vilja köpa på de här nivåerna. Vi rekommenderar köp av SILVER S.
Platina & Palladium
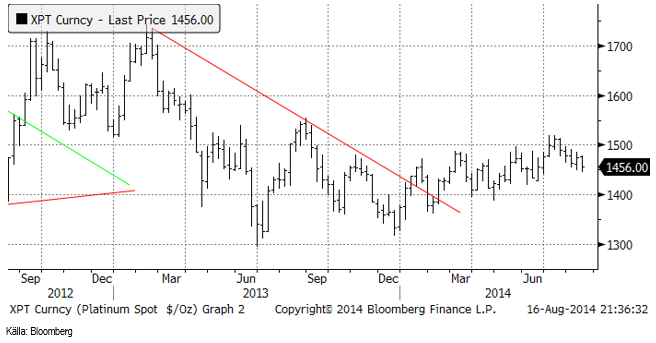
Platinapriset orkade inte över motståndsnivån vid 1525 dollar per ozt och har i juli fallit tillbaka till 1456. Tekniskt ser platina ut att ha rätt kämpigt att ta sig över 1525 och det finns risk för besvikelser, vilket kan leda till likvidering och kursfall istället.
Prisdiagrammet på palladium ser vi nedan. Priset närmar sig 900 dollar efter veckans kursrusning.
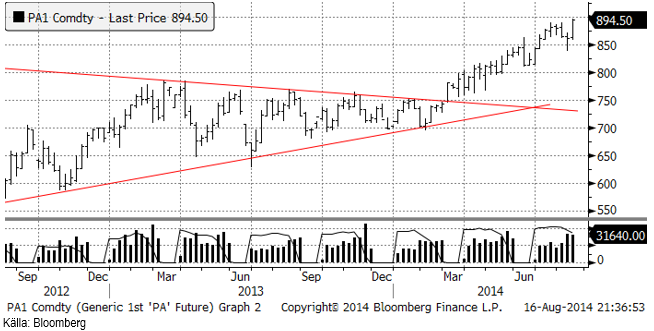
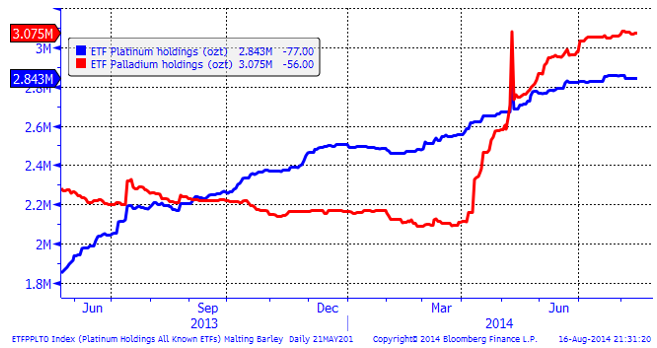
Nedanför ser vi hur mycket metall som finns i börshandlade fonder för platina respektive palladium.
Vi rekommenderar köp av PLATINA S och PALLADIUM S.
Ris
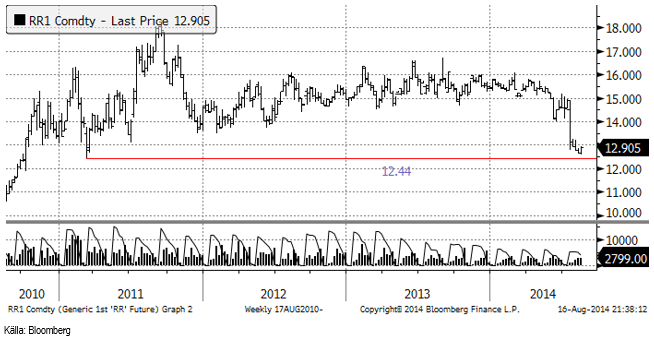
Priset på ris (novemberkontraktet på CME) rekylerade uppåt i veckan som gick efter USDA:s WASDE-rapport. Priset har också stöd av den tekniska stödnivån vid 12.44 dollar per cwt.
USDA justerade ner produktionsestimatet för Indiens risproduktion med 1 mt till 103 mt för 2014/14. Det är monsunskörden som sänkts eftersom det regnat mindre än normalt. På global basis sjunker produktionen av ris med drygt 2 mt.
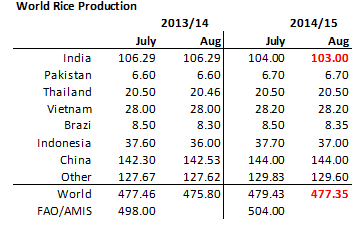
Konsumtionen av ris följer befolkningsutvecklingen rätt väl och 2 mt lägre produktion slår lätt över i 3 mt lägre utgående lager, som vi ser nedan.
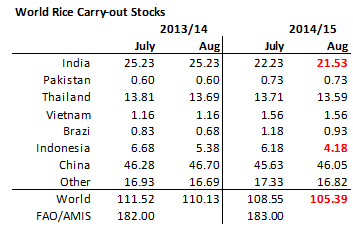
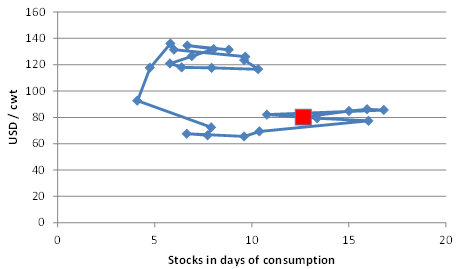
Rispriset ligger lågt i ett historiskt perspektiv, även med hänsyn tagen till att lagren är ganska höga.
Vi fortsätter att rekommendera köp av RIS S.
Kaffe
Kaffepriset har varit en rekyl uppåt sedan mitten av juli. Den tycks vara aktiv igen och det kanske blir en ny hausse i veckan som kommer. På det hela taget tolkar vi detta som svängningar efter den chock som torkan i januari och februari förde med sig. Det finns inte någon ny händelse som har kraft att störa marknaden för att få en ny uppgång till över 220 cent, vårens mest extrema prisnivå. Det handlar snarare om ett sökande efter en nivå som är rätt givet vad som har hänt.
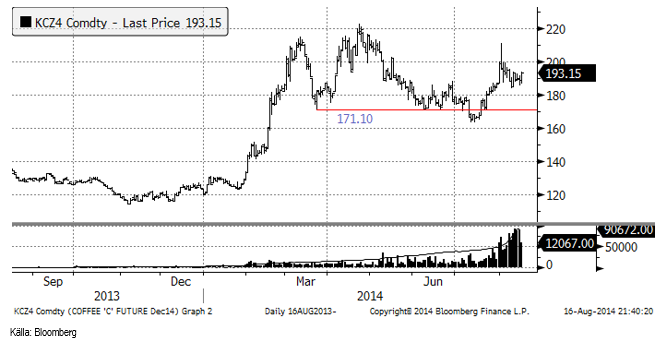
Med det sagt, så måste vi ändå välja och då väljer vi hellre att just nu vara köpta kaffe än sålda.
Kakao
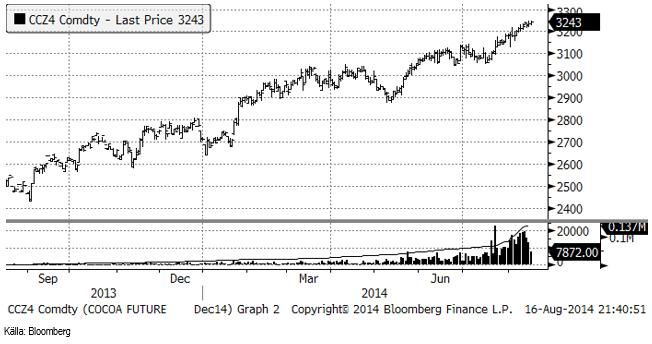
Decemberkontraktet på kakao i New York, CCZ4, fortsätter att ånga på. Uppgångsfasen är dock rätt mogen och en rekyl nedåt skulle inte förvåna.
Tekniskt ser vi att omsättningen sjunker samtidigt som priset når nya högsta noteringar. Divergensen mellan sjunkande volym och nya toppnoteringar är ett varningstecken.
[box]SEB Veckobrev Veckans råvarukommentar är producerat av SEB Merchant Banking och publiceras i samarbete och med tillstånd på Råvarumarknaden.se[/box]
Disclaimer
The information in this document has been compiled by SEB Merchant Banking, a division within Skandinaviska Enskilda Banken AB (publ) (“SEB”).
Opinions contained in this report represent the bank’s present opinion only and are subject to change without notice. All information contained in this report has been compiled in good faith from sources believed to be reliable. However, no representation or warranty, expressed or implied, is made with respect to the completeness or accuracy of its contents and the information is not to be relied upon as authoritative. Anyone considering taking actions based upon the content of this document is urged to base his or her investment decisions upon such investigations as he or she deems necessary. This document is being provided as information only, and no specific actions are being solicited as a result of it; to the extent permitted by law, no liability whatsoever is accepted for any direct or consequential loss arising from use of this document or its contents.
About SEB
SEB is a public company incorporated in Stockholm, Sweden, with limited liability. It is a participant at major Nordic and other European Regulated Markets and Multilateral Trading Facilities (as well as some non-European equivalent markets) for trading in financial instruments, such as markets operated by NASDAQ OMX, NYSE Euronext, London Stock Exchange, Deutsche Börse, Swiss Exchanges, Turquoise and Chi-X. SEB is authorized and regulated by Finansinspektionen in Sweden; it is authorized and subject to limited regulation by the Financial Services Authority for the conduct of designated investment business in the UK, and is subject to the provisions of relevant regulators in all other jurisdictions where SEB conducts operations. SEB Merchant Banking. All rights reserved.

Selling down on a ”deal”. Brent crude fell 6.2% last week with accelerated weakness towards the end of the week. Close of the week at $87.33/b and low of the week (and on Friday) of $85.8/b. Brent is falling another 4% this morning to $83.7/b on confirmation by Iran that a MoU text has been reached and that it will be signed on Friday this week.

So what is this ”deal” worth? Talk on the desk here this morning is that it is much like ”putting lipstick on a pig” where Trump has to sell this at home as a victory where ”the SoH has reopened”, the nuclear issue will be ironed out over the coming 60 days (or maybe 600 days?) and US consumers are getting a lower gasoline price and maybe US republicans survives the midterm elections.
The importance for Iran is that it emerges as the defacto winner of this war in the eyes of the non-US public world. That Iran now onwards is the ”ruler of the SoH” (combo of geography and new weapons systems like drones) or more softer: ”the guarantor of safe passage through the SoH”.
Iran doesn’t need nuclear weapons any more. Nuclear deterrence doesn’t work any more. Ukraine has made many attacks deep into Russia without being nuked in return. Plenty of Iranian ballistic rockets blasts over Israel but Iran wasn’t nuked in return.
There is no trust between the US and Iran. We don’t know all the details yet of the MoU. But what we do know is that there is no trust between the US and Iran what so ever. This is probably more like a descriptive text on how they can cooperate in a way where both sides keeps tactical leverage. Neither side makes irreversible concessions. Violations can be punished quickly. Cooperation produces immediate benefits.
This is a fragile structure. It can easily break down. There may be details which cannot be overcome. To be seen on Friday. The US has to show that it is willing put enough force behind managing and restraining Israel versus Hezbollah in Lebanon. We have seen that Netanyahu hasn’t listened all that much to Trump’s directives and wishes. This could be a major obstacle.
A gradual reopening is tactically preferable for Iran. A tactical leverage for Iran right now is that global oil stocks have been drawn down towards painful and increasingly dangerous levels with increasing risks for oil price spikes in mid-July to August. This together with US midterm elections on 3 November gives tactical leverage to Iran. Iran probably doesn’t want to fully give up on that leverage. A rapid, full reopening where global stocks are able to refill over the coming 60 days will significantly erode that leverage. If Iran reinstates a closure of the SoH after 60 days (if talks break down again), then the effect won’t be that impactful in terms of prices and the US midterm elections.
So a gradual and partial reopening where global markets gets the oil they need while they are unable to rebuild stocks could be a practical middle way for both parties. Trump can sell it as ”the SoH has reopened” and get affordable gasoline for US consumers. Iran can sell it as ”the SoH has fully reopened, but there is some friction” so flow is only 60-80% of normal.
Not much real demand destruction below $100/b. What we do know is that there is not much real price pain demand destruction for oil globally at an oil price below $100/b. A lot of demand-shock destruction. Fear. But demand should now come roaring back towards normal with fear for exceptionally high prices now is rapidly receding.
Sudden China demand destruction due to EVs? Bullocks. EV share of total Chinese carpool now around 13%. Share of new sales of EVs has reached 50%. This is a very gradual process. It doesn’t make oil demand fall like a rock over night. When EV new sales share reaches 100%, then the gasoline car pool will contract by some 5-10% per year. But that is only gasoline. Sudden reduction in Chinese oil demand is more about shock and risk.
Chinese crude oil imports will come roaring back. At what price? Today’s ”neutral” oil price is $70/b. That is the five year price which has steadily traded around the $70/b mark over the past 3-4 years. With still a risky picture one would think that China and the rest of the world will be big buyers of oil in the range of $70-85/b.
Global demand will likely snap back towards normal, forecasted demand and growth at such prices.
Physical reopening is a gradual process. The physical and practical reopening of the SoH will likely be gradual rather than sudden. And that probably suites Iran tactically as well.
Brent M1 price versus the Brent 5-yr (today’s ”normal” price)

Market is starting to take US/Iran headlines with a pinch of salt. Brent crude rose $2.8/b yesterday to an official close of $112.1/b. But after that it traded as low as $108.05/b before ending late night at around $109.7/b. Through the day it traded in a range of $106.87 – 112.72/b amid a flurry of news or rumors from Iran and the US. ”US temporary sanctions during negotiations” (falls alarm). ”We will bomb Iran” (not anyhow),… etc. While the market is still fluctuating to this kind of news flow, it is starting to take such headlines with a pinch of salt.
We’ll see. Maybe, maybe not. The Brent M1 contract is trading at $110.2/b this morning which very close to the average ticks through yesterday of $110.4/b.
Trump with bearish, verbal intervention whenever Brent trades above $110/b it seems. What seems to be a pattern is that Trump states something like ”very good negotiations going on with Iran”, ”New leaders in Iran are great,..”, ”Great progress in negotiations,…”, ”Deal in sight,..” etc whenever the Brent M1 contract trades above $110/b. An effort to cool the market. These hot air verbal interventions from Trump used to have a heavy bearish impact on prices, but they now seems to have less and less effect unless they are backed by reality.
As far as we can see there has been no real progress in the negotiations between the US and Iran with both sides still standing by their previous demands.
Iran is getting stronger while the cease fire lasts making a return to war for Trump yet harder. Iran is naturally in constant preparation for a return to war given Trump’s steady threats of bombing Iran again. Iran is naturally doing what ever is possible to prepare for a return to war. And every day the cease fire lasts it is better prepared. This naturally makes it more and more difficult and dangerous for the US to return to warring activity versus Iran as the consequences for energy infrastructure in the Persian Gulf will be more and more severe the longer the cease fire lasts. Israel seems to see it this way as well. That the war is not won and that current frozen state of a cease fire gives Iran opportunity to rebuild military and politically.
Global inventories are drawing down day by day. How much? In the meantime the Strait of Hormuz stays closed. There is varying measures and estimates of how much global inventories are drawing down. Our rough estimate, back of the envelope, is that global inventories are drawing down by at least some 10 mb/d or about 300 mb/d in a balance between loss of supply versus demand destruction. Other estimates we see are a monthly draw of 250-270 mb/d. The IEA only ’measured’ a draw in global observable stocks of 117 mb in April with oil on water rising 53 mb while on shore stocks fell 170 mb. But global stocks are hard to measure with large invisible, unmeasured stocks. As such a back of the envelope approach may be better.
Oil products is what the world is consuming. Oil product prices likely to rise while product stocks fall. Strategic Petroleum Reserves (SPR) are predominantly crude oil. Discharging oil from OECD SPR stocks, a sharp reduction in Chinese crude imports and a reduction in global refinery throughput of 6-7 mb/d has helped to keep crude oil markets satisfactorily supplied. But global inventories are drawing down none the less. And oil products is really what the world is consuming. So if global refinery throughput stays subdued, then demand will eventually have to match the supply of oil products. The likely path forward this summer is a steady draw down in jet fuel, diesel and gasoline. Higher prices for these. Then, if possible, higher refinery throughput and higher usage of crude in response to very profitable refinery margins. And lastly sharper draw in crude stocks and higher prices for these. But some 6 mb/d of oil products used to be exported through the Strait of Hormuz. And it may not be so easy to ramp up refinery activity across the world to compensate. Especially as Ukraine continues to damage Russian refineries as well as Russian crude production and export facilities.
Watch oil product stocks and prices as well as Brent calendar 2027. What to watch for this summer is thus oil product inventories falling and oil product premiums to crude rising. Another measure to watch is the Brent crude 2027 contract as it rises steadily day by day as the Strait of Hormuz stays closed and global oil inventories decline. The latter is close to the highest level since the start of the war and keeps rising.
The Brent M1 contract and the Brent 2027 prices and current price of jet fuel in Europe (ARA). All in USD/b

Our back of the envelope calculation of the global shortage created by the closure of the Strait of Hormuz. Note that 3.5 mb/d of discharge from SPR is also a draw. Note also that ’Forced demand loss’ of 2.5 mb/d is probably temporary and will fall back towards zero as logistics are sorted out leaving ’Price demand loss’ to do the job of balancing the market. Thus a shortfall of at least 9 mb/d created by the closure. More if SPR discharge is included and more if Forced demand loss recedes.

Brent is climbing higher. Front-month is at USD 106.3/bl this morning, close to a weekly high and a USD 9/bl jump from Mondays open. This is the move we flagged as a risk earlier in the week: the market shifting from ”a deal is around the corner” to ”this is going to take longer than we thought”.

Analyst Commodities, SEB
During April, rest-of-year Brent remained remarkably stable around USD 90/bl. A stability which rested on one single assumption: the SoH reopens around 1 May. That assumption is now slowly falling apart.
As we highlighted yesterday: every week of delay beyond 1 May adds (theoretically) ish USD 5/bl to the rest-of-year average, as global inventories draw 100 million barrels per week. i.e., a mid-May reopening implies rest-of-year Brent closer to USD 100/bl, and anything pushing into June or July takes us meaningfully higher.
What’s changed in the last 48 hours:
#1: The US military has formally warned that clearing suspected sea mines from SoH could take up to six months. That is a completely different timescale from what the financial market is pricing. Even a political deal tomorrow does not immediately reopen the strait.
#2: Trump has shifted his tone from urgency to ”strategic patience”. In yesterday’s press conference: ”Don’t rush me… I want a great deal.” The market is reading this as a president no longer feeling pressured by timelines, with the naval blockade running in the background.
#3: So far, the military activity is escalating, not de-escalating. Axios reports Iran is laying more mines in SoH. The US 3rd carrier strike group (USS George H.W. Bush) is arriving with two countermine vessels. Trump yesterday ordered the US Navy to destroy any Iranian boats caught laying mines. While CNN reports that the Pentagon is actively drawing up plans to strike Iranian SoH capabilities and individual Iranian military leaders if the ceasefire collapses. i.e., NOT a attitude consistent with an imminent deal!
Spot crude and product prices eased off the early-April highs on a combination of system rerouting and deal optimism. Both now weakening. Goldman estimates April Gulf output is reduced by 14.5 mbl/d, or 57% of pre-war supply, a number that keeps getting worse the longer this drags on.
Demand-side adaptation is ongoing: S. Korea has cut its Middle East crude dependence from 69% to 56% by pulling more from the Americas and Africa, and Japan is kicking off a second round of SPR releases from 1 May. But SPRs are finite.
Ref. to the negotiations, we should not bet on speed. The current Iranian leadership is dominated by genuine hardliners willing to absorb economic pain and run the clock to extract concessions. That is not a setup for a rapid resolution. US/Israeli media briefings keep framing the delay as ”internal Iranian divisions”, the reality is more complicated and points toward weeks and months, not days.
Our point is that the complexity is large, and higher prices have only just started (given a scenario where the negotiations drag out in time). The market spent April leaning on the USD 90/bl rest-of-year assumption; that case is diminishing by the hour. If ”early May reopening” is replaced by ”June, July or later” over the next week or two, both crude and products have meaningful room to reprice higher from here. There is a high risk being short energy and betting on any immediate political resolution(!).


Vattenfalls och Industrikrafts kärnkraftsbolag Videberg Kraft har valt Rolls-Royce SMR
Selling down on a ”deal”

Sommarväder skapar prisrally på elbörsen
Oil product price pain is set to rise as the Strait of Hormuz stays closed into summer

