

Analys
SEB Jordbruksprodukter, 11 mars 2013

 WASDE-rapporten i fredags ledde inte till några stora kursrörelser. Gammal skörd av vete handlas nu under majsen.
Odlingsväder
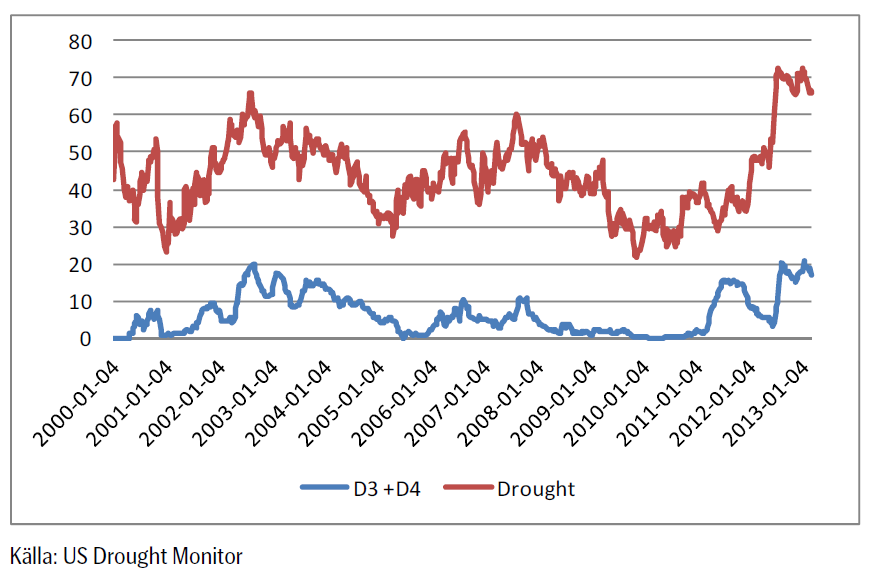
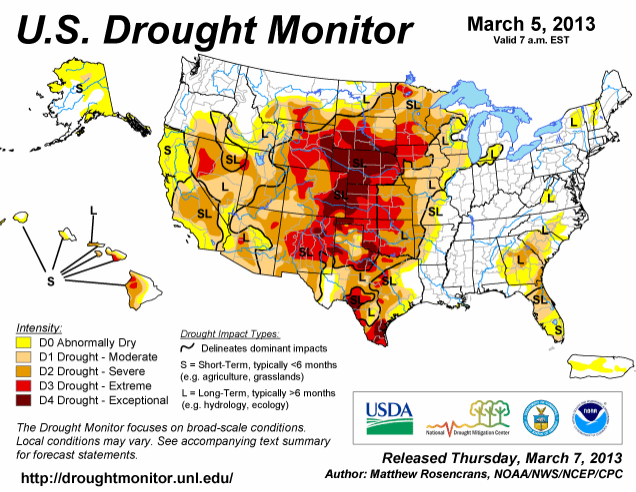
Trots att den allmänna uppfattningen är att torkan har avtagit i USA – det har ju regnat i Kansas – var torkan faktiskt något värre den senaste veckan, enligt US Drought Monitor. Ibland sägs det skämtsamt att nederbörden på La Salle Street är helt avgörande. Chicagobörsen ligger där.
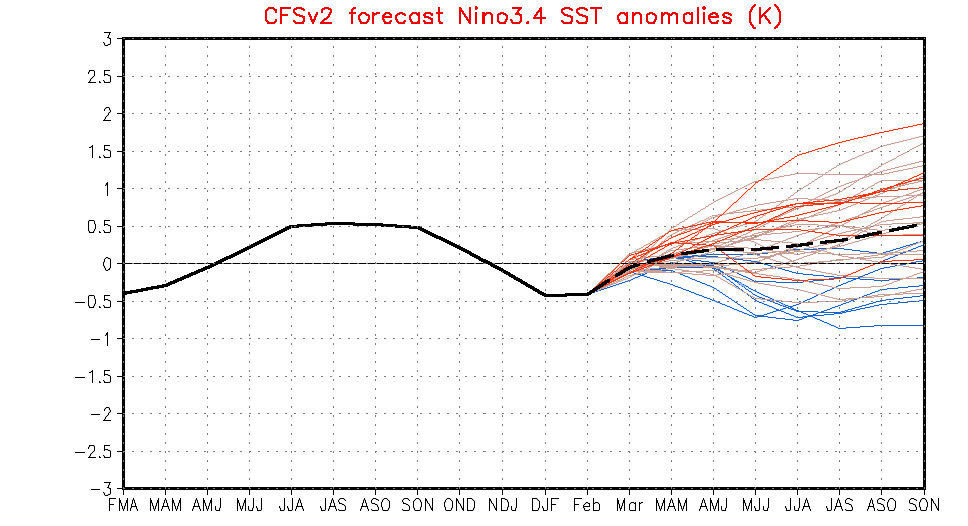
Ensembleprognosen för ENSO (El Niño / La Niña) väntas vara neutral under hela odlingssäsongen på norra halvklotet, enligt NOAA:s klimatmodell.
Vete
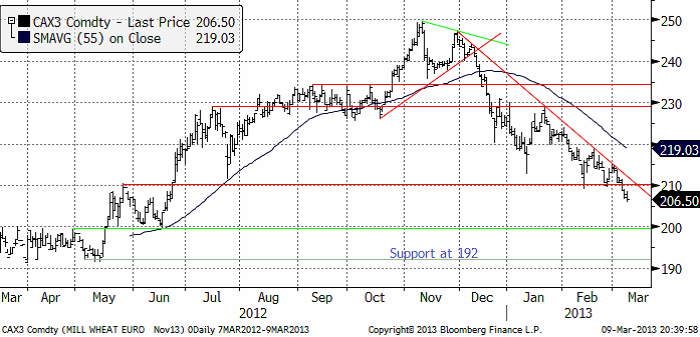
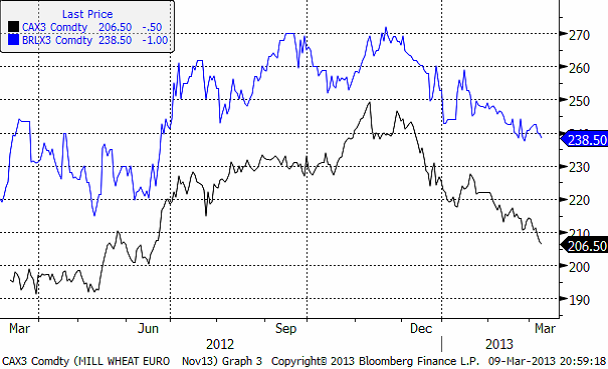
Priset på november (2013) kontraktet slutade 1% lägre än förra veckan, efter att ha börjat med ett kraftigt prisfall ner till 210 euro innan rekylen uppåt kom. 210 euro är ett tekniskt stöd. Bryts detta på uppsidan i veckan som kommer, är prisfallet från början av december troligen hejdat för ett tag framöver. Men det mest sannolika är att priset vänder ner igen för ett nytt test av 210-nivån.
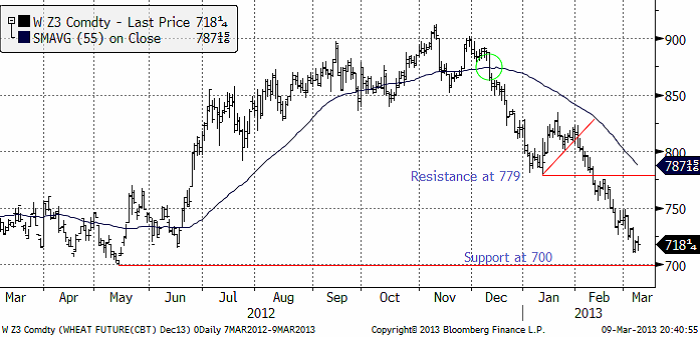
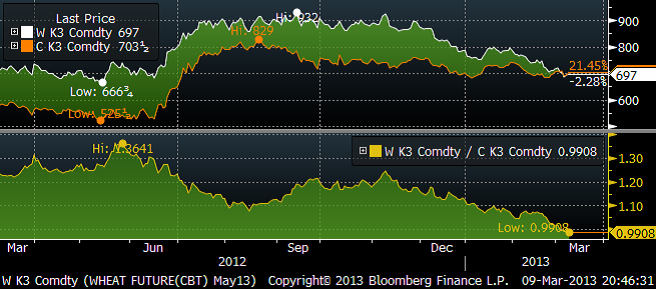
Nedan ser vi decemberkontraktet på CBOT, som inte lyckades rekylera upp lika mycket som Matif, efter att ha inlett veckan med prisfall. Det finns en gammal stödnivå på 755, som även fungerade i veckan som gick. Det finns också ett motstånd på 779 cent. Däremellan ligger nu marknaden. Frågan är vilket av stödet eller motståndet som ska brytas. Vi skulle gissa att stödet bryts, baserat på hur kursutvecklingen brukar bli när det är så här. Det finns i så fall potential för priset att falla ner mot 700 cent, eller strax däröver, det vill säga in i det prisintervall som vetet handlade i under förra våren.
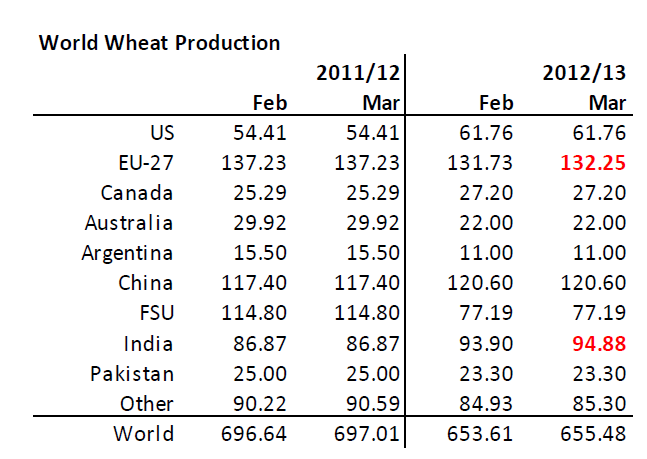
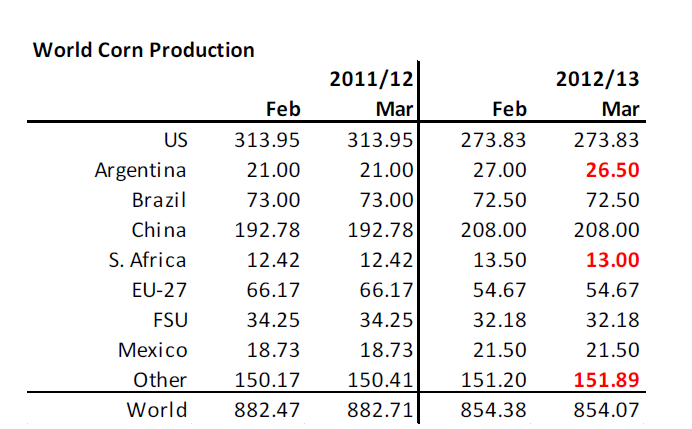
I fredags kväll publicerade det amerikanska jordbruksdepartementet USDA sin månatliga WASDE-rapport. Produktionen i år väntas nu bli 1.9 mt högre än tidigare. Uppjusteringarna gjordes för EU-27 (i Litauen med 500,000 ton) och i Indien. Indien har haft bra väder efter sommarens dåliga monsun. USDA borde kanske ha passat på att sänka Argentinas skörd med 1 mt, men gjorde det inte. Praktiskt taget ingen tror längre att skörden blir 11 mt i Argentina.
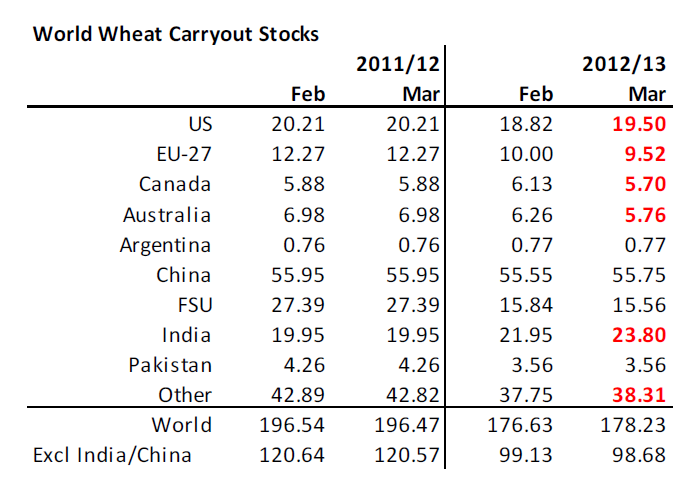
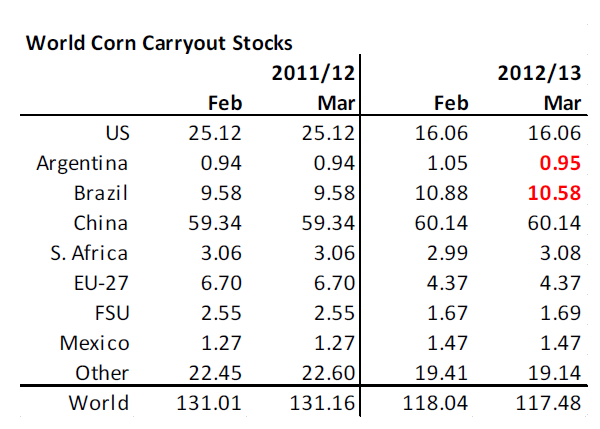
Nedan ser vi utgående lager. Högre utgående lager på global basis, framförallt i Indien, som man inte räknar med ska exportera det extra väntade tillskottet. Eftersom Indien och Kina är länder som har förhållandevis stora lager och som gärna av matsäkerhetsskäl håller stora lager, är det intressant att studera globala lager UTAN dessa länder. Då ser vi faktiskt att USDA räknar med LÄGRE lager, inte högre. Detta på grund av lägre lager i EU-27 (när man inte trodde det var möjligt), i Kanada och i Australien.
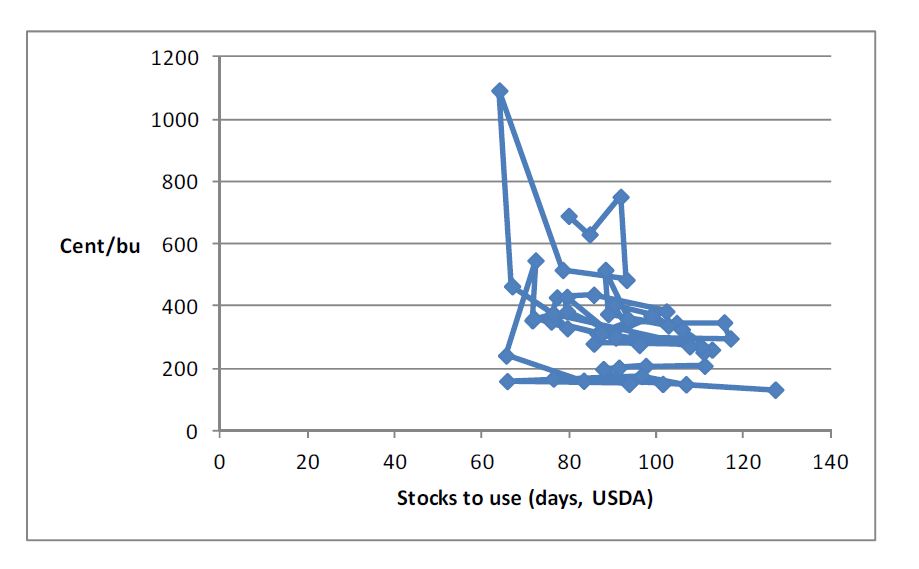
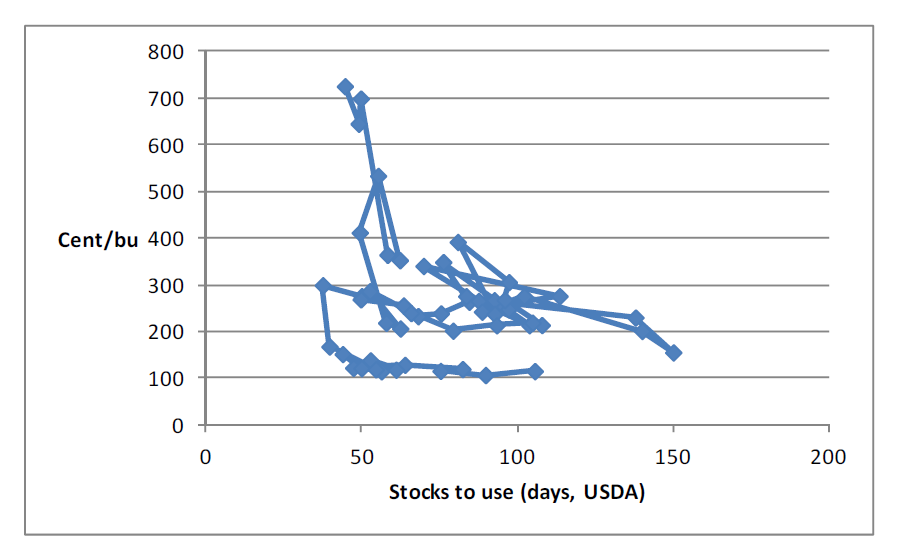
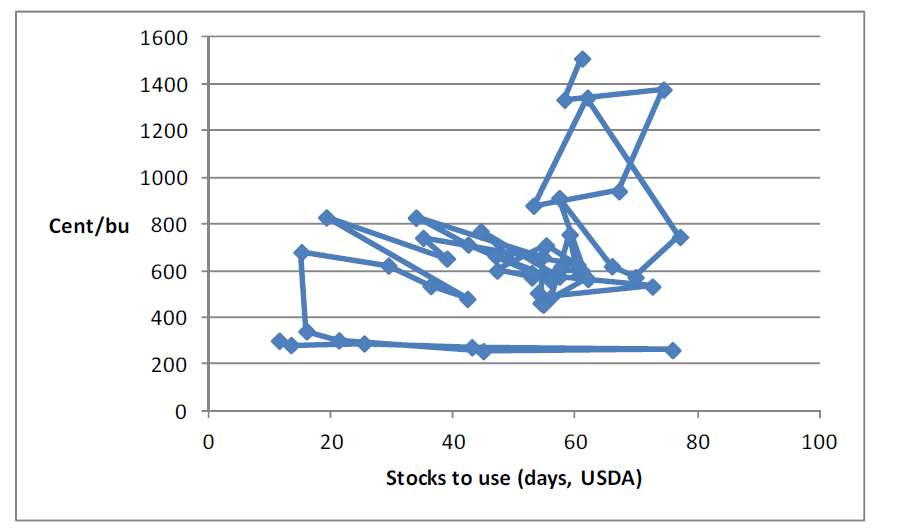
Marknaden tog rapporten, som det varit så mycket spanning inför, med en lättnadens suck. Det var inga stora förändringar. Priset föll något lite på rapporten. Nedan ser vi förhållandet mellan pris och lager sedan 1960; varje punkt är ett rapporttillfälle i mars, för varje år sedan dess. Fredagens rapport är den sista punkten, vid ca 700 cent. Vi ser att priset i förhållande till lager inte avviker från förhållandet de senaste åren. Vi måste dra slutsatsen att priset är rätt idag. Om något skulle priset faktiskt kunna vara lite högre, i synnerhet om vi betänker att Argentinas skörd inte kommer att bli 11 mt, i alla fall enligt argentinarna själva.
Ser vi till terminskurvorna för Matif och Chicago, ser vi att priserna har fallit över hela linjen.
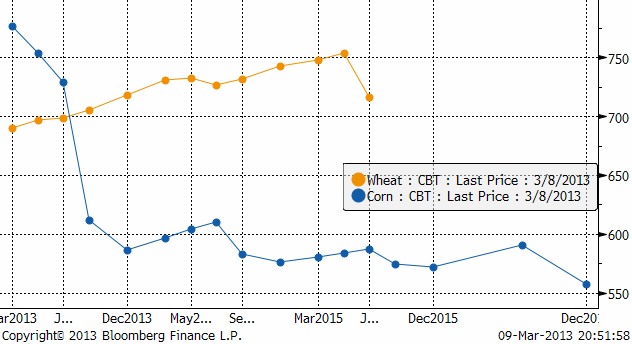
Märkligt nog har vetepriset (för gammal skörd, maj, t ex) fallit så mycket att det blivit billigare än majs. Vi ser det i diagrammet nedan.
Det finns rapporter från USA att majs ersätts med vete i såväl två etanolfabriker som allmänt i foderblandningar. Detta gör att USDA:s foderefterfrågan i WASDE-rapporten kan vara helt underskattad. Nedan ser vi terminskurvorna för vete och majs. Notera att priserna för majs är omräknade från cent / 56 pund till cent / 60 bushels. När man handlar majsterminer på börsen handlar man dem i cent per bushel och en majs-bushel är 56 pund, medan en bushel vete är 60 pund. Maj-leverans för majs ligger alltså på 754 och vete på 697. Det är en jättestor skillnad när man dessutom betänker att vete innehåller betydligt mer värdefullt protein än majs.
I Brasilien har sådden av den andra skörden påbörjats nu. De senaste åren har sådden börjat i mars. Eftersom det har regnat en hel del, går sådden långsamt. Detta gynnar veteodlingen eftersom den kan sås senare än majs. I Paraná, som är tidigt ute, är 51% av arealen sådd. Där är 6% sådd med vete, hittills, men man kan förvänta sig att den andelen ökar med tiden.
Crop ratings i USA är fortsatt riktigt dåliga och man väntar sig en stor skörd av majs som ska reparera all brist i lagren. Vi tror att priset på vete ur fundamentalt perspektiv kan ha fallit för mycket de senaste månaderna och att priset borde vara högre, inte lägre. Momentum i marknaden är nedåtriktat, så prisfallet måste stanna av först. Sedan är det möjligt att en rekyl uppåt kan komma till stånd.
Maltkorn
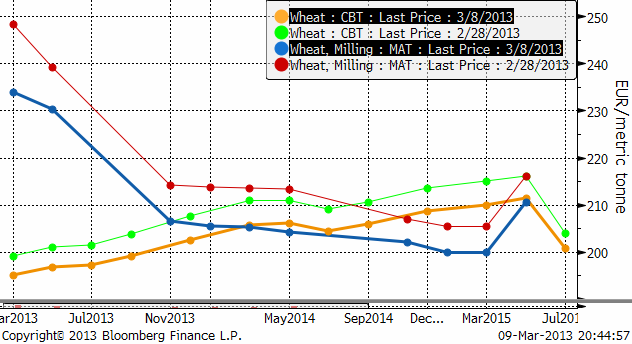
Priset på maltkorn med leverans i november har fallit i synk med prisfallet på kvarnvete, som vi ser i nedanstående diagram. Eftersom prisrörelserna är så synkroniserade är det många som prissäkrar via den mycket likvidare terminsmarknaden på kvarnvete än den tämligen illikvida och därmed riskablare marknaden för maltkorn.
Majs
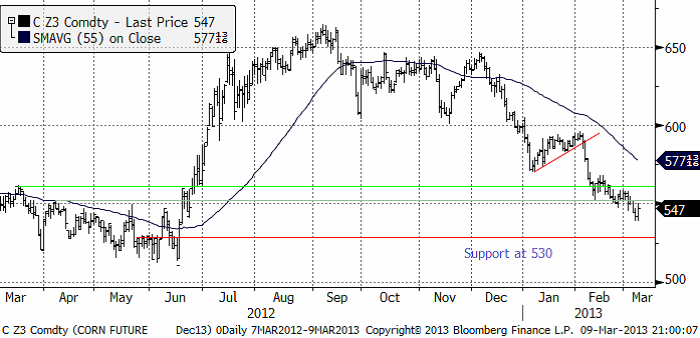
Majspriset (december 2013) har sjunkit betydligt försiktigare än vetet. I förra veckobrevet, som kom för ungefär en månad sedan, skrev vi att vi trodde att priset skulle gå ner till ca 530 cent. Marknaden har ännu inte nått dit. Det tolkar vi som ett styrketecken. WASDE-rapporten något lägre produktion, främst i Argentina och Sydafrika. Argentinas skörd ligger fortfarande över vad konsensus är bland andra. Brasiliens skörd ligger å andra sidan på 72.5 mt. Conab i Brasilien estimerar 76 mt.
Nedan ser vi estimatet för utgående lager. Det är något lägre lager, framförallt i Brasilien (och där kan USDA ha fel med flera miljoner ton om Conab har rätt).
Pris i förhållande till lager är naturligtvis ”off the charts”, fast egentligen inte. Globala lager är så ansträngda att priset har potential att röra sig kraftigt såväl uppåt som nedåt. Som vi noterat ligger priset på majs för gammal skörd över priset för gammal skörd av vete. Efter skörd ska naturligtvis världens största rekordskörd tröskas i USA och därför är priserna mycket lägre.
Priserna i Sydamerika har hållit sig stabila. I Paraná hade 19% blivit skördat den 25 februari. För den andra skörden hade 51% blivit sått. I Rio Grande do Sul hade 45% av skörden blivit tröskad per den 28 februari enligt Emater, jordbruksbyrån i delstaten. Det är lite tidigare än förra årets 41%.
I Argentina har Bolsa de Rosario justerat ner skördeprognosen till 25.5 mt, vilket överensstämmer med Bolsa de Cereales, som tidigare förutspått 25 mt.
Nedan ser vi terminspriset (december). Vi ser att priset fallit ner till en nivå där det finns gott om tekniskt stöd. Vi tror att prisfallet är över och att priserna rör sig sidledes. Vädret i USA kommer att styra under våren.
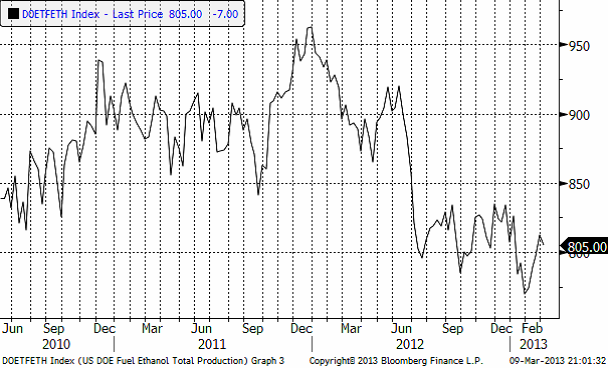
Veckovis etanolproduktion i USA ligger på samma nivå som efter sommaren, väl över de lägsta nivåerna under säsongen.
Vi har en neutral vy på majspriset och tror på sidledes rörelse när prisfallet nu torde ebba ut.
Sojabönor
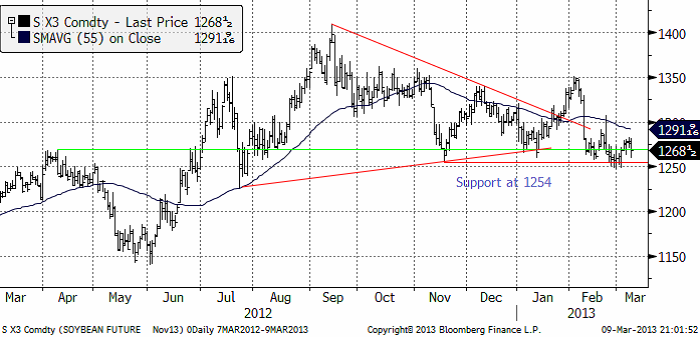
Sojabönorna (november 2013) har hållit stödet på 1254 cent per bushel. Den senaste tekniska signalen är dock faktiskt en säljsignal. Enligt den tekniska analysen borde vi få se en prisnedgång.
Den senaste veckan har styrkan i marknaden förklarats med fördröjning av lastningen av sojabönor i Brasilianska hamnar. Ny arbetslagstiftning i Brasilien som reglerar arbetstider och förhållanden för transport- och hamnarbetare har gjort att transportkostnaderna har ökat och lastningen gått långsammare. Vi har sett att det blivit en kö av fartyg utanför hamnarna som väntar på lastning. Detta har gjort att priset inne i landet har sjunkit eftersom priset där är exportpriset minus transportkostnad med följden att lantbrukarna väntar med att sälja sin vara. Hittills har ca 60% av sojaskörden sålts enligt CEPEA.
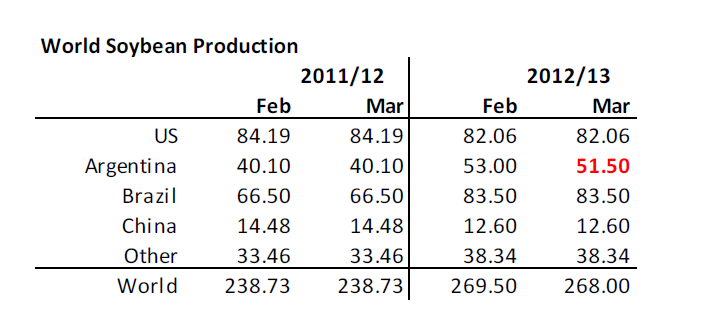
WASDE-rapporten visade på lägre global produktion, helt beroende på en nedjustering av Argentinas väntade skörd.
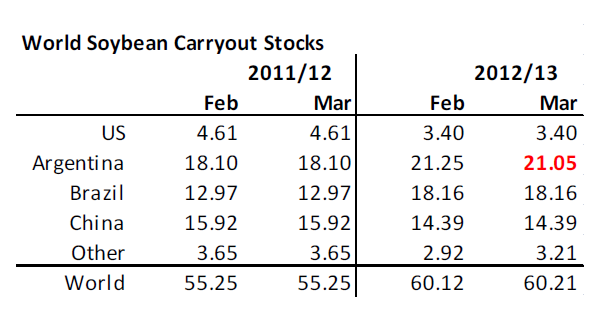
För att inte skicka “fel” signaler till marknaden, eller av någon annan anledning, justerade USDA också efterfrågan, i USA. Utgående lager är alltså oförändrade, som vi ser i nedanstående tabell.
Nedan ser vi relationen mellan pris och utgående lager. Vi ser att priset om något ser ut att ligga högt.
I veckan som kommer får man hålla koll på om priset håller sig över det tekniska stödet vid 1254 eller om det bryts. Om det bryts vill vi vara korta sojabönor.
Raps
Rapspriset (november 2013) har fortsätt att röra sig ”sidledes”, såsom det gjort de tre senaste månaderna. Efter WASDE-rapporten och prisnedgången på sojabönor handlades även rapspriset ner.
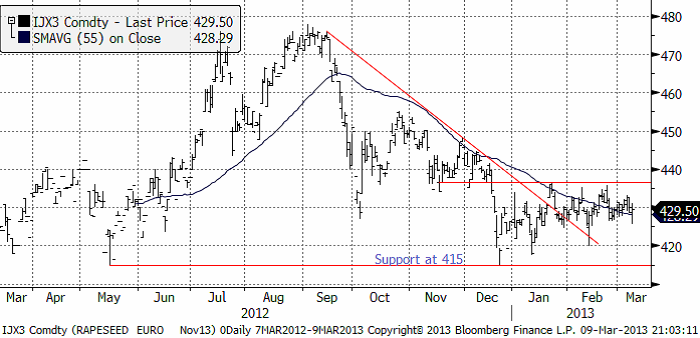
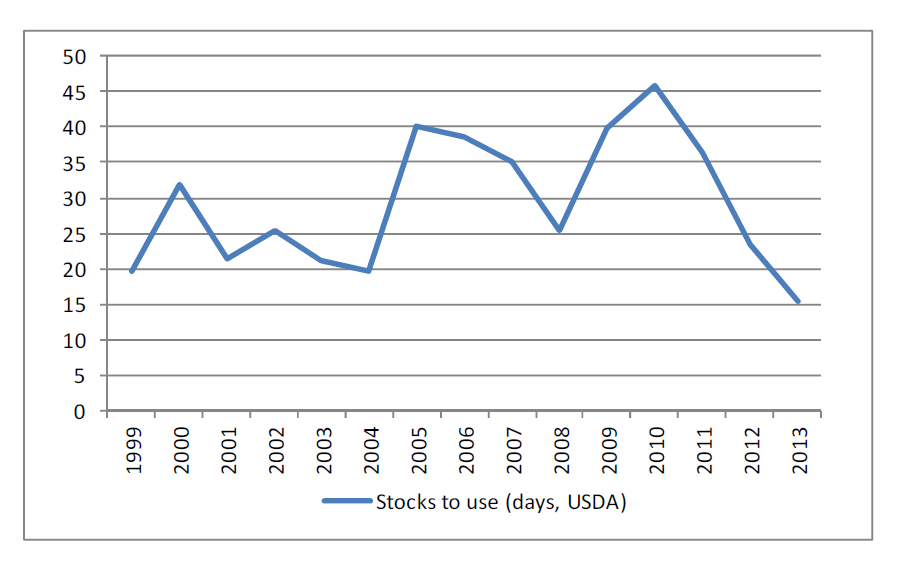
Rapsmarknaden har mindre utgående lager än sojabönorna. WASDE-rapporten anger utgående lager till motsvarande 15 dagars konsumtion. Det ska jämföras med förra årets 23 dagar. Som vi ser i diagrammet nedan väntar sig USDA mycket låga lager av rapsfrö som utgående lager nästa år i slutet av juni.
I förhållande till pris är relationen helt ur led, som vi ser i diagrammet nedan. Med så låga lager som USDA prognosticerar ligger priset för lågt. Det ”borde” ligga norr om 600 euro per ton.
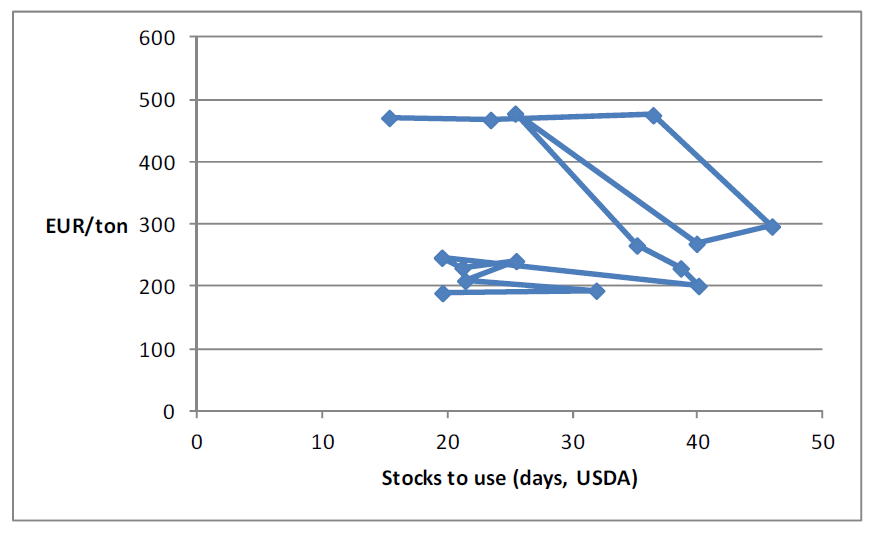
Vi har haft en negativ vy på raps, men väljer nu att gå över till neutral rekommendation.
Gris
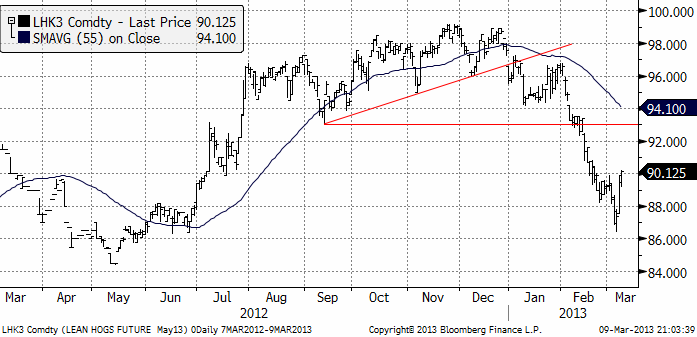
Grispriset (Maj 13) rekylerade upp kraftigt på rapporter om låga lager. Vi ser rekylen uppåt än så länge som en rekyl och inte som början på en trend uppåt.
Mjölk
Intresset för prissäkring av mjölk via terminer på mjölkprodukter är stort i Sverige. Ingen har än så länge gjort någon affär, men med tanke på hur fulla seminarierna är, är det sannolikt bara en tidsfråga innan den första anser sig förstå hur terminer fungerar och vilken nytta prissäkring kan ha för att hantera risk och för att tjäna pengar och den första affären görs.
SEB Commodities erbjuder ett litet ”prova-på” kontrakt som består av 0.5 ton Eurex-smör och 0.9 ton Eurex SMP. Ett paket som motsvarar 10 ton flytande mjölkråvara. Just nu är det underliggande värdet på ett sådant kontrakt drygt 33 000 kronor.
I kursdiagrammet nedan ser vi fyra kurvor, som förra veckan. Överst har vi smör i euro per ton, alla är i euro per ton. Den tunna röda linjen USDA:s notering för SMP i västra Europa. Den feta blå linjen är terminspriset på SMP på Eurex, som avser snittpriset på SMP i Tyskland, Holland och Frankrike. Den gröna linjen är Fonterras auktionspris på SMP.
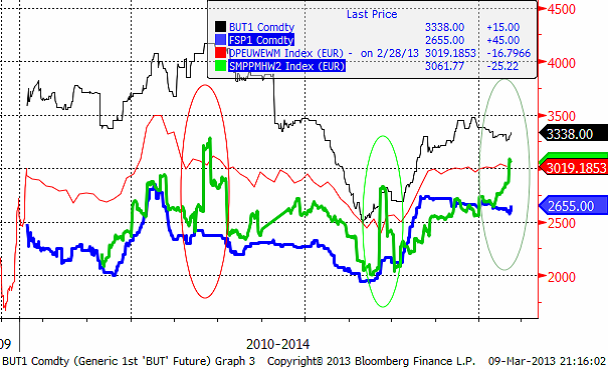
Det har uppmärksammats i mjölkbranschen i Sverige att Fonterra-priset har stigit kraftigt den senaste månaden. Den gröna kurvan pekar rakt uppåt. Vi ser dock inte alls någon sympati för denna hausse i de andra noteringarna. Jag misstror prisuppgången på Fonterra och tror inte att uppgången nu innehåller någon information alls om hur priset kommer att gå på andra mjölkmarknader. Det gör jag därför att vi har sett exakt samma avvikande beteende hos Fonterra-priset tidigare. I diagrammet ovan har jag ringat in de tre kursrusningar vi sett i Fonterrapriset och vi ser att det är Fonterrapriset som omotiverat stiger och därför faller tillbaka lika plötsligt som uppgången kom.
Jag vill hävda att den bästa indikatorn på rätt pris är Eurex-börsen. Den har dessutom den fördelen att vem som helst när som helst kan surfa in på Eurex och se vad priset är just vid det tillfället. Via länken kan man t ex se vad aktuellt pris är för terminer på SMP:
www.eurexchange.com/exchange-en/products/com/agr/14016/
På andra sidan Atlanten fortsätter mjölkpriset att falla, som vi ser nedan. Prisuppgången i mars månad kommer säkerligen att följas av prisfall. Det ser ut som om nedgången började i fredags och kommer att fortsätta i resten av veckan.
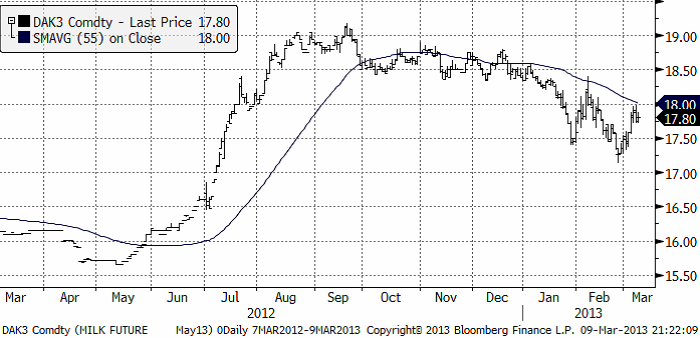
Vi har en klar säljrekommendation på mjölkterminer.
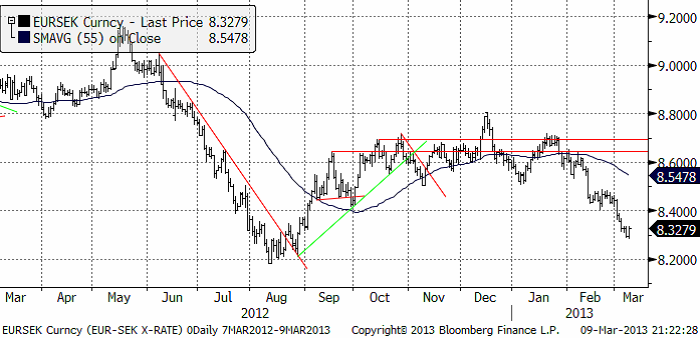
EURSEK
EURSEK faller. Eurokrisen har fått ny eld. 8.20 kr är nästa stöd.
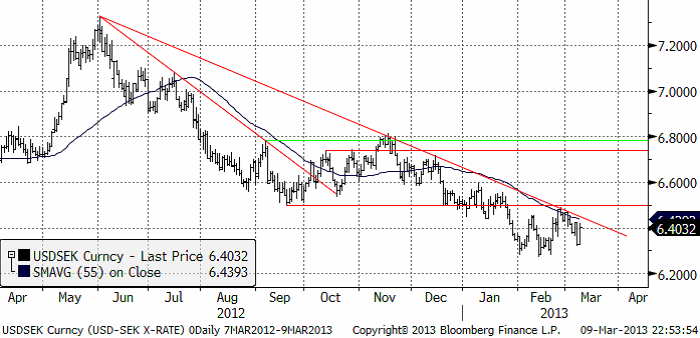
USDSEK
Dollarn håller sig stadigt under motståndslinjen i fallande trenden. Senast var priset uppe vid den och misslyckades med att bryta igenom, vilket brukar följas av nya kursfall.
[box]SEB Veckobrev Jordbruksprodukter är producerat av SEB Merchant Banking och publiceras i samarbete och med tillstånd på Råvarumarknaden.se[/box]
Disclaimer
The information in this document has been compiled by SEB Merchant Banking, a division within Skandinaviska Enskilda Banken AB (publ) (“SEB”).
Opinions contained in this report represent the bank’s present opinion only and are subject to change without notice. All information contained in this report has been compiled in good faith from sources believed to be reliable. However, no representation or warranty, expressed or implied, is made with respect to the completeness or accuracy of its contents and the information is not to be relied upon as authoritative. Anyone considering taking actions based upon the content of this document is urged to base his or her investment decisions upon such investigations as he or she deems necessary. This document is being provided as information only, and no specific actions are being solicited as a result of it; to the extent permitted by law, no liability whatsoever is accepted for any direct or consequential loss arising from use of this document or its contents.
About SEB
SEB is a public company incorporated in Stockholm, Sweden, with limited liability. It is a participant at major Nordic and other European Regulated Markets and Multilateral Trading Facilities (as well as some non-European equivalent markets) for trading in financial instruments, such as markets operated by NASDAQ OMX, NYSE Euronext, London Stock Exchange, Deutsche Börse, Swiss Exchanges, Turquoise and Chi-X. SEB is authorized and regulated by Finansinspektionen in Sweden; it is authorized and subject to limited regulation by the Financial Services Authority for the conduct of designated investment business in the UK, and is subject to the provisions of relevant regulators in all other jurisdictions where SEB conducts operations. SEB Merchant Banking. All rights reserved.

The latest weekly report from the US DOE showed a substantial drawdown across key petroleum categories, adding more upside potential to the fundamental picture.

Commercial crude inventories (excl. SPR) fell by 5.8 million barrels, bringing total inventories down to 415.1 million barrels. Now sitting 11% below the five-year seasonal norm and placed in the lowest 2015-2022 range (see picture below).
Product inventories also tightened further last week. Gasoline inventories declined by 2.1 million barrels, with reductions seen in both finished gasoline and blending components. Current gasoline levels are about 3% below the five-year average for this time of year.
Among products, the most notable move came in diesel, where inventories dropped by almost 4.1 million barrels, deepening the deficit to around 20% below seasonal norms – continuing to underscore the persistent supply tightness in diesel markets.
The only area of inventory growth was in propane/propylene, which posted a significant 5.1-million-barrel build and now stands 9% above the five-year average.
Total commercial petroleum inventories (crude plus refined products) declined by 4.2 million barrels on the week, reinforcing the overall tightening of US crude and products.


A classic case of “buy the rumor, sell the news” played out in oil markets, as Brent crude has dropped sharply – down nearly USD 10 per barrel since yesterday evening – following Iran’s retaliatory strike on a U.S. air base in Qatar. The immediate reaction was: “That was it?” The strike followed a carefully calibrated, non-escalatory playbook, avoiding direct threats to energy infrastructure or disruption of shipping through the Strait of Hormuz – thus calming worst-case fears.
After Monday morning’s sharp spike to USD 81.4 per barrel, triggered by the U.S. bombing of Iranian nuclear facilities, oil prices drifted sideways in anticipation of a potential Iranian response. That response came with advance warning and caused limited physical damage. Early this morning, both the U.S. President and Iranian state media announced a ceasefire, effectively placing a lid on the immediate conflict risk – at least for now.
As a result, Brent crude has now fallen by a total of USD 12 from Monday’s peak, currently trading around USD 69 per barrel.
Looking beyond geopolitics, the market will now shift its focus to the upcoming OPEC+ meeting in early July. Saudi Arabia’s decision to increase output earlier this year – despite falling prices – has drawn renewed attention considering recent developments. Some suggest this was a response to U.S. pressure to offset potential Iranian supply losses.
However, consensus is that the move was driven more by internal OPEC+ dynamics. After years of curbing production to support prices, Riyadh had grown frustrated with quota-busting by several members (notably Kazakhstan). With Saudi Arabia cutting up to 2 million barrels per day – roughly 2% of global supply – returns were diminishing, and the risk of losing market share was rising. The production increase is widely seen as an effort to reassert leadership and restore discipline within the group.
That said, the FT recently stated that, the Saudis remain wary of past missteps. In 2018, Riyadh ramped up output at Trump’s request ahead of Iran sanctions, only to see prices collapse when the U.S. granted broad waivers – triggering oversupply. Officials have reportedly made it clear they don’t intend to repeat that mistake.
The recent visit by President Trump to Saudi Arabia, which included agreements on AI, defense, and nuclear cooperation, suggests a broader strategic alignment. This has fueled speculation about a quiet “pump-for-politics” deal behind recent production moves.
Looking ahead, oil prices have now retraced the entire rally sparked by the June 13 Israel–Iran escalation. This retreat provides more political and policy space for both the U.S. and Saudi Arabia. Specifically, it makes it easier for Riyadh to scale back its three recent production hikes of 411,000 barrels each, potentially returning to more moderate increases of 137,000 barrels for August and September.
In short: with no major loss of Iranian supply to the market, OPEC+ – led by Saudi Arabia – no longer needs to compensate for a disruption that hasn’t materialized, especially not to please the U.S. at the cost of its own market strategy. As the Saudis themselves have signaled, they are unlikely to repeat previous mistakes.
Conclusion: With Brent now in the high USD 60s, buying oil looks fundamentally justified. The geopolitical premium has deflated, but tensions between Israel and Iran remain unresolved – and the risk of missteps and renewed escalation still lingers. In fact, even this morning, reports have emerged of renewed missile fire despite the declared “truce.” The path forward may be calmer – but it is far from stable.
Analys
A muted price reaction. Market looks relaxed, but it is still on edge waiting for what Iran will do
Brent crossed the 80-line this morning but quickly fell back assigning limited probability for Iran choosing to close the Strait of Hormuz. Brent traded in a range of USD 70.56 – 79.04/b last week as the market fluctuated between ”Iran wants a deal” and ”US is about to attack Iran”. At the end of the week though, Donald Trump managed to convince markets (and probably also Iran) that he would make a decision within two weeks. I.e. no imminent attack. Previously when when he has talked about ”making a decision within two weeks” he has often ended up doing nothing in the end. The oil market relaxed as a result and the week ended at USD 77.01/b which is just USD 6/b above the year to date average of USD 71/b.

Brent jumped to USD 81.4/b this morning, the highest since mid-January, but then quickly fell back to a current price of USD 78.2/b which is only up 1.5% versus the close on Friday. As such the market is pricing a fairly low probability that Iran will actually close the Strait of Hormuz. Probably because it will hurt Iranian oil exports as well as the global oil market.
It was however all smoke and mirrors. Deception. The US attacked Iran on Saturday. The attack involved 125 warplanes, submarines and surface warships and 14 bunker buster bombs were dropped on Iranian nuclear sites including Fordow, Natanz and Isfahan. In response the Iranian Parliament voted in support of closing the Strait of Hormuz where some 17 mb of crude and products is transported to the global market every day plus significant volumes of LNG. This is however merely an advise to the Supreme leader Ayatollah Ali Khamenei and the Supreme National Security Council which sits with the final and actual decision.
No supply of oil is lost yet. It is about the risk of Iran closing the Strait of Hormuz or not. So far not a single drop of oil supply has been lost to the global market. The price at the moment is all about the assessed risk of loss of supply. Will Iran choose to choke of the Strait of Hormuz or not? That is the big question. It would be painful for US consumers, for Donald Trump’s voter base, for the global economy but also for Iran and its population which relies on oil exports and income from selling oil out of that Strait as well. As such it is not a no-brainer choice for Iran to close the Strait for oil exports. And looking at the il price this morning it is clear that the oil market doesn’t assign a very high probability of it happening. It is however probably well within the capability of Iran to close the Strait off with rockets, mines, air-drones and possibly sea-drones. Just look at how Ukraine has been able to control and damage the Russian Black Sea fleet.
What to do about the highly enriched uranium which has gone missing? While the US and Israel can celebrate their destruction of Iranian nuclear facilities they are also scratching their heads over what to do with the lost Iranian nuclear material. Iran had 408 kg of highly enriched uranium (IAEA). Almost weapons grade. Enough for some 10 nuclear warheads. It seems to have been transported out of Fordow before the attack this weekend.
The market is still on edge. USD 80-something/b seems sensible while we wait. The oil market reaction to this weekend’s events is very muted so far. The market is still on edge awaiting what Iran will do. Because Iran will do something. But what and when? An oil price of 80-something seems like a sensible level until something do happen.


Eurobattery Minerals förvärvar majoritet i spansk volframgruva

USA ska införa 50 procent tull på koppar

Ryska staten siktar på att konfiskera en av landets största guldproducenter

Hur säkrar vi Sveriges tillgång till kritiska metaller och mineral i en ny geopolitisk verklighet?

Lundin Mining ska bli en av de tio största kopparproducenterna i världen

Mahvie Minerals växlar spår – satsar fullt ut på guld

Uppgången i oljepriset planade ut under helgen

Låga elpriser i sommar – men mellersta Sverige får en ökning

Jonas Lindvall är tillbaka med ett nytt oljebolag, Perthro, som ska börsnoteras
A muted price reaction. Market looks relaxed, but it is still on edge waiting for what Iran will do
-
 Nyheter3 veckor sedan
Mahvie Minerals växlar spår – satsar fullt ut på guld
-
 Nyheter4 veckor sedan
Uppgången i oljepriset planade ut under helgen
-
 Nyheter4 veckor sedan
Låga elpriser i sommar – men mellersta Sverige får en ökning
-
Analys3 veckor sedan
A muted price reaction. Market looks relaxed, but it is still on edge waiting for what Iran will do
-
 Nyheter3 veckor sedan
Jonas Lindvall är tillbaka med ett nytt oljebolag, Perthro, som ska börsnoteras
-

 Nyheter3 veckor sedan
Oljan, guldet och marknadens oroande tystnad
-
Analys4 veckor sedan
Very relaxed at USD 75/b. Risk barometer will likely fluctuate to higher levels with Brent into the 80ies or higher coming 2-3 weeks
-

 Nyheter3 veckor sedan
Domstolen ger klartecken till Lappland Guldprospektering