

Analys
SEB Jordbruksprodukter, 11 februari 2013

 WASDE-rapporten innehöll endast små förändringar och de förändringar som USDA gjorde var i linje med vad vi och marknaden väntat oss att de skulle göra. För vete- och majsmarknaden hände ingenting. Däremot föll priset på sojabönor ganska mycket, mer än vad som motiverades av siffrorna från USDA.
Däremot visade siffrorna att det inte var så illa som några befarat. I förhållande till de senaste årens relation mellan pris och väntat utgående lager ligger priserna på vete, majs och sojabönor i linje med vad som varit ”rätt” pris.
 Vad gäller gammal skörd av vete förbereder sig såväl Egypten som Ryssland att försöka komma över så stor del av kakan av det lilla lager som finns i världen som möjligt. Mer om det nedan.
Vete
I onsdags beslöt Ryssland att ta bort importtullen om 5% på spannmål, som vi förutspådde i förra veckans veckobrev. Pådrivande kan ha varit att GASC i helgen för en vecka sedan köpte ytterligare vete, efter att just ha genomfört sin normala tender för månaden tidigare i veckan. Förra veckan skrev vi att Ryssland torde ha slut på vete mot slutet av april. Samtidigt behöver Egypten, och säkert flera andra, också köpa vete senare i vår – till rimliga priser. Det har därför varit en balansgång mellan att gå ut och köpa aggressivt till dagens höga priser å ena sidan – och att avvakta och kanske kunna få tag på vete billigare längre fram under våren. Terminskurvan indikerar lägre priser i vår – åtminstone på europeiskt vete. Eftersom lagerstatistiken och matbehovet ser ut som det gör, gissar vi på att pulsen hos marknadsaktörerna kommer att stiga ännu mer under våren.
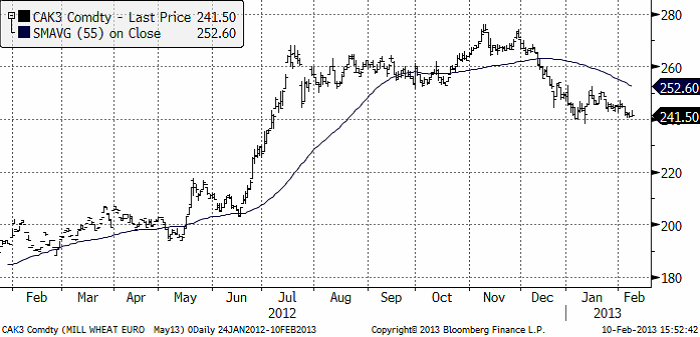
För den som sitter på vete av gammal skörd att sälja finns all anledning att följa med. Terminspriserna visar att priset kommer att falla ordentligt när den nya skörden kommer in och avhjälper bristen. Frågan är om det går att få mer betalt för gammal skörd än dagens pris. Vi tror möjligen det. Nedan ser vi kursdiagrammet på Matif för leverans i maj:
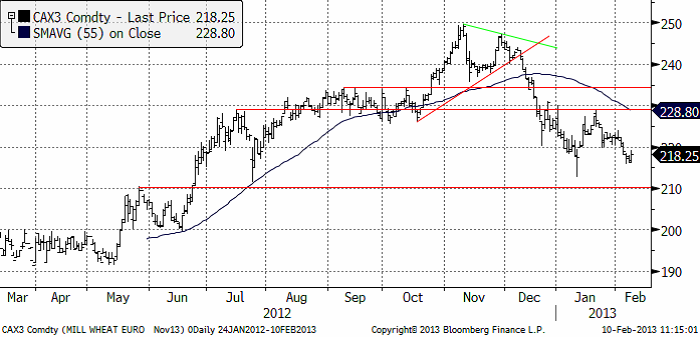
Priset på november (2013) kontraktet har den senaste tiden fallit betydligt mer än maj-kontraktet, som vi ser i diagrammet nedan. WASDE-rapporten som kom i fredags kväll, var något av en ickehändelse. WASDE-rapporten har mer bäring på novemberkontraktet än på maj-kontraktet. De något mer bullish / oroväckande nyheterna från Ryssland och Egypten påverkar inte novemberkontraktet lika mycket som majkontraktet.
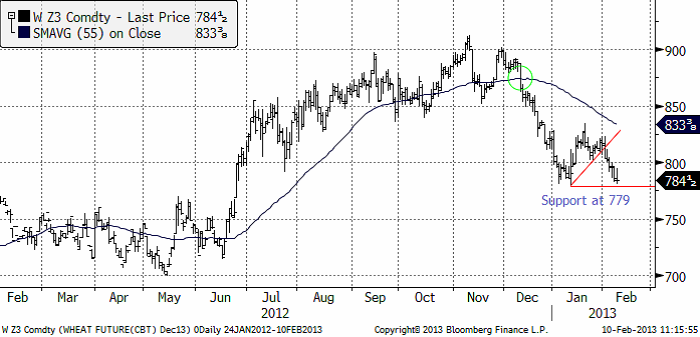
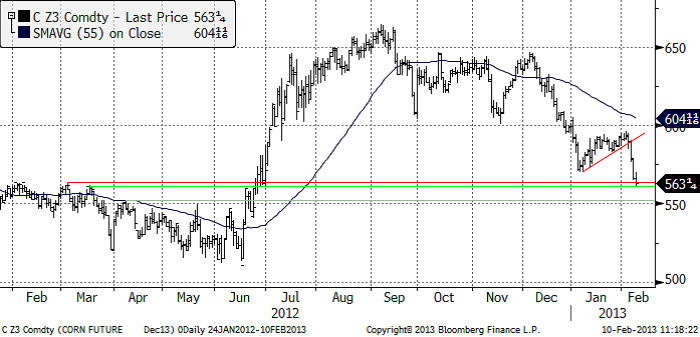
Nedan ser vi decemberkontraktet på CBOT. 800 cent bröts. 779 fungerar som ett tekniskt stöd och där ligger priset nu. Bryts det är 750 cent nästa anhalt på nedsidan.
Så nu till WASDE-rapporten. USDA:s estimat (gissningar) om produktionen för 11/12 och 12/13 ser vi nedan. Man gjorde en liten sänkning endast på fd Sovjets produktion. Brasiliens (Other) sänktes också.
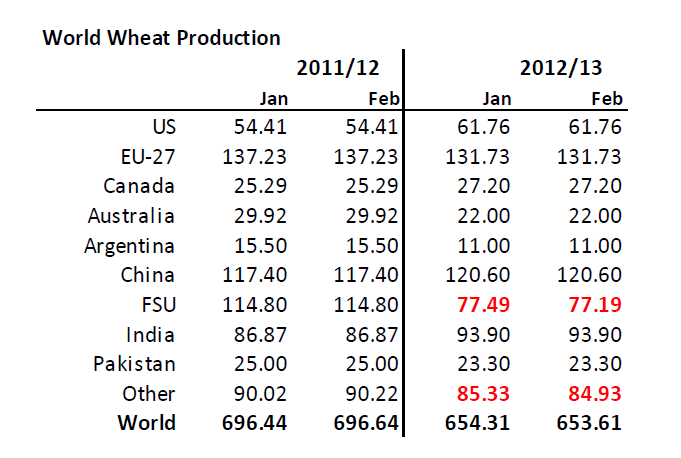
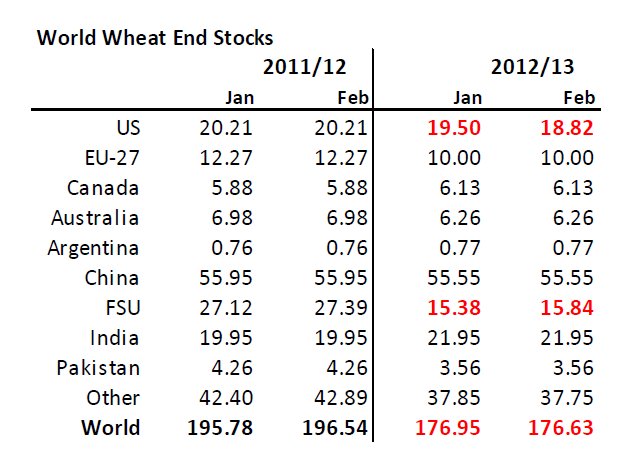
Konsumtionen sänktes något för USA. Nedan ser vi estimatet för utgående lager. Det är obetydliga förändringar och rapporten innehöll inget kursdrivande alls.
Nedan ser vi relationen mellan pris och utgående lager sedan 60-talets början. Varje punkt är ett år, per den 8 februaris pris och estimerat utgående lager varje år. Vi ser att ett lager som räcker i drygt 70 dagar och ett pris på strax under 800 cent ÄR i linje med den relation som varit rådande de senaste åren. Ju mindre lager desto högre pris. Priset ser ut att ligga rätt.
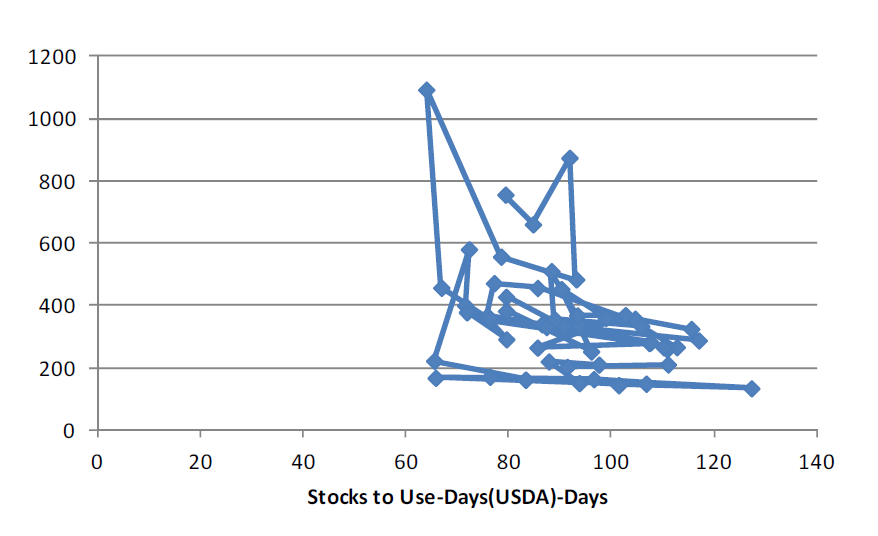
Vi fortsätter vår neutrala vy på vetet.
Maltkorn
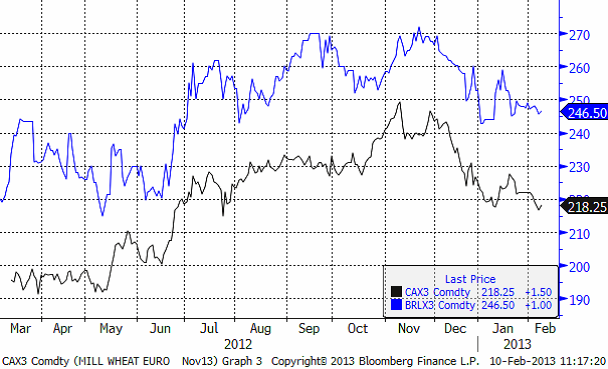
November 2013-kontraktet sjönk för tredje veckan i rad, från 247 euro per ton till 246.50.
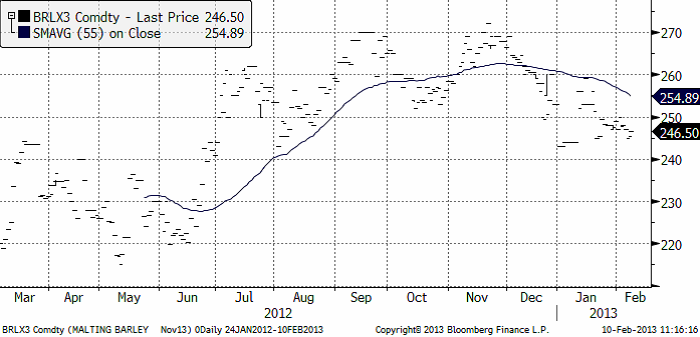
Maltkornsmarknaden är tämligen illikvid och omsättningen har inte tagit fart, som Euronext säkert hoppats när kontraktet introducerades för några år sedan. Nedan ser vi prisutvecklingen på novemberkontraktet på maltkorn och dit för kvarnvete. Vi ser att de följer vandra åt tämligen väl. Om man skulle använda Matifs kvarnvetekontrakt för att prissäkra maltkorn blir inte följsamheten fullt så dålig som man skulle kunna tro.
Majs
Majspriset (december 2013) föll kraftigt i veckan som gick efter att ha brutit det stöd du kunde läsa om förra veckan. Priset har nu fallit ner till ett prisområde där det finns tre ganska starka tekniska stöd. Det mest sannolika härifrån är att marknaden konsoliderar sig med sidledes rörelse, eventuellt ner mot 550 cent.
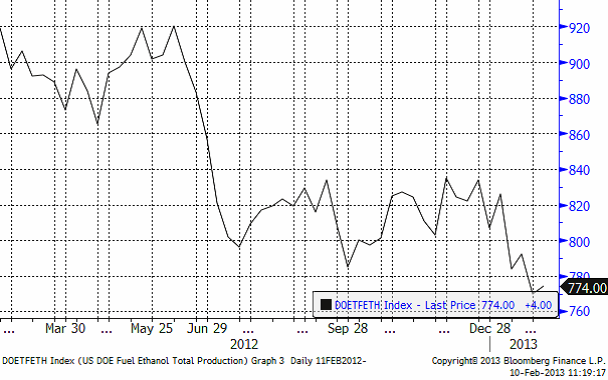
Veckovis etanolproduktion i USA ökade till 704,000 fat per dag från förra veckans rekordlåga 700,000 fat.
Så till fredagens WASDE-rapport. Argentina justerades ner och Brasilien upp. Det var väntat efter det väder som varit. Ukraina och Mexiko justerades också upp något. Brasilianska CONAB förutspår dock en skörd om 76 mt och där ligger USDA efter med 72.5 mt. USDA ligger i och för sig också efter vad man kan tro om ännu lägre skörd i Argentina. På global basis, som vi ser nedan, en något högre väntad skörd i år.
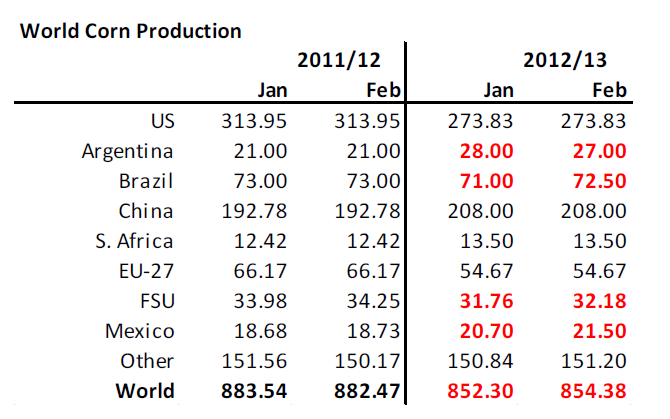
Utgående lager höjdes tillräckligt i rapporten för att ge säljarna ytterligare vind i seglen. Men det är kommer fortfarande att bli ont om majs i sommar, innan den nya skörden kommer in.
Nedan ser vi relationen mellan lager och pris. Liksom för vetet visar diagrammet förhållandet mellan lager och pris varje år i februari.
Även fast lagren är så små att det inte finns så många punkter med lägre lager att förlita sig på, förefaller inte priset nu avvika allt för mycket från de senaste årens relation mellan lager och pris. Vi fortsätter att ha en neutral vy på majs.
Sojabönor
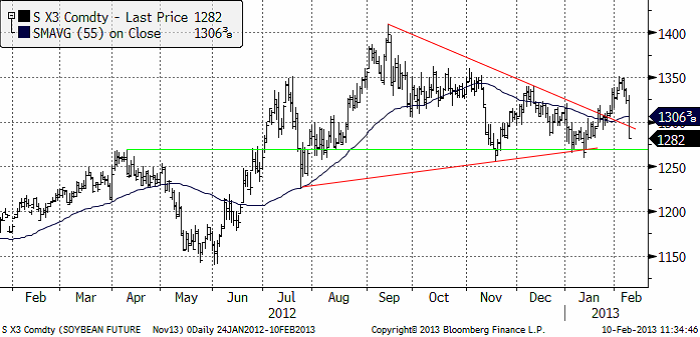
Sojabönorna (november 2013) föll kraftigt efter WASDE-rapporten i fredags. Nästan ända ner till de tekniska stöden vid 1260 cent per bushel. Nedanför ser vi kurdiagrammet för sojabönor (november 2013).
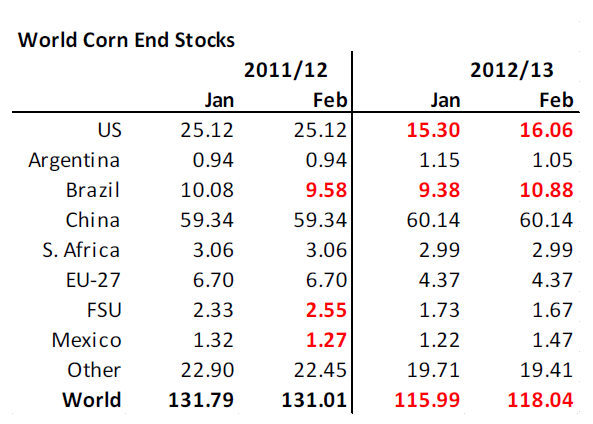
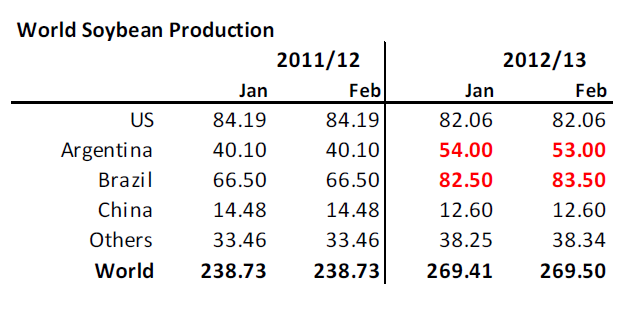
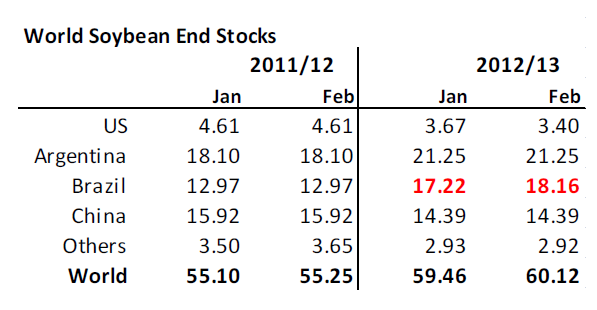
WASDE-rapportens produktionsestimat handlade helt om Sydamerika. Argentinas väntade skörd justerades ner 1 mt och Brasiliens upp lika mycket. Resten lämnades oförändrat.
Nedan ser vi USDA:s estimat på utgående lager. Det är inte någon kioskvältare på papperet. En höjning med lite drygt 0.5 mt. Lagren i USA sänktes till 3.40 från 3.67 mt. Utgående lager i Brasilien höjdes.
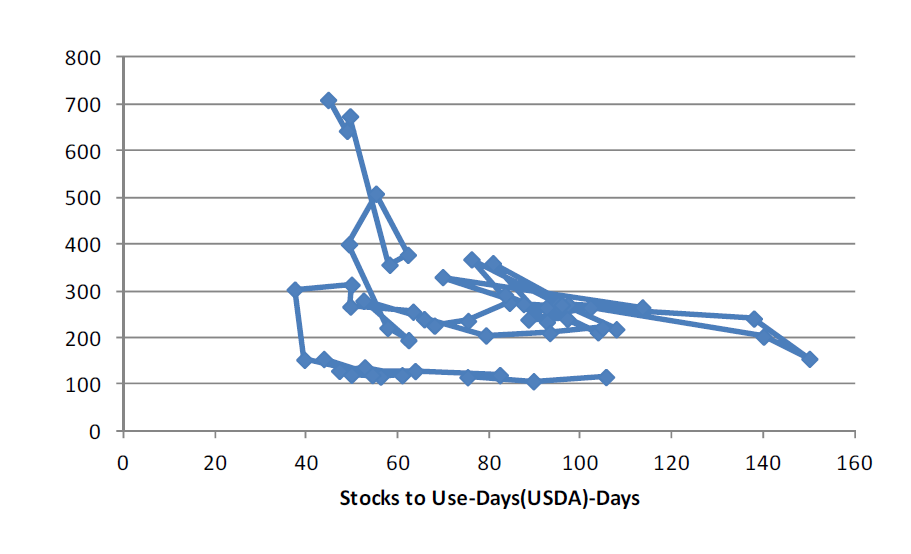
Nedan ser vi relationen mellan pris och lager. I förhållande till de senaste årens relation, ser låg priset innan rapporten något högt. Efter fredagens prisfall ligger priset mer eller mindre mitt i linje med den historiska relationen.
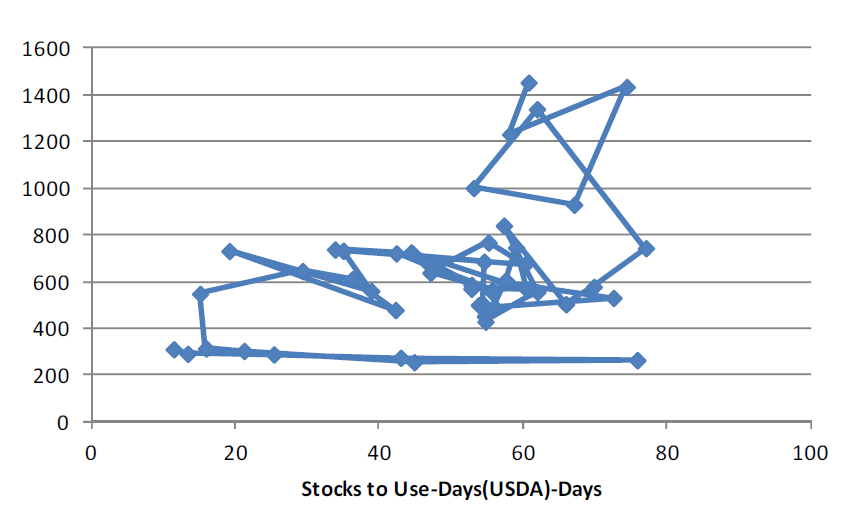
Vi fortsätter därför att ha en neutral rekommendation på sojabönorna.
Raps
Rapspriset (november 2013) har utvecklat sig starkare än sojabönorna. Ett försök att handla rapsen högre i veckan hindrades dock av WASDE-rapporten och det betydande prisfallet efter den i sojabönsmarknaden.
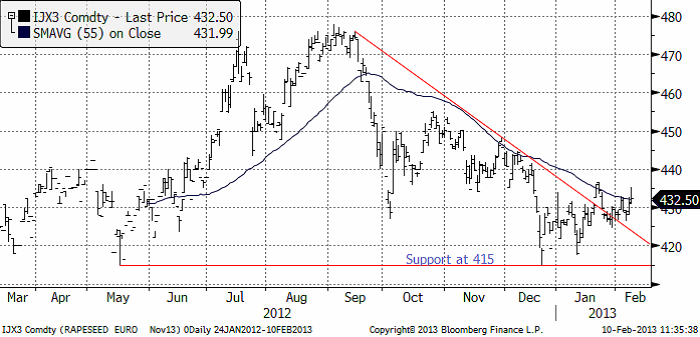
Vi ligger kvar med vår negativa vy för rapspriset.
Gris
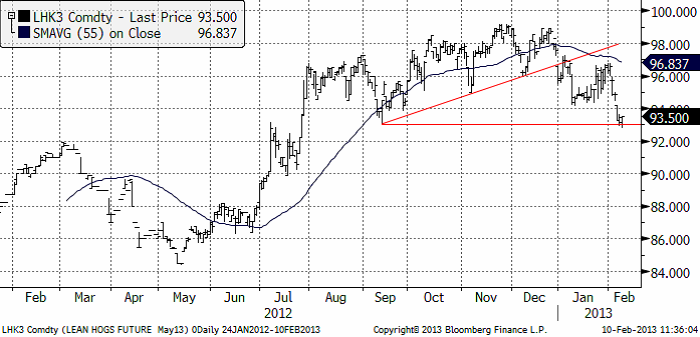
Grispriset (Maj 13) föll förra veckan ner till 93.50. Läsare av veckobrevet har tidigare kunnat läsa att rekylen uppåt efter brottet av den tekniska stödnivån skulle tolkas som ett tillfälle att sälja. Det visade sig vara rätt. Nu ligger priset på stödet och därifrån får marknaden visa vägen. Ännu ett brott nedåt innebär att prisfallet kan fortsätta.
Mjölk
Fonterras auktion i onsdags visade på en prisuppgång på SMP. På Eurex fortsatte dock kräftgången i SMP. Prisutvecklingen på smör fortsatte att falla tillbaka efter toppen i december. I diagrammet nedan ser vi nu fyra kurvor. Den övre tunna linjen är EUREX SMP. Den nedre tunna linjen är Eurex SMP. Den rosa linjen visar priset på helmjölkspulver (WMP) FOB Västeuropa. Källan är USDA och priserna uppdateras varannan vecka. Den röda linjen är Fonterras auktion.
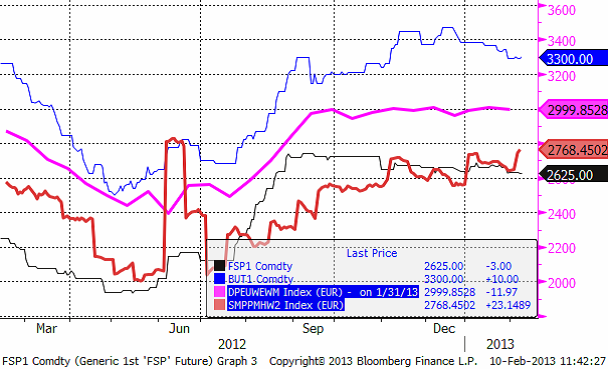
Beprövad erfarenhet säger att vi ska vänta oss ett nytt kraftigt prisfall inom kort.
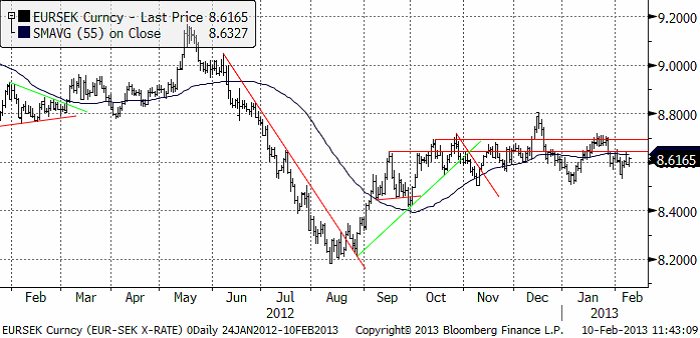
EURSEK
EURSEK fortsatte att röra sig sidledes i veckan som gick. Utsikterna för den kommande veckan är att detta kommer att fortsätta.
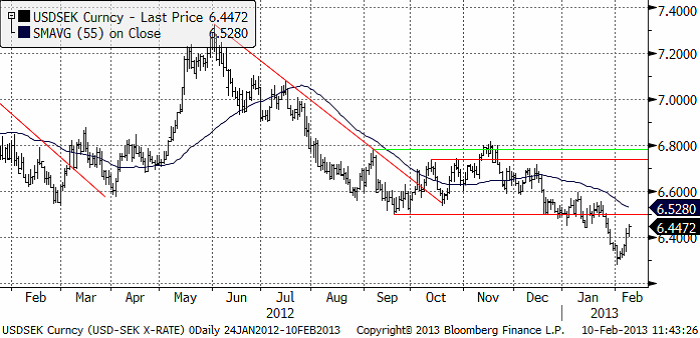
USDSEK
Dollarn rekylerade uppåt mot slutet av veckan. Detta ser ut knappast ut som ett trendbrott, utan som en rekyl i en fallande trend. Därmed är det ett säljtillfälle.
[box]SEB Veckobrev Jordbruksprodukter är producerat av SEB Merchant Banking och publiceras i samarbete och med tillstånd på Råvarumarknaden.se[/box]
Disclaimer
The information in this document has been compiled by SEB Merchant Banking, a division within Skandinaviska Enskilda Banken AB (publ) (“SEB”).
Opinions contained in this report represent the bank’s present opinion only and are subject to change without notice. All information contained in this report has been compiled in good faith from sources believed to be reliable. However, no representation or warranty, expressed or implied, is made with respect to the completeness or accuracy of its contents and the information is not to be relied upon as authoritative. Anyone considering taking actions based upon the content of this document is urged to base his or her investment decisions upon such investigations as he or she deems necessary. This document is being provided as information only, and no specific actions are being solicited as a result of it; to the extent permitted by law, no liability whatsoever is accepted for any direct or consequential loss arising from use of this document or its contents.
About SEB
SEB is a public company incorporated in Stockholm, Sweden, with limited liability. It is a participant at major Nordic and other European Regulated Markets and Multilateral Trading Facilities (as well as some non-European equivalent markets) for trading in financial instruments, such as markets operated by NASDAQ OMX, NYSE Euronext, London Stock Exchange, Deutsche Börse, Swiss Exchanges, Turquoise and Chi-X. SEB is authorized and regulated by Finansinspektionen in Sweden; it is authorized and subject to limited regulation by the Financial Services Authority for the conduct of designated investment business in the UK, and is subject to the provisions of relevant regulators in all other jurisdictions where SEB conducts operations. SEB Merchant Banking. All rights reserved.

Brent is climbing higher. Front-month is at USD 106.3/bl this morning, close to a weekly high and a USD 9/bl jump from Mondays open. This is the move we flagged as a risk earlier in the week: the market shifting from ”a deal is around the corner” to ”this is going to take longer than we thought”.

Analyst Commodities, SEB
During April, rest-of-year Brent remained remarkably stable around USD 90/bl. A stability which rested on one single assumption: the SoH reopens around 1 May. That assumption is now slowly falling apart.
As we highlighted yesterday: every week of delay beyond 1 May adds (theoretically) ish USD 5/bl to the rest-of-year average, as global inventories draw 100 million barrels per week. i.e., a mid-May reopening implies rest-of-year Brent closer to USD 100/bl, and anything pushing into June or July takes us meaningfully higher.
What’s changed in the last 48 hours:
#1: The US military has formally warned that clearing suspected sea mines from SoH could take up to six months. That is a completely different timescale from what the financial market is pricing. Even a political deal tomorrow does not immediately reopen the strait.
#2: Trump has shifted his tone from urgency to ”strategic patience”. In yesterday’s press conference: ”Don’t rush me… I want a great deal.” The market is reading this as a president no longer feeling pressured by timelines, with the naval blockade running in the background.
#3: So far, the military activity is escalating, not de-escalating. Axios reports Iran is laying more mines in SoH. The US 3rd carrier strike group (USS George H.W. Bush) is arriving with two countermine vessels. Trump yesterday ordered the US Navy to destroy any Iranian boats caught laying mines. While CNN reports that the Pentagon is actively drawing up plans to strike Iranian SoH capabilities and individual Iranian military leaders if the ceasefire collapses. i.e., NOT a attitude consistent with an imminent deal!
Spot crude and product prices eased off the early-April highs on a combination of system rerouting and deal optimism. Both now weakening. Goldman estimates April Gulf output is reduced by 14.5 mbl/d, or 57% of pre-war supply, a number that keeps getting worse the longer this drags on.
Demand-side adaptation is ongoing: S. Korea has cut its Middle East crude dependence from 69% to 56% by pulling more from the Americas and Africa, and Japan is kicking off a second round of SPR releases from 1 May. But SPRs are finite.
Ref. to the negotiations, we should not bet on speed. The current Iranian leadership is dominated by genuine hardliners willing to absorb economic pain and run the clock to extract concessions. That is not a setup for a rapid resolution. US/Israeli media briefings keep framing the delay as ”internal Iranian divisions”, the reality is more complicated and points toward weeks and months, not days.
Our point is that the complexity is large, and higher prices have only just started (given a scenario where the negotiations drag out in time). The market spent April leaning on the USD 90/bl rest-of-year assumption; that case is diminishing by the hour. If ”early May reopening” is replaced by ”June, July or later” over the next week or two, both crude and products have meaningful room to reprice higher from here. There is a high risk being short energy and betting on any immediate political resolution(!).
Down on Friday. Up on Monday. The Brent June crude oil contract traded down 5.1% last week to a close of $90.38/b. It reached a high of $103.87/b last Monday and a low of $86.09/b on Friday as Iran announced that the Strait of Hormuz was fully open for transit. That quickly changed over the weekend as the US upheld its blockade of Iranian oil exports while Iran naturally responded by closing the SoH again. The US blew a hole in the engine room of the Iranian ship TOUSKA and took custody of the ship on Sunday. Brent crude is up 5.6% this morning to $95.4/b.

The cease-fire is expiring tomorrow. The US has said it will send a delegation for a second round of negotiations in Islamabad in Pakistan. But Iran has for now rejected a second round of talks as it views US demands as unrealistic and excessive while the US is also blocking the Strait of Hormuz.
While Brent is up 5% this morning, the financial market is still very optimistic that progress will be made. That talks will continue and that the SoH will fully open by the start of May which is consistent with a rest-of-year average Brent crude oil price of around $90/b with the market now trading that balance at around $88/b.
Financial optimism vs. physical deterioration. We have a divergence where the financial market is trading negotiations, improvements and resolution while at the same time the physical market is deteriorating day by day. Physical oil flows remain constrained by disrupted flows, longer voyage times and elevated freight and insurance costs.
Financial markets are betting that a US/Iranian resolution will save us in time from violent shortages down the road. But every day that the SoH remains closed is bringing us closer to a potentially very painful point of shortages and much higher prices.
The US blockade is also a weapon of leverage against its European and Asian allies. When Iran closed the SoH it held the world economy as a hostage against the US. The US blockade of the SoH is of course blocking Iranian oil exports. But it is also an action of disruption directed towards Europe and Asia. The US has called for the rest of the world to engaged in the war with Iran: ”If you want oil from the Persian Gulf, then go and get it”. A risk is that the US plays brinkmanship with the global oil market directed towards its European and Asian allies and maybe even towards China to force them to engage and take part. Maybe unthinkable. But unthinkable has become the norm with Trump in the White House.
Wild moves yesterday. Brent crude traded to a high of $114.43/b and a low of $96.0/b and closed at $99.94/b yesterday.
US – Iran negotiations ongoing or not? What a day. Donald Trump announced that good talks were ongoing between Iran and the US and that the 48 hour deadline before bombing Iranian power plants and energy infrastructure was postponed by five days subject to success of ongoing meetings. Iranian media meanwhile stated that no meetings were ongoing at all.
Today we are scratching our heads trying to figure out what yesterday was all about.
Friends and family playing the market? Was it just Trump and his friends and family who were playing with oil and equity markets with $580m and $1.46bn in bets being placed by someone in oil and equity markets just 15 minutes before Trump’s announcement?
Was Trump pulling a TACO as he reached his political and economic pain point: Brent at $112/b, US Gas at $4/gal, SPX below 200dma and US 10yr above 4.4%?
Different Iranian factions with Trump talking with one of them? Are there real negotiations going on but with the US talking to one faction in Iran while another, the hardliners, are not involved and are denying any such negotiations going on?
Extending the ultimatum to attack and invade Kharg island next weekend? Or, is the five day delay of the deadline a tactical decision to allow US amphibious assault ships and marines to arrive in the Gulf in the upcoming weekend while US and Israeli continues to degrade Iranian military targets till then. And then next weekend a move by the US/Israel to attack and conquer for example the Kharg island?
We do not really know which it is or maybe a combination of these.
We did get some kind of TACO ydy. But markets have been waiting for some kind of TACO to happen and yesterday we got some kind of TACO. And Brent crude is now trading at $101.5/b as a result rather than at $112-114/b as it did no the high yesterday.
But what really matters in our view is the political situation on the ground in Iran. Will hardliners continue to hold power or will a more pragmatic faction gain power?
If the hardliners remain in power then oil pain should extend all the way to US midterm elections. The hardliners were apparently still in charge as of last week. Iran immediately retaliated and damaged LNG infrastructure in Qatar after Israel hit Iranian South Pars. The SoH was still closed and all messages coming out of Iran indicated defiance. Hardliners continues in power has a huge consequence for oil prices going forward. The regime has played its ’oil-weapon’ (closing or chocking the Strait of Hormuz). It is using it to achieve political goals. Deterrence: it needs to be so politically and economically expensive to attack Iran that it won’t happen again in the future. Or at least that the US/Israel thinks 10-times over before they attack again. The highest Brent crude oil closing price since the start of the war is $112.19/b last Friday. In comparison the 20-year inflation adjusted Brent price is $103/b. So Brent crude last Friday at $112.19/b isn’t a shockingly high price. And it is still far below the nominal high of $148/b from 2008 which is $220/b if inflation adjusted. So once in a lifetime Iran activates its most powerful weapon. The oil weapon. It needs to show the power of this weapon and it needs to reap political gains. Getting Brent to $112/b and intraday high of $119.5/b (9 March) isn’t a display of the power of that weapon. And it is not a deterrence against future attacks.
So if the hardliners remain in power in Iran, then the SoH will likely remain chocked all the way to US midterm elections and Brent crude will at a minimum go above the historical nominal high of $148/b from 2008.
Thus the outlook for the oil price for the rest of the year doesn’t depend all that much of whether Trump pulls a TACO or not. Stops bombing or not. It depends more on who is in charge in Iran. If it is the hardliners, then deterrence against future attacks via chocking of the SoH and high oil prices is the likely line of action. It is impacting the world but the Iranian ’oil-weapon’ is directed towards the US president and the the US midterm elections.
If a pragmatic faction gets to power in Iran, then a very prosperous future is possible. However, if power is shifting towards a more pragmatic faction in Iran then a completely different direction could evolve. Such a faction could possibly be open for cooperation with the US and the GCC and possibly put its issues versus Israel aside. Then the prosperity we have seen evolving in Dubai could be a possible future also for Iran.
So far it looks like the hardliners are fully in charge. As far as we can see, the hardliners are still fully in control in Iran. That points towards continued chocking of the SoH and oil prices ticking higher as global inventories (the oil market buffers) are drawn lower. And not just for a few more weeks, but possibly all the way to the US midterm elections.


Solkraften pressar elpriserna dagtid

Michel Gubel ger sin syn på oljemarknaden

Svag vårflod dubblar elpriserna
Brent crude up USD 9/bl on the week… ”deal around the corner” narrative fades
Market Still Betting on Timely Resolution, But Each Day Raises Shortage Risk

Christian Kopfer om läget för oljan
Market Still Betting on Timely Resolution, But Each Day Raises Shortage Risk
Brent crude up USD 9/bl on the week… ”deal around the corner” narrative fades
Michel Gubel ger sin syn på oljemarknaden
Solkraften pressar elpriserna dagtid
-
 Nyheter4 veckor sedan
Christian Kopfer om läget för oljan
-
Analys3 veckor sedan
Market Still Betting on Timely Resolution, But Each Day Raises Shortage Risk
-
Analys3 veckor sedan
Brent crude up USD 9/bl on the week… ”deal around the corner” narrative fades
-
 Nyheter2 veckor sedan
Michel Gubel ger sin syn på oljemarknaden
-
 Nyheter2 veckor sedan
Solkraften pressar elpriserna dagtid
-
Nyheter2 veckor sedan
Svag vårflod dubblar elpriserna