

Analys
SEB Jordbruksprodukter, 10 juni 2013

 Priset på vete har gått ner något på Matif i veckan. Sojabönor har stigit ganska mycket, men ligger precis under ett tekniskt motstånd. Rapspriset på Matif gick i motsatt riktning. Den främsta förklaringen är att medan vädret är ogynnsamt för sojabönorna i USA, är det gynnsamt för rapsen i Europa och framförallt i Kanada. Grispriserna går åt helt olika håll i världen. Medan priset på den tyska Eurex-börsen är nära tvåårslägsta, har Lean Hogs noterat tvåårshögsta i Chicago. Fonterra-noteringen har fortsatt att falla, men priset på SMP har hållit sig stabilit på Eurex, samtidigt som terminspriset på smör stigit.
På onsdag är det dags för WASDE-rapport igen. Några av Bloombergs analytiker-estimat för de mest centrala posterna finns redan att notera inför onsdagen. Du ser dem i nyhetskalendern längre ner i det här brevet.
MARS
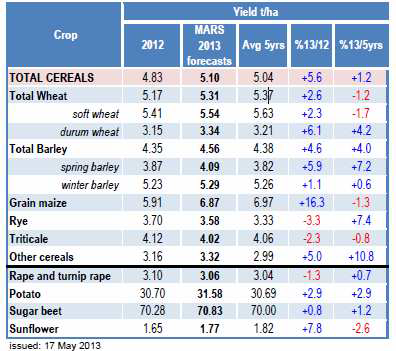
 EU Kommissionens MARS-enhet gjorde en marginell justering nedåt i sin senaste rapport gällande den genomsnittliga avkastningen för vete, majs och oljeväxter medan en marginell justering uppåt gjordes för korn. Varmare temperaturer i bl.a västra Europa har fått fart på grödornas utveckling efter den kalla våren, även om det fortfarande finns märkbara fördröjningar gällande höstgrödorna – framförallt i Storbritannien men även i Benelux länderna – men överlag så kvarstår de nuvarande utsikterna för EU-27 i stort sett i linje med genomsnittet.
Prognosen för EU-27’s vete justerades ner till 5.54 t/ha från förra månadens 5.63 t/ha, vilket fortfarande är en ökning med 2.3% jämfört med förra året men strax under det femåriga genomsnittet på 5.63 t/ha. Detta som en följd av indikationer om lägre avkastning i Storbritannien och Irland där grödorna ligger ca 2-3 veckor efter i sin utveckling samt i Baltikum, Ungern, Tjeckien, Polen och Danmark. Estimatet för Storbritannien justeras ner från 8.02 t/ha till 7.68 t/ha då grödorna har blivit hårt drabbade av förra årets rekordregn, som påverkade förra årets skörd och sådden av årets grödor.
Estimatet för EU-27’s majs reviderades ner från förra månadens 6.96 t/ha till 6.87 t/ha, som dock är en ökning med 16.3% sedan 2012. Norra Italien har drabbats av kraftiga regn under maj månad vilket har försenat sådden av majs. MARS lämnar dock sin prognos för Italien oförändrad för nu, med reservationer för revideringar i avkastningen nedåt framöver. Prognosen för korn justerades däremot upp och ligger nu på 4.56 t/ha, en ökning från förra månadens 4.48 t/ha. Framförallt görs en rejäl uppjustering av höstkorn i Spanien med 25% medan marginella justeringar nedåt görs för t.ex Tyskland och Frankrike. Även avkastningen för vårkorn justeras upp med nästan 4%, också detta på grund av gynnsamma utsikter i Spanien.
Avkastningen för raps och rybs justeras ner marginellt från 3.09 t/ha till 3.06 t/ha då utsikterna för Storbritannien, Rumänien, Ungern och Slovakien har försämrats och inte kompenseras av revideringen uppåt för Polen och den marginella förbättringen i Tyskland.
Vete
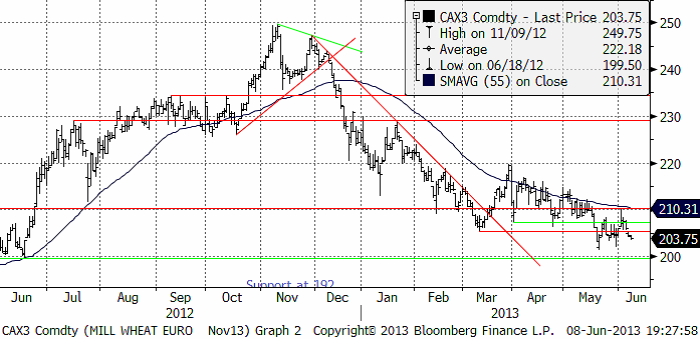
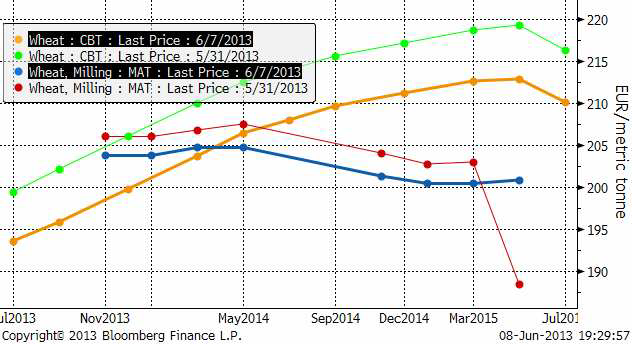
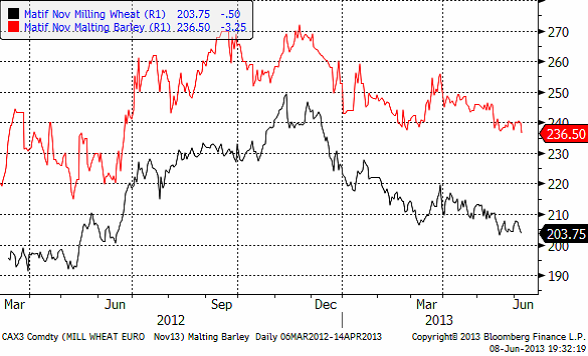
Priset på novemberterminen på Matif föll till 203.75 euro per ton i veckan som gick. Detta trots att Egypten bett Frankrike om hjälp med spannmålsförsörjning, lagring och finansiering av detta, översvämningar i östra Tyskland och att EU-Kommissionen sänkt skördeestimatet med 2 mt till 127.9 mt. Trots allt är det en större skörd än förra årets 123.8 mt.
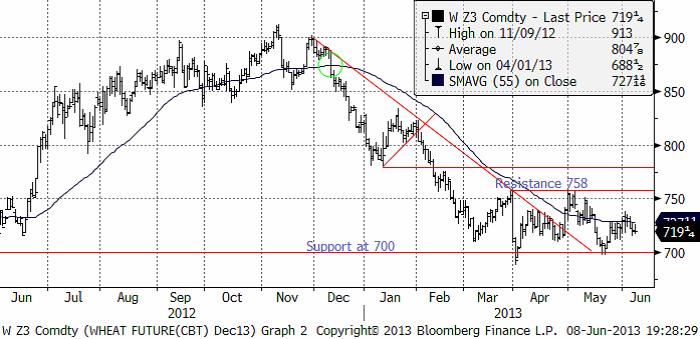
Decemberkontraktet på CBOT har inte visat stora tecken på att vilja gå ner. 700 cent utgör ett starkt stöd, liksom 758 cent ovanför utgör ett motstånd. Just nu och de kommande dagarna ser det ut att finnas möjlighet till ytterligare prisnedgång, ner mot 700 cent kanske och ett test av den nivån.
Nedan ser vi förändringen i terminskurvorna fredag till fredag. Vi ser att Matifs terminsmarknad har sjunkit betydligt mer än den amerikanska.
IGC justerar upp sin prognos för den globala produktionen av vete 2013/14 med 2 mt till 682 mt, en ökning med 4% på årsbasis till följd av högre areal och avkastning, men justerar samtidigt upp sitt estimat för den globala konsumtionen med 2 mt till 680 mt.
FAO-AMIS säger att den globala veteproduktionen 2013/14 förväntas slå rekord och justerar upp sitt estimat till 702 mt, en ökning på 6.5% på årsbasis, på förväntningar om en återhämtning i Europa och Svarta Havsregionen . Konsumtionen förväntas öka med 1.1% där användningen av foder förväntas återgå till mer normala nivåer medan livsmedelskonsumtionen fortsätter att hålla jämna steg med befolkningstillväxten.
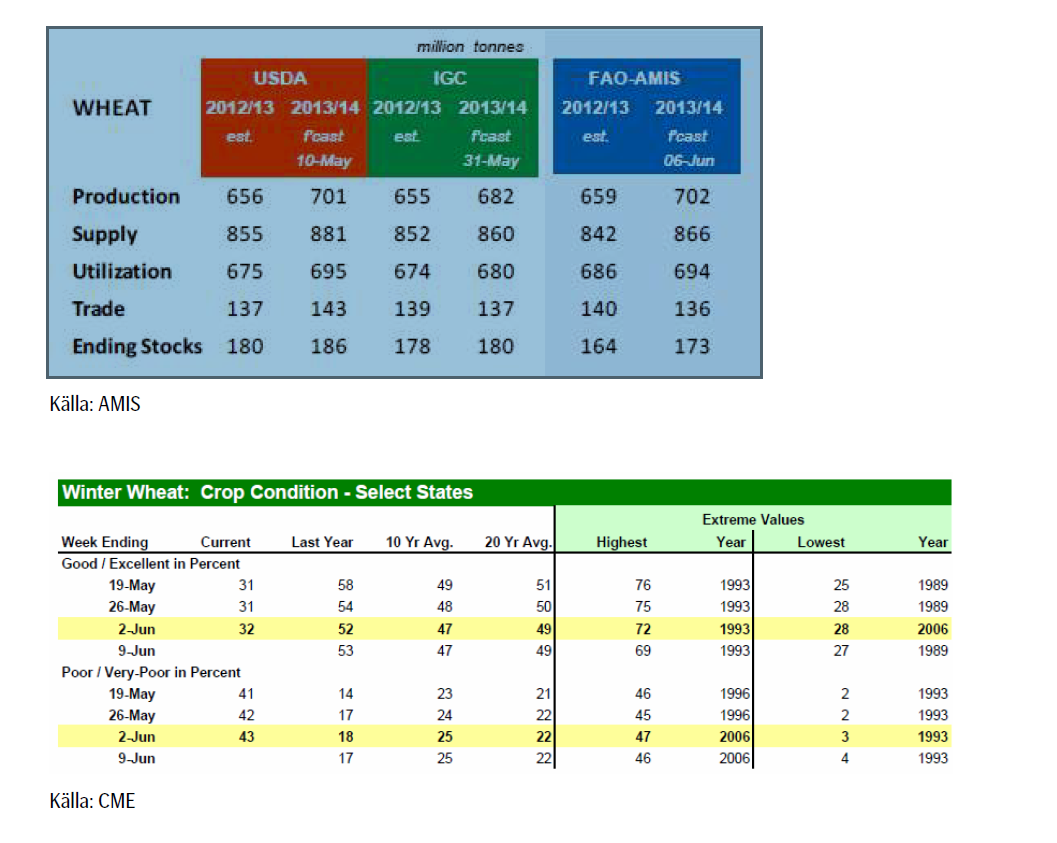
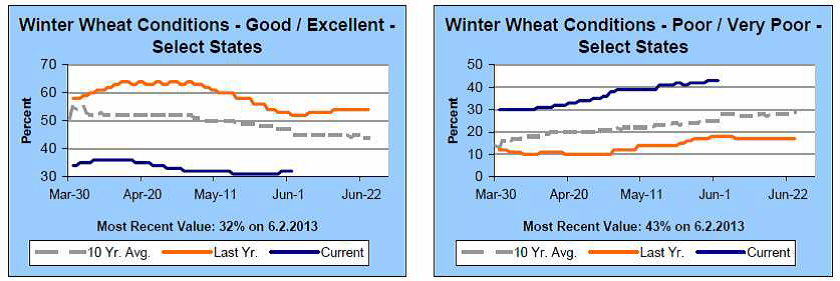
Måndagens Crop Progress rapport från USDA visar på marginella förändringar för det amerikanska höstvetet. För de 18 stater som rapporterar så klassas 32% som ”good/excellent”, upp 1% från förra veckan men väl under förra årets 52% vid samma tid. Höstvete klassat som ”poor/very poor” uppgår till 43%, också det en ökning med 1% från förra veckan och väl över förra årets 18% vid samma tid. Andelen höstvete som har gått i ax fortsätter dock att ligga under genomsnittet, både i de HRW och i de SRW producerande staterna, som en följd av den kalla våren. Per den 2 juni hade 73% gått i ax, vilket är att jämföra med förra årets 88% vid samma tid och det femåriga genomsnittet på 80% vid denna tidpunkt.
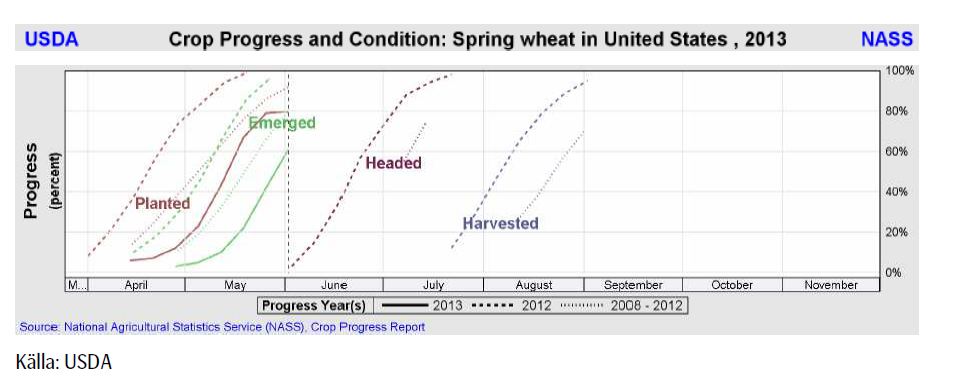
Sådden av vårvete i de 6 största staterna gjorde små framsteg i veckan som gick och är nu avklarad till 80%, upp endast 1% från vecka innan och fortfarande efter förra årets 100% och det femåriga genomsnittet på 92%.
Den största producenten, North Dakota, ligger fortfarande sist med endast 64% av sådden avklarad, jämfört med dess femåriga genomsnitt på 89% vid den här tiden. Rapporten visade också för första gången tillståndet för vårvetet, varav 8% klassas som ”poor/very poor”, medan 64% klassas som ”good/excellent” – att jämföra med förra årets 2% resp 78%.
Slutsatsen är att vi behåller vår säljrekommendation på vete.
Maltkorn
Maltkornet höll sig någorlunda starkt i veckan, men om vetet fortsätter ner, får vi nog se ett nedställ på maltkornet också. Trenden är tydligt nedåtriktad.
Majs
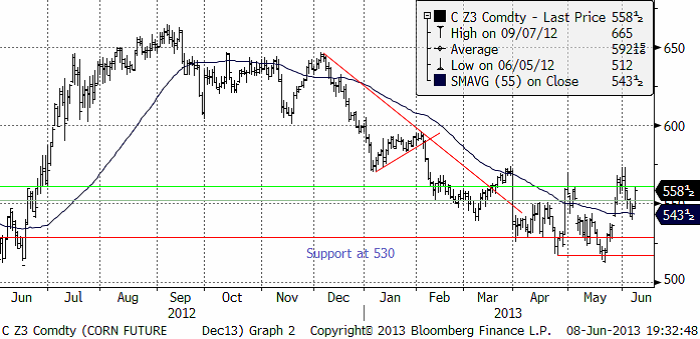
Majspriset (december 2013) har liksom vetet fått stöd den senaste tiden. Efter årslägsta notering i slutet av maj har priset stigit kraftigt uppåt, rekylerat ner och i fredags börjat ett nytt försök uppåt. Än så länge rör sig priserna under den nivån som uppnåddes innan plantings-rapporten från USDA i slutet av mars, men ett test av den nivån kan komma och i så fall kan priset nå ändå upp mot 600 cent. Det vore verkligen ett ödets ironi att vad som väntas bli den största skörden någonsin följs av prisuppgång. Fredagens prisuppgång följde på en förnyad prognos om kallt och vått väder i USA.
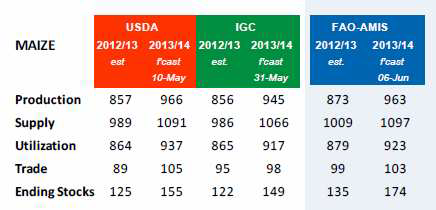
IGC justerar upp sin prognos för den globala produktionen av majs 2013/14 med 6 mt till rekordhöga 945 mt, en ökning med 89 mt på årsbasis. Samtidigt justeras konsumtionen upp med 5 mt till 917 mt. Utgående lager 2013/14 beräknas dock bli mer komfortabla jämfört med året innan, framförallt i USA där lagren förväntas öka mer än dubbelt från 19.3 mt till 44.8 mt. Globala utgående lager justeras upp med 6 mt till 149 mt.
FAO-AMIS säger att den globala majsproduktionen 2013/14 förväntas öka, främst på grund av en återhämtning i USA, och justerar upp sin prognos till 963 mt – en ökning med 90 mt på årsbasis. Även prognosen för den globala konsumtionen revideras upp med 44 mt till 923 mt, till följd av ökad foderanvändning i USA och ett flertal tillväxtländer. Utgående lager förväntas öka med 29% och återspeglar framförallt högre lager i USA men även Kina, Brasilien och Europa.
Till förra helgen hade amerikanska lantbrukare lyckats ta sig till 91% färdigsått, vilket är den långsammaste takten på 17 år.
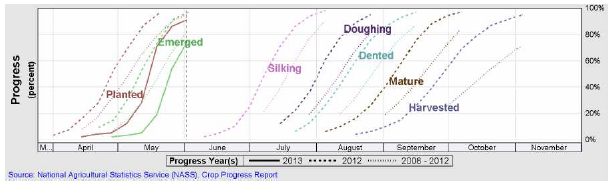
Måndagens Crop Progress visar att lantbrukarna fortsätter att göra framsteg vad gäller sådden av majs, vilken också översteg marknadens förväntningar, trots ihållande regn över majsbältet. Som nämnt ovan, var sådden per den 2 juni i de 18 största majsproducerande staterna avklarad till 91%, en ökning från 86% en vecka tidigare men något lägre än det femåriga genomsnittet på 95% vid den här tiden. Vårens kalla och blöta väder över majsbältet har gjort att årets sådd ligger något efter förra årets sådd som var avklarad vid den här tiden.
Rapporten visade också för första gången tillståndet för majs varav 7% klassas som ”poor/very poor”, medan 63% klassas som ”good/excellent” – att jämföra med förra årets 5% resp 72%, innan torkan slog till. Detta är trots allt mycket bra.
Argentina har skördat 61% av sin majs. Sydamerika har en väsentligt större skörd av majs i år än förra året. USA har bara sålt 52,000 ton av ny skörd hittills vilket är ovanligt lite. Det visar att USA har fått ordentlig konkurrens på den globala marknaden för majs.
Slutsatsen är att vi behåller vår säljrekommendation på majs.
Sojabönor
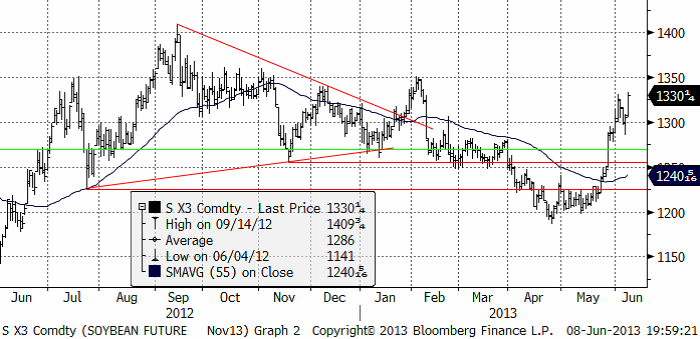
Sojabönorna har rest sig efter att ha alla bevis mot sig. Det kalla och blöta amerikanska vädret är vad som ligger bakom. Tekniskt är 1350 cent på novemberkontraktet ett starkt motstånd, markerat av topp i juli förra året, den övre delen av prisintervallet under oktober och november, en topp i december och en topp i februari.
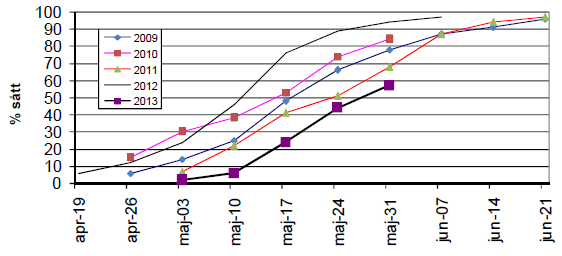
Det stora köparlandet Kina omvartannat både köper och annullerar ordrar från Sydamerika. De makroekonomiska data som kommer ut från landet, visar en ekonomi som bromsar in. Allt fokus just nu är dock på sådden och vädret. I veckan (förra helgen) var 57% sått, och det var en ökning från 44% för två veckor sedan.
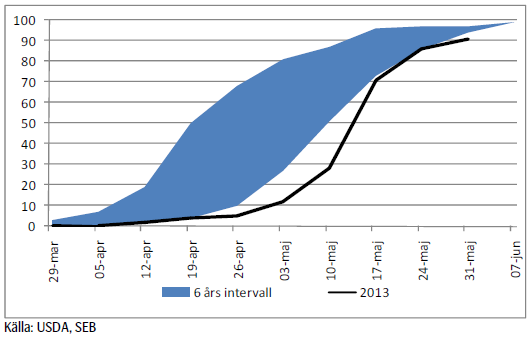
Nedan ser vi såddens utveckling i jämförelse med tidigare år.
Från USDA själva har vi hämtat följande bild:
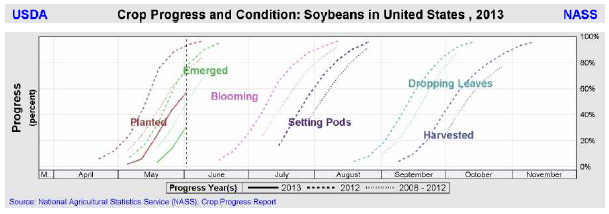
Sådden är alltså avklarad till 57%, vilket kan jämföras med 93% vid den här tiden förra året och det femåriga genomsnittet på 74%.
I Iowa, den största producenten, är sådden endast avklarad till 44% – vilket är långt efter det femåriga genomsnittet på 91% vid denna tid – samtidigt som sådden hos den näst största producenten, Illinois, nu är avklarad till 49%, en ökning från veckan innan men fortfarande efter det femåriga genomsnittet på 69%.
Marknadens byte av fokus från den stora ökningen av Sydamerikas produktion och den svagare kinesiska efterfrågeökningen, till vårsådden i USA och de väderproblem som drabbat följt slag i slag i USA, har fått en vacker baisse att vändas i en kraftig rekyl uppåt. I det här läget är det för sent att ta några korta köpta positioner. Snart nog kommer fokus att flytta till långsiktiga faktorer igen. De slutliga prövningarna blir det fortsatta vädret under sommaren fram till höstens eventuella frostrapporter.
Slutsatsen är att vi behåller och upprepar vår säljrekommendation på sojabönor.
Raps
Rapspriset (November 2013) håller sig inom det prisintervall som det gjort sedan december. Det blev ett kraftigt prisfall i veckan dels på att Kanadas sådd går framåt och på ett kraftigt prisfall på rapsolja i den asiatiska marknaden. Medan det i USA är dåligt väder, är det mycket gynnsamt väder i Kanada.
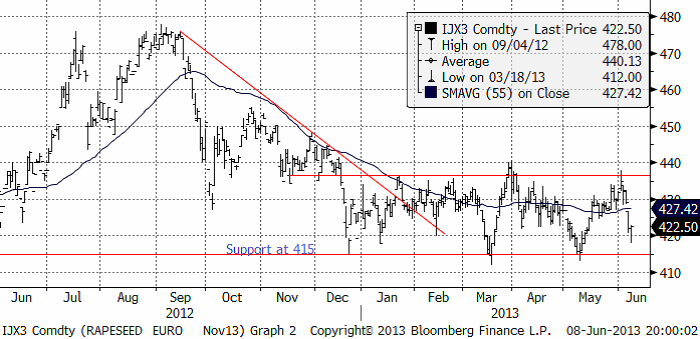
Fredagens prisfall på Matif fick bränsle av ett kraftigt prisfall på rapsolja på den asiatiska marknaden. Anledningen är att man är orolig för att Kina ska dumpa olagligt importerad genmodifierad rapsolja på världsmarknaden. Att fredagens prisfall inte blev värre, får nog ändå ses som ett styrketecken i det korta perspektivet.
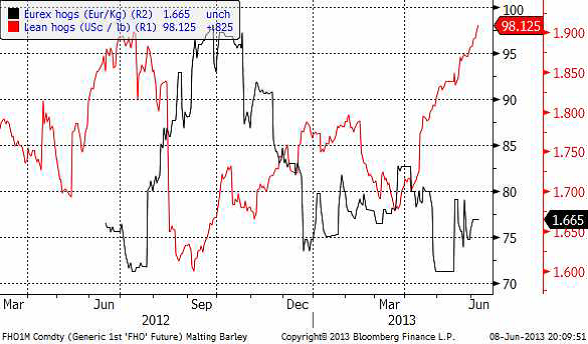
Gris
Medan priset på gris fallit i snart ett år på den tyska börsen, har priset på Lean Hogs i Chicago gått upp till den högsta nivån på flera år. Lean Hogs och det tyska grispriset har det senaste året gått åt motsatt håll även i de mindre rörelserna.
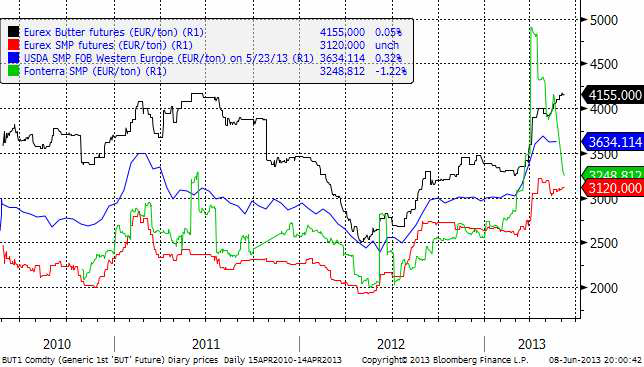
Mjölk
Fonterra-noteringen har fortsatt att falla och ligger nu bara strax över Eurex terminspris på SMP. Medan SMP sjunkit något även på Eurex, har priset på smör på Eurex fortsatt att stiga.
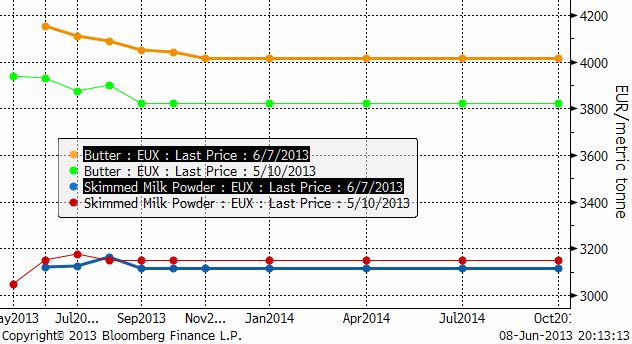
Nedan ser vi terminskurvorna på Eurex för smör och skummjölkspulver per i fredags kväll och för en månad sedan. Vi ser att terminspriserna på SMP gått ner marginellt, men att priset på smör gått upp en hel del.
[box]SEB Veckobrev Jordbruksprodukter är producerat av SEB Merchant Banking och publiceras i samarbete och med tillstånd på Råvarumarknaden.se[/box]
Disclaimer
The information in this document has been compiled by SEB Merchant Banking, a division within Skandinaviska Enskilda Banken AB (publ) (“SEB”).
Opinions contained in this report represent the bank’s present opinion only and are subject to change without notice. All information contained in this report has been compiled in good faith from sources believed to be reliable. However, no representation or warranty, expressed or implied, is made with respect to the completeness or accuracy of its contents and the information is not to be relied upon as authoritative. Anyone considering taking actions based upon the content of this document is urged to base his or her investment decisions upon such investigations as he or she deems necessary. This document is being provided as information only, and no specific actions are being solicited as a result of it; to the extent permitted by law, no liability whatsoever is accepted for any direct or consequential loss arising from use of this document or its contents.
About SEB
SEB is a public company incorporated in Stockholm, Sweden, with limited liability. It is a participant at major Nordic and other European Regulated Markets and Multilateral Trading Facilities (as well as some non-European equivalent markets) for trading in financial instruments, such as markets operated by NASDAQ OMX, NYSE Euronext, London Stock Exchange, Deutsche Börse, Swiss Exchanges, Turquoise and Chi-X. SEB is authorized and regulated by Finansinspektionen in Sweden; it is authorized and subject to limited regulation by the Financial Services Authority for the conduct of designated investment business in the UK, and is subject to the provisions of relevant regulators in all other jurisdictions where SEB conducts operations. SEB Merchant Banking. All rights reserved.

Market is starting to take US/Iran headlines with a pinch of salt. Brent crude rose $2.8/b yesterday to an official close of $112.1/b. But after that it traded as low as $108.05/b before ending late night at around $109.7/b. Through the day it traded in a range of $106.87 – 112.72/b amid a flurry of news or rumors from Iran and the US. ”US temporary sanctions during negotiations” (falls alarm). ”We will bomb Iran” (not anyhow),… etc. While the market is still fluctuating to this kind of news flow, it is starting to take such headlines with a pinch of salt.

We’ll see. Maybe, maybe not. The Brent M1 contract is trading at $110.2/b this morning which very close to the average ticks through yesterday of $110.4/b.
Trump with bearish, verbal intervention whenever Brent trades above $110/b it seems. What seems to be a pattern is that Trump states something like ”very good negotiations going on with Iran”, ”New leaders in Iran are great,..”, ”Great progress in negotiations,…”, ”Deal in sight,..” etc whenever the Brent M1 contract trades above $110/b. An effort to cool the market. These hot air verbal interventions from Trump used to have a heavy bearish impact on prices, but they now seems to have less and less effect unless they are backed by reality.
As far as we can see there has been no real progress in the negotiations between the US and Iran with both sides still standing by their previous demands.
Iran is getting stronger while the cease fire lasts making a return to war for Trump yet harder. Iran is naturally in constant preparation for a return to war given Trump’s steady threats of bombing Iran again. Iran is naturally doing what ever is possible to prepare for a return to war. And every day the cease fire lasts it is better prepared. This naturally makes it more and more difficult and dangerous for the US to return to warring activity versus Iran as the consequences for energy infrastructure in the Persian Gulf will be more and more severe the longer the cease fire lasts. Israel seems to see it this way as well. That the war is not won and that current frozen state of a cease fire gives Iran opportunity to rebuild military and politically.
Global inventories are drawing down day by day. How much? In the meantime the Strait of Hormuz stays closed. There is varying measures and estimates of how much global inventories are drawing down. Our rough estimate, back of the envelope, is that global inventories are drawing down by at least some 10 mb/d or about 300 mb/d in a balance between loss of supply versus demand destruction. Other estimates we see are a monthly draw of 250-270 mb/d. The IEA only ’measured’ a draw in global observable stocks of 117 mb in April with oil on water rising 53 mb while on shore stocks fell 170 mb. But global stocks are hard to measure with large invisible, unmeasured stocks. As such a back of the envelope approach may be better.
Oil products is what the world is consuming. Oil product prices likely to rise while product stocks fall. Strategic Petroleum Reserves (SPR) are predominantly crude oil. Discharging oil from OECD SPR stocks, a sharp reduction in Chinese crude imports and a reduction in global refinery throughput of 6-7 mb/d has helped to keep crude oil markets satisfactorily supplied. But global inventories are drawing down none the less. And oil products is really what the world is consuming. So if global refinery throughput stays subdued, then demand will eventually have to match the supply of oil products. The likely path forward this summer is a steady draw down in jet fuel, diesel and gasoline. Higher prices for these. Then, if possible, higher refinery throughput and higher usage of crude in response to very profitable refinery margins. And lastly sharper draw in crude stocks and higher prices for these. But some 6 mb/d of oil products used to be exported through the Strait of Hormuz. And it may not be so easy to ramp up refinery activity across the world to compensate. Especially as Ukraine continues to damage Russian refineries as well as Russian crude production and export facilities.
Watch oil product stocks and prices as well as Brent calendar 2027. What to watch for this summer is thus oil product inventories falling and oil product premiums to crude rising. Another measure to watch is the Brent crude 2027 contract as it rises steadily day by day as the Strait of Hormuz stays closed and global oil inventories decline. The latter is close to the highest level since the start of the war and keeps rising.
The Brent M1 contract and the Brent 2027 prices and current price of jet fuel in Europe (ARA). All in USD/b

Our back of the envelope calculation of the global shortage created by the closure of the Strait of Hormuz. Note that 3.5 mb/d of discharge from SPR is also a draw. Note also that ’Forced demand loss’ of 2.5 mb/d is probably temporary and will fall back towards zero as logistics are sorted out leaving ’Price demand loss’ to do the job of balancing the market. Thus a shortfall of at least 9 mb/d created by the closure. More if SPR discharge is included and more if Forced demand loss recedes.

Brent is climbing higher. Front-month is at USD 106.3/bl this morning, close to a weekly high and a USD 9/bl jump from Mondays open. This is the move we flagged as a risk earlier in the week: the market shifting from ”a deal is around the corner” to ”this is going to take longer than we thought”.

Analyst Commodities, SEB
During April, rest-of-year Brent remained remarkably stable around USD 90/bl. A stability which rested on one single assumption: the SoH reopens around 1 May. That assumption is now slowly falling apart.
As we highlighted yesterday: every week of delay beyond 1 May adds (theoretically) ish USD 5/bl to the rest-of-year average, as global inventories draw 100 million barrels per week. i.e., a mid-May reopening implies rest-of-year Brent closer to USD 100/bl, and anything pushing into June or July takes us meaningfully higher.
What’s changed in the last 48 hours:
#1: The US military has formally warned that clearing suspected sea mines from SoH could take up to six months. That is a completely different timescale from what the financial market is pricing. Even a political deal tomorrow does not immediately reopen the strait.
#2: Trump has shifted his tone from urgency to ”strategic patience”. In yesterday’s press conference: ”Don’t rush me… I want a great deal.” The market is reading this as a president no longer feeling pressured by timelines, with the naval blockade running in the background.
#3: So far, the military activity is escalating, not de-escalating. Axios reports Iran is laying more mines in SoH. The US 3rd carrier strike group (USS George H.W. Bush) is arriving with two countermine vessels. Trump yesterday ordered the US Navy to destroy any Iranian boats caught laying mines. While CNN reports that the Pentagon is actively drawing up plans to strike Iranian SoH capabilities and individual Iranian military leaders if the ceasefire collapses. i.e., NOT a attitude consistent with an imminent deal!
Spot crude and product prices eased off the early-April highs on a combination of system rerouting and deal optimism. Both now weakening. Goldman estimates April Gulf output is reduced by 14.5 mbl/d, or 57% of pre-war supply, a number that keeps getting worse the longer this drags on.
Demand-side adaptation is ongoing: S. Korea has cut its Middle East crude dependence from 69% to 56% by pulling more from the Americas and Africa, and Japan is kicking off a second round of SPR releases from 1 May. But SPRs are finite.
Ref. to the negotiations, we should not bet on speed. The current Iranian leadership is dominated by genuine hardliners willing to absorb economic pain and run the clock to extract concessions. That is not a setup for a rapid resolution. US/Israeli media briefings keep framing the delay as ”internal Iranian divisions”, the reality is more complicated and points toward weeks and months, not days.
Our point is that the complexity is large, and higher prices have only just started (given a scenario where the negotiations drag out in time). The market spent April leaning on the USD 90/bl rest-of-year assumption; that case is diminishing by the hour. If ”early May reopening” is replaced by ”June, July or later” over the next week or two, both crude and products have meaningful room to reprice higher from here. There is a high risk being short energy and betting on any immediate political resolution(!).
Down on Friday. Up on Monday. The Brent June crude oil contract traded down 5.1% last week to a close of $90.38/b. It reached a high of $103.87/b last Monday and a low of $86.09/b on Friday as Iran announced that the Strait of Hormuz was fully open for transit. That quickly changed over the weekend as the US upheld its blockade of Iranian oil exports while Iran naturally responded by closing the SoH again. The US blew a hole in the engine room of the Iranian ship TOUSKA and took custody of the ship on Sunday. Brent crude is up 5.6% this morning to $95.4/b.
The cease-fire is expiring tomorrow. The US has said it will send a delegation for a second round of negotiations in Islamabad in Pakistan. But Iran has for now rejected a second round of talks as it views US demands as unrealistic and excessive while the US is also blocking the Strait of Hormuz.
While Brent is up 5% this morning, the financial market is still very optimistic that progress will be made. That talks will continue and that the SoH will fully open by the start of May which is consistent with a rest-of-year average Brent crude oil price of around $90/b with the market now trading that balance at around $88/b.
Financial optimism vs. physical deterioration. We have a divergence where the financial market is trading negotiations, improvements and resolution while at the same time the physical market is deteriorating day by day. Physical oil flows remain constrained by disrupted flows, longer voyage times and elevated freight and insurance costs.
Financial markets are betting that a US/Iranian resolution will save us in time from violent shortages down the road. But every day that the SoH remains closed is bringing us closer to a potentially very painful point of shortages and much higher prices.
The US blockade is also a weapon of leverage against its European and Asian allies. When Iran closed the SoH it held the world economy as a hostage against the US. The US blockade of the SoH is of course blocking Iranian oil exports. But it is also an action of disruption directed towards Europe and Asia. The US has called for the rest of the world to engaged in the war with Iran: ”If you want oil from the Persian Gulf, then go and get it”. A risk is that the US plays brinkmanship with the global oil market directed towards its European and Asian allies and maybe even towards China to force them to engage and take part. Maybe unthinkable. But unthinkable has become the norm with Trump in the White House.


Sommarväder skapar prisrally på elbörsen
Oil product price pain is set to rise as the Strait of Hormuz stays closed into summer

Solkraften pressar elpriserna dagtid

Michel Gubel ger sin syn på oljemarknaden