

Analys
SEB – Råvarukommentarer, 10 juni 2013

Rekommendationer
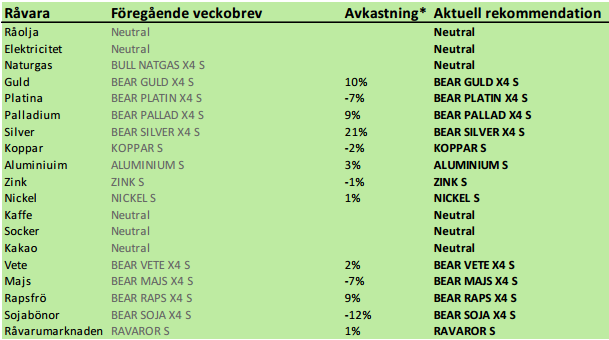
*) Avkastningen avser 1:1 råvarucertifikat där de ingår i rekommendationen. I den aktuella tabellen ovan har jag tagit prisförändringen den senaste veckan sedan det förra veckobrevet publicerades.
Inledning
Bloomberg rapporterar att inte sedan prisfallet började, har så många analytiker varit så positiva till guldpriset som de är nu. Och så bryter såväl silver- som guldpriset sina respektive tekniska stöd! Om så många är positiva och priset plötsligt faller, så måste man tro marknaden – prisfallet fortsätter.
Oljan har under tiden reagerat positivt på högre sysselsättning i USA. Priset ligger strax under 105 dollar per fat. Om 105 dollar bryts – en teknisk motståndsnivå, kan vi få en ny uppgång. Under tiden kommer allt mer signaler från Kina som säger att landets ekonomi bromsar in. Samtidigt i Europa har ordförandelandet Irland lagt fram ett förslag om höjning av energiskatter inom EU, vilket är ett försiktigare förslag än det ursprungliga från år 2011.
USDA publicerar månadens WASDE-rapport för vete, majs och soja på onsdag.
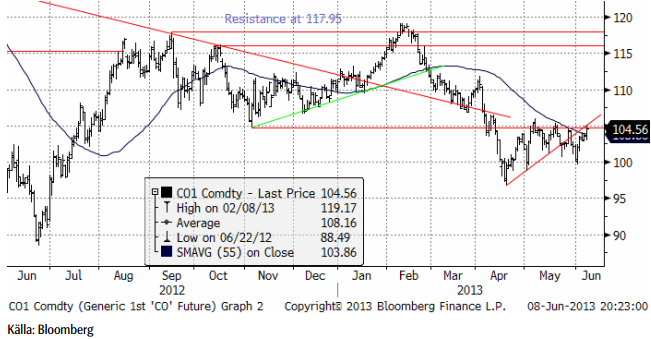
Råolja – Brent
När amerikansk arbetsmarknadsstatistik visade en högre sysselsättning än väntat steg oljepriset i fredags. Tekniskt ser det ut som om uppgången har goda chanser att bryta igenom motståndet på 105 dollar och kanske gå upp mot 107 dollar i det mycket korta perspektivet av den kommande veckan.
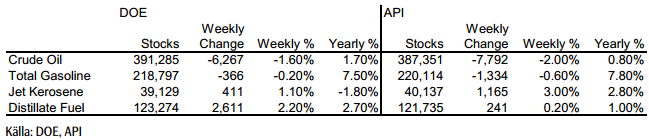
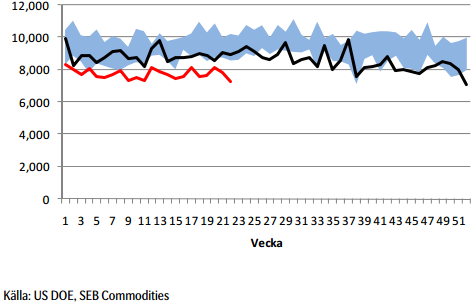
Lagren och lagerförändringarna i USA den senaste rapportveckan ser vi nedan, enligt Department of Energy och American Petroleum Institute.
Nedan ser vi amerikanska råoljelager enligt DOE i tusen fat. Den svarta kurvan är 2012 års lagernivåer vecka för vecka och den lilla röda linjen är 2013 års nivå.
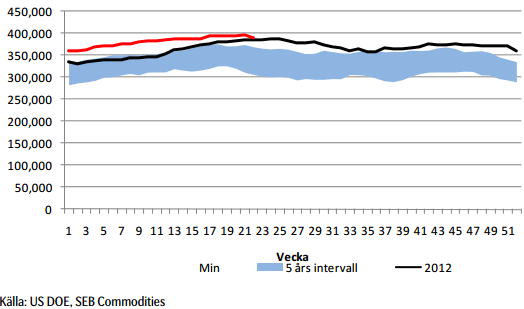
Importen fortsätter att hålla sig under förra årets nivå.
Vår vy är neutral till positiv. Det kan i det korta perspektivet komma en uppgång.
Elektricitet
Förra veckan slutade i baisse. Men priset är nere på tidigare bottennivåer och det kan vara läge att börja fundera på att köpa el på de här nivåerna. Man ska nog inte ha någon brådska att köpa, men vi anser att man ska handla från den långa sidan nu.
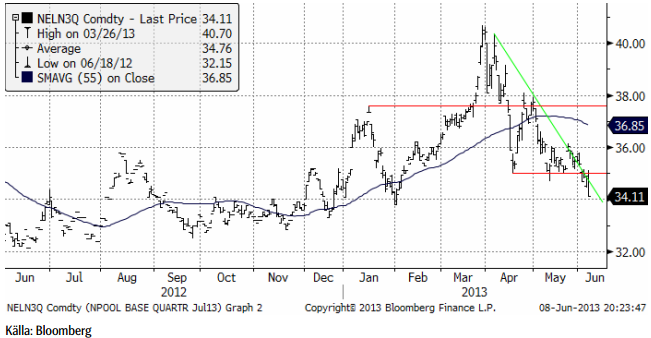
Hydrologisk balans har fortsatt att stiga, som vi ser i nedanstående diagram.
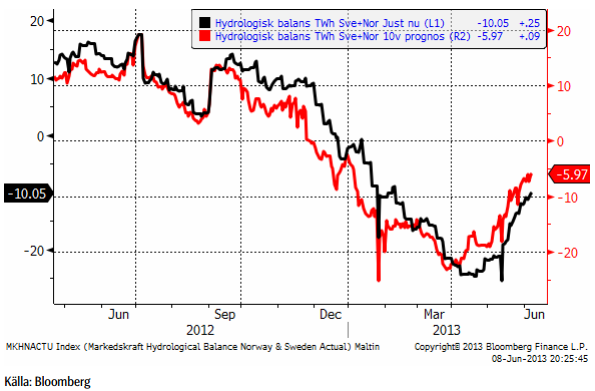
Priset har kommit ner så pass att det börjar bli intressant att köpa el, men rekommendationen blir än så länge ”neutral”.
Naturgas
Väderleksrapporten för USA är för den närmaste veckan vått och kallt, men därefter väntas en riktig värmebölja komma in över USA. Naturgas används för att producera el i USA och elen används i luftkonditionering. Förra veckan nådde temperaturen i Texas upp till nästan 40 grader. Den senaste veckans lagerstatistik visade en högre lagerökning än vad som var väntat och med kallt väder kan man vänta sig ytterligare lagerökning i veckan som kommer. Detta får priset på fall. Tekniskt är dock 3.80 ett stöd och vi väntar oss att prisfallet finner stöd där.
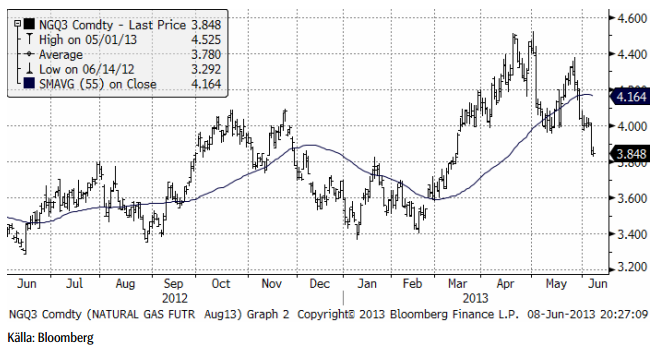
IEA rapporterar att de två kärnreaktorer som står still vid San Onofre i Kalifornien kommer att ersättas med naturgas. Det är ännu ett tecken på att gasen tar marknadsandelar i USA. Baker Hughes Rig Count data visar att antalet borr-riggar för gas ligger kvar nära 18-årslägsta som noterades den 10 maj. Orsaken till detta ointresse är det låga priset och för att produktionen ökar ändå. EIA räknar med att år 2013 blir det sjätte året på raken med rekordproduktion av naturgas i USA.
Guld & Silver
Guldpriset föll abrupt i fredags, trots att analytikerna inte varit så positiva sedan prisfallet började – enligt en sammanställning av Bloomberg. När så många sägs vara positiva och priset ändå faller, är det en signal om att prisfallet kan få en fortsättning.
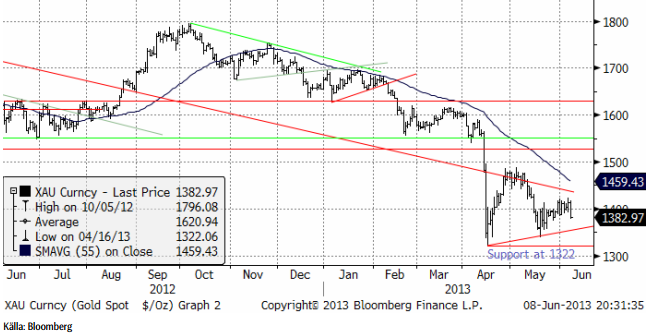
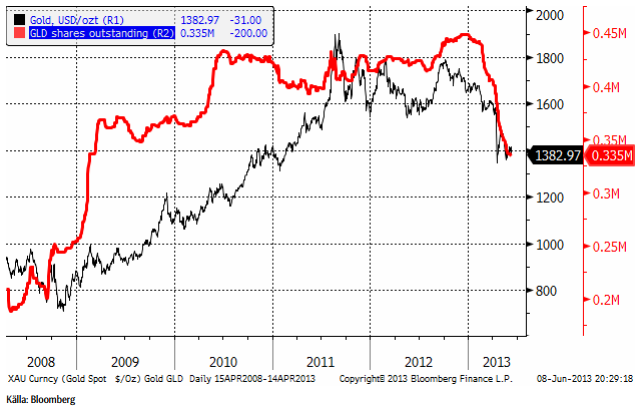
Investerare fortsätter att likvidera sina innehav av Gold Spiders, som vi ser nedan.
Nedan ser vi kursdiagrammet för silver i dollar per troy ounce. Stödet på 22 dollar bröts i fredags och det signalerar ett pågående prisfall ned mot 20 dollar.
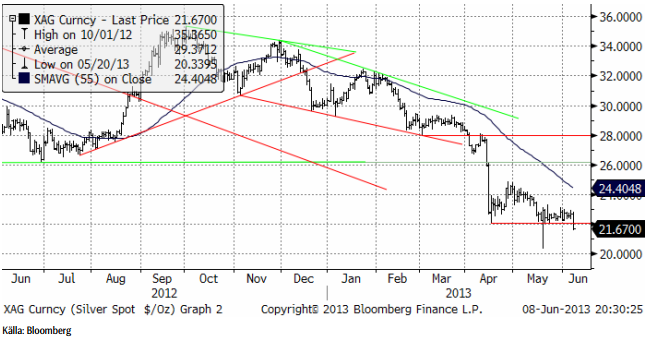
Jag tror att silverpriset kan gå lite lägre från dagens nivå, ner mot 20 dollar.
Vi ligger korta guld och silver. Jag tror att det kommer en till vända ner och ligger självklart kvar med köpt position i BEAR GULD X4 S och BEAR SILVER X4 S.
Platina & Palladium
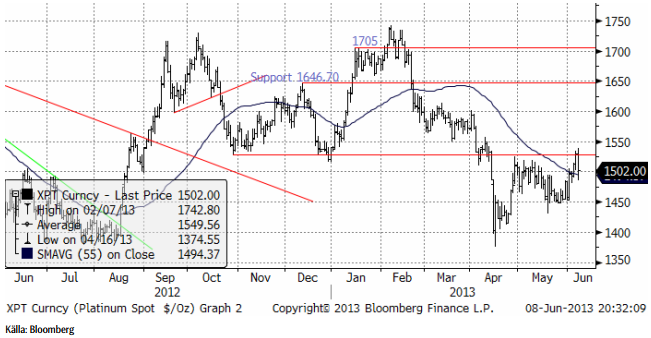
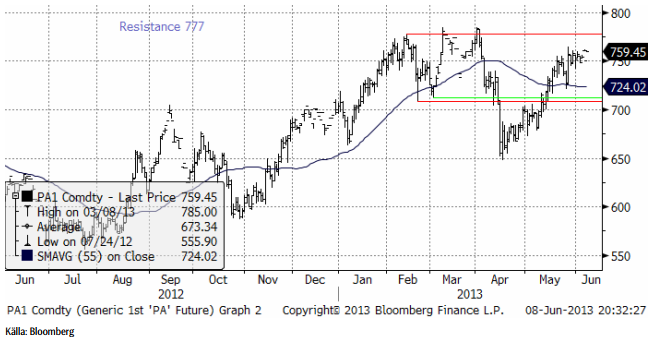
Platina har stigit upp till ett tekniskt motstånd och vänt ner därifrån med besked. Det ser inte lika svagt ut som för silver, men det är i vart fall inte köpläge i platina just nu.
Palladium har gått bäst av alla fyra ädelmetaller vi följer. Uppgången från botten i april ser nu ut att ha tappat kraft och det skulle inte förvåna om marknaden rekylerar ner till ca 700 dollar i det korta perspektivet.
Vi ligger kvar såld både platina och palladium, dvs med BEAR PLATNA X4 S och BEAR PALLAD X4 S.
Basmetaller
Basmetallerna utvecklades olika under veckan. Koppar och Zink stängde ner runt procenten, medan aluminium och nickel uppvisade imponerande rallyn inledningsvis med ett par procents uppgång, för att stänga veckan upp ca 1 %. Tokyobörsen har åkt jo-jo, vilket påverkat stämningsläget dag från dag. I USA fokuseras på tidramen för QE3. Paradoxalt nog skapar svagare siffror än väntat ökad riskaptit, då stimulanserna antas vara lite längre. Förra veckans månadsskifte innebar inköpschefsstatistik (PMI) världen över. Kina var först ut. Efter den preliminära siffran från HSBC i mitten av månaden (som kom in svagare än väntat under 50-nivån), visade den officiella PMI-siffran 50,8 jämfört med 50,6 förra månaden, och mycket bättre än väntade 50,0. Optimismen från Kina följdes upp med bättre siffror än väntat i Europa, vilket dock grusades av den amerikanska siffran som under måndagseftermiddagen kom in under 50, klart sämre än väntat. Således väldigt blandade signaler. Handeln blev därefter med sidledes prisrörelser utan någon egentlig riktning, till stor del avvaktande inför den viktiga arbetsmarknadsstatisktiken på fredagen. Antalet nya arbetstillfällen ökade med 175 000, något 10-tusental bättre än väntat. Å andra sidan reviderades den förra siffran ner med ungefär lika mycket. Ingen större vägledning således.
Koppar
Som vi skrivit tidigare har vi haft kopparn under bevakning för att gå från neutral till köp. Tekniskt sett har vi bedömt förutsättningarna som goda för kortsiktig uppgång. Trots de senaste veckornas tveksamhet, tar vi fasta på indikationer att det negativa stämningsläget kring koppar håller på att svänga om. Som vi skrivit tidigare tyder mycket på att lagren i Kina har betats av, och att avmattningen av importen är relativt snart övergående.
Tekniskt sett fokuserar vi på ”dubbelbotten” från april och maj, som ger en potentiell uppgång till $7620, där motståndet sätter in. Nästa nivå är $7800. Den omedelbara pressen på koppar verkar vara över och den nedåtgående trenden är bruten.
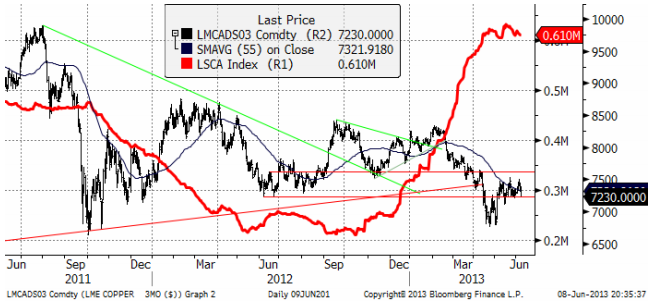
Vi förväntar oss fortsatt hög volatilitet. Vår kortsiktiga bedömning talar för uppsidan och vi rekommenderar därför köp av BULL KOPPAR X2 S eller X4 S.
Aluminium
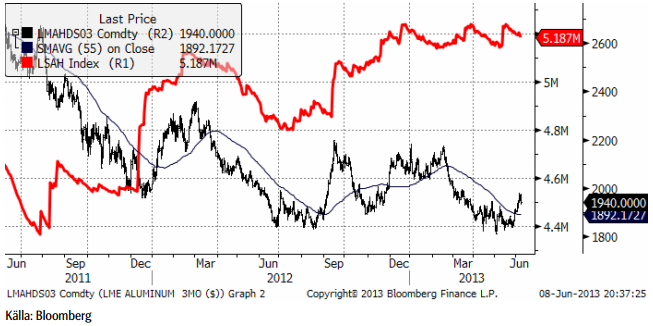
Priset har nu ”testat” stödnivåerna vid $1810-20 vid ett flertal tillfällen, och lyckats studsa upp. Det är ett styrketecken. Vi ser fysiska aktörer som går in och täcker in framtida konsumtion via terminsköp vid varje dipp. Tekniskt orienterade fonder har tidigare sålt vid varje uppställ. I förra veckan bröts mönstret. Istället började finansiella aktörer att köpa tillbaka kortpositioner i stora kvantiteter. Förra fredagens stängning över $1900, med ett bekräftat brott ur triangelformationen i kombination med förra helgens starka Kinasiffror, gav förutsättningar för fortsatt uppgång på kort sikt, i första hand upp till $1950-nivån (vilket också materialiserades med råge under veckan som gick). Vi ser mer långsiktiga tecken på att marknaden håller på att bottna ur. Högkostnadsproducenterna, framför allt i Kina, förväntas minska utbudet (ännu mer) om priset långvarigt stannar på nuvarande nivåer. Den största aluminiumproducenten Chalco, annonserade i veckan att de stänger ytterligare produktionskapacitet motsvarande 380 tton.
Långsiktigt är nivån väldigt intressant för kontraktet Aluminium S (utan hävstång). Kortsiktigt är ett kontrakt med hävstång intressant. Bevaka motståndet vid $1950. Ett definitivt brott (på veckobasis) av den nivån ”öppnar upp” för större uppgångspotential.
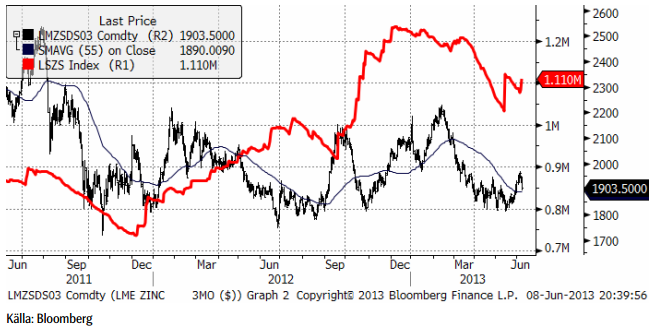
Zink
Situationen för zink påminner om den för aluminium, både fundamentalt och tekniskt. Vi bedömer zinken som ”billig” ur ett kostnadsperspektiv och nuvarande nivåer är mycket intressanta på lite längre sikt (6-12 månader). I det perspektivet är Zink S (utan hävstång) att föredra.
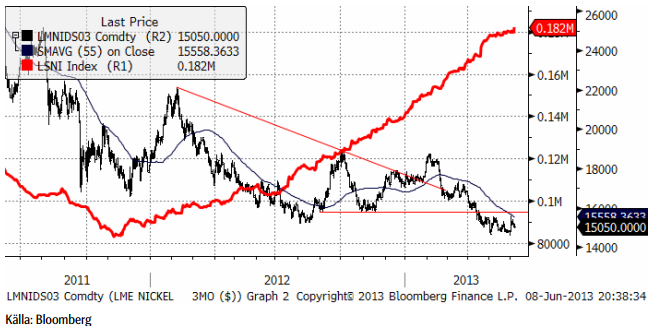
Nickel
Nickel uppvisade förnyad svaghet förra fredagen. Priset var som hastigast nere och noterade en ny lägsta nivå under $14600, men återhämtade sig väldigt snabbt och stängde veckan lite mer betryggande kring $14800. Veckan som gick inleddes med en kraftig prisuppgång till nivåer kring $15300 (som hastigast handlades $15600 som högst efter att stora ”stop-loss” ordrar utlöstes på uppsidan). Trots väldigt goda efterfrågeutsikter på sikt, där den rostfria- och specialstålproduktionen förväntas öka med fortsatt utbyggnad av olje- och gasproduktion och specialstål till flygindustrin, ”lider” nickelmarknaden av ett överskott. Produktionstekniken av s.k. Nickel Pig Iron i Kina har utvecklats med s.k. Rotary Kiln Electric Furnaces (RKEF) teknik, vilken i genomsnitt sänker hela kostnadskurvan. Samtidigt får högkostnadsproducenterna i gruvledet problem på nuvarande nivåer. Vi har tidigare rapporterat om produktionsneddragningar i Australien, och det förväntas komma mer.
Effekten av RKEF-tekniken riskerar att flytta ner nivån där utbudsminskningarna verkligen får effekt. Priset har brutit viktigastödnivåer, och vi får gå tillbaka till juli 2009 för att hitta lägre priser. I det perspektivet kommer nästa stora stödnivå in kring $14000. Vi är inte så långt därifrån och vi bedömer nivåerna från dagens pris kring $15000 ned mot den nivån, som väldigt attraktiva på 6-12 månaders sikt. I det perspektivet är Nickel S (utan hävstång) att föredra.
Ur ett tekniskt perspektiv är den senaste utvecklingen intressant. Marknaden ”testade” nya låga nivåer, vilket inte lockade fram fler tekniska fonder att sälja. Istället stängde det på dagshögsta förra fredagen. Med Kinas siffror i ryggen inleddes veckan med goda förutsättningar för en kortsiktig uppgång, vilket vi fick se med besked! Som sagt såg vi priset som högst i $15600 under måndagen. Priset föll tillbaka successivt under veckan och stänger relativt neutralt kring $15000.
[box]SEB Veckobrev Veckans råvarukommentar är producerat av SEB Merchant Banking och publiceras i samarbete och med tillstånd på Råvarumarknaden.se[/box]
Disclaimer
The information in this document has been compiled by SEB Merchant Banking, a division within Skandinaviska Enskilda Banken AB (publ) (“SEB”).
Opinions contained in this report represent the bank’s present opinion only and are subject to change without notice. All information contained in this report has been compiled in good faith from sources believed to be reliable. However, no representation or warranty, expressed or implied, is made with respect to the completeness or accuracy of its contents and the information is not to be relied upon as authoritative. Anyone considering taking actions based upon the content of this document is urged to base his or her investment decisions upon such investigations as he or she deems necessary. This document is being provided as information only, and no specific actions are being solicited as a result of it; to the extent permitted by law, no liability whatsoever is accepted for any direct or consequential loss arising from use of this document or its contents.
About SEB
SEB is a public company incorporated in Stockholm, Sweden, with limited liability. It is a participant at major Nordic and other European Regulated Markets and Multilateral Trading Facilities (as well as some non-European equivalent markets) for trading in financial instruments, such as markets operated by NASDAQ OMX, NYSE Euronext, London Stock Exchange, Deutsche Börse, Swiss Exchanges, Turquoise and Chi-X. SEB is authorized and regulated by Finansinspektionen in Sweden; it is authorized and subject to limited regulation by the Financial Services Authority for the conduct of designated investment business in the UK, and is subject to the provisions of relevant regulators in all other jurisdictions where SEB conducts operations. SEB Merchant Banking. All rights reserved.


The latest weekly report from the US DOE showed a substantial drawdown across key petroleum categories, adding more upside potential to the fundamental picture.

Commercial crude inventories (excl. SPR) fell by 5.8 million barrels, bringing total inventories down to 415.1 million barrels. Now sitting 11% below the five-year seasonal norm and placed in the lowest 2015-2022 range (see picture below).
Product inventories also tightened further last week. Gasoline inventories declined by 2.1 million barrels, with reductions seen in both finished gasoline and blending components. Current gasoline levels are about 3% below the five-year average for this time of year.
Among products, the most notable move came in diesel, where inventories dropped by almost 4.1 million barrels, deepening the deficit to around 20% below seasonal norms – continuing to underscore the persistent supply tightness in diesel markets.
The only area of inventory growth was in propane/propylene, which posted a significant 5.1-million-barrel build and now stands 9% above the five-year average.
Total commercial petroleum inventories (crude plus refined products) declined by 4.2 million barrels on the week, reinforcing the overall tightening of US crude and products.


A classic case of “buy the rumor, sell the news” played out in oil markets, as Brent crude has dropped sharply – down nearly USD 10 per barrel since yesterday evening – following Iran’s retaliatory strike on a U.S. air base in Qatar. The immediate reaction was: “That was it?” The strike followed a carefully calibrated, non-escalatory playbook, avoiding direct threats to energy infrastructure or disruption of shipping through the Strait of Hormuz – thus calming worst-case fears.
After Monday morning’s sharp spike to USD 81.4 per barrel, triggered by the U.S. bombing of Iranian nuclear facilities, oil prices drifted sideways in anticipation of a potential Iranian response. That response came with advance warning and caused limited physical damage. Early this morning, both the U.S. President and Iranian state media announced a ceasefire, effectively placing a lid on the immediate conflict risk – at least for now.
As a result, Brent crude has now fallen by a total of USD 12 from Monday’s peak, currently trading around USD 69 per barrel.
Looking beyond geopolitics, the market will now shift its focus to the upcoming OPEC+ meeting in early July. Saudi Arabia’s decision to increase output earlier this year – despite falling prices – has drawn renewed attention considering recent developments. Some suggest this was a response to U.S. pressure to offset potential Iranian supply losses.
However, consensus is that the move was driven more by internal OPEC+ dynamics. After years of curbing production to support prices, Riyadh had grown frustrated with quota-busting by several members (notably Kazakhstan). With Saudi Arabia cutting up to 2 million barrels per day – roughly 2% of global supply – returns were diminishing, and the risk of losing market share was rising. The production increase is widely seen as an effort to reassert leadership and restore discipline within the group.
That said, the FT recently stated that, the Saudis remain wary of past missteps. In 2018, Riyadh ramped up output at Trump’s request ahead of Iran sanctions, only to see prices collapse when the U.S. granted broad waivers – triggering oversupply. Officials have reportedly made it clear they don’t intend to repeat that mistake.
The recent visit by President Trump to Saudi Arabia, which included agreements on AI, defense, and nuclear cooperation, suggests a broader strategic alignment. This has fueled speculation about a quiet “pump-for-politics” deal behind recent production moves.
Looking ahead, oil prices have now retraced the entire rally sparked by the June 13 Israel–Iran escalation. This retreat provides more political and policy space for both the U.S. and Saudi Arabia. Specifically, it makes it easier for Riyadh to scale back its three recent production hikes of 411,000 barrels each, potentially returning to more moderate increases of 137,000 barrels for August and September.
In short: with no major loss of Iranian supply to the market, OPEC+ – led by Saudi Arabia – no longer needs to compensate for a disruption that hasn’t materialized, especially not to please the U.S. at the cost of its own market strategy. As the Saudis themselves have signaled, they are unlikely to repeat previous mistakes.
Conclusion: With Brent now in the high USD 60s, buying oil looks fundamentally justified. The geopolitical premium has deflated, but tensions between Israel and Iran remain unresolved – and the risk of missteps and renewed escalation still lingers. In fact, even this morning, reports have emerged of renewed missile fire despite the declared “truce.” The path forward may be calmer – but it is far from stable.
Analys
A muted price reaction. Market looks relaxed, but it is still on edge waiting for what Iran will do
Brent crossed the 80-line this morning but quickly fell back assigning limited probability for Iran choosing to close the Strait of Hormuz. Brent traded in a range of USD 70.56 – 79.04/b last week as the market fluctuated between ”Iran wants a deal” and ”US is about to attack Iran”. At the end of the week though, Donald Trump managed to convince markets (and probably also Iran) that he would make a decision within two weeks. I.e. no imminent attack. Previously when when he has talked about ”making a decision within two weeks” he has often ended up doing nothing in the end. The oil market relaxed as a result and the week ended at USD 77.01/b which is just USD 6/b above the year to date average of USD 71/b.

Brent jumped to USD 81.4/b this morning, the highest since mid-January, but then quickly fell back to a current price of USD 78.2/b which is only up 1.5% versus the close on Friday. As such the market is pricing a fairly low probability that Iran will actually close the Strait of Hormuz. Probably because it will hurt Iranian oil exports as well as the global oil market.
It was however all smoke and mirrors. Deception. The US attacked Iran on Saturday. The attack involved 125 warplanes, submarines and surface warships and 14 bunker buster bombs were dropped on Iranian nuclear sites including Fordow, Natanz and Isfahan. In response the Iranian Parliament voted in support of closing the Strait of Hormuz where some 17 mb of crude and products is transported to the global market every day plus significant volumes of LNG. This is however merely an advise to the Supreme leader Ayatollah Ali Khamenei and the Supreme National Security Council which sits with the final and actual decision.
No supply of oil is lost yet. It is about the risk of Iran closing the Strait of Hormuz or not. So far not a single drop of oil supply has been lost to the global market. The price at the moment is all about the assessed risk of loss of supply. Will Iran choose to choke of the Strait of Hormuz or not? That is the big question. It would be painful for US consumers, for Donald Trump’s voter base, for the global economy but also for Iran and its population which relies on oil exports and income from selling oil out of that Strait as well. As such it is not a no-brainer choice for Iran to close the Strait for oil exports. And looking at the il price this morning it is clear that the oil market doesn’t assign a very high probability of it happening. It is however probably well within the capability of Iran to close the Strait off with rockets, mines, air-drones and possibly sea-drones. Just look at how Ukraine has been able to control and damage the Russian Black Sea fleet.
What to do about the highly enriched uranium which has gone missing? While the US and Israel can celebrate their destruction of Iranian nuclear facilities they are also scratching their heads over what to do with the lost Iranian nuclear material. Iran had 408 kg of highly enriched uranium (IAEA). Almost weapons grade. Enough for some 10 nuclear warheads. It seems to have been transported out of Fordow before the attack this weekend.
The market is still on edge. USD 80-something/b seems sensible while we wait. The oil market reaction to this weekend’s events is very muted so far. The market is still on edge awaiting what Iran will do. Because Iran will do something. But what and when? An oil price of 80-something seems like a sensible level until something do happen.


Sommarvädret styr elpriset i Sverige

Samtal om flera delar av råvarumarknaden
Tightening fundamentals – bullish inventories from DOE

Jonas Lindvall är tillbaka med ett nytt oljebolag, Perthro, som ska börsnoteras

Oljan, guldet och marknadens oroande tystnad

Stor uppsida i Lappland Guldprospekterings aktie enligt analys

Brookfield ska bygga ett AI-datacenter på hela 750 MW i Strängnäs
Silverpriset släpar efter guldets utveckling, har mer uppsida

Tradingfirman XTX Markets bygger datacenter i finska Kajana för 1 miljard euro

Uppgången i oljepriset planade ut under helgen
-
 Nyheter3 veckor sedan
Stor uppsida i Lappland Guldprospekterings aktie enligt analys
-
 Nyheter4 veckor sedan
Brookfield ska bygga ett AI-datacenter på hela 750 MW i Strängnäs
-
 Nyheter3 veckor sedan
Silverpriset släpar efter guldets utveckling, har mer uppsida
-
 Nyheter4 veckor sedan
Tradingfirman XTX Markets bygger datacenter i finska Kajana för 1 miljard euro
-
 Nyheter2 veckor sedan
Uppgången i oljepriset planade ut under helgen
-

 Nyheter2 veckor sedan
Låga elpriser i sommar – men mellersta Sverige får en ökning
-
Analys2 veckor sedan
Very relaxed at USD 75/b. Risk barometer will likely fluctuate to higher levels with Brent into the 80ies or higher coming 2-3 weeks
-

 Nyheter1 vecka sedan
Mahvie Minerals växlar spår – satsar fullt ut på guld