

Analys
SEB Jordbruksprodukter, 10 februari 2014


 Det amerikanska jordbruksdepartementet USDA publicerar sin WASDE-rapport på måndag klockan 18. Handlare och analytiker som tillfrågats av Bloomberg förväntar sig en nedjustering av globala utgående lager för vete och majs.
För första gången sedan slutet av december förväntar sig en majoritet av de tillfrågade handlarna och analytikerna att priset på majs och vete går upp nästa vecka. Vad gäller majs är de på den mest positiva sidan sedan augusti förra året. Beträffande soja tror de på prisuppgång för första gången på tre veckor.
Februari-WASDE brukar inte vara någon stor händelse, men i den stiltje som marknaden befinner sig i, kan den möjligtvis ge styrfart åt något håll – uppåt eller nedåt.
Odlingsväder
Viktigast just nu är den torka som drabbat Brasilien. Efter den torraste perioden sedan 1954 i Minas Gerais, väntas nu regn om ca en vecka. Södra Brasilien och norra Argentina har fått mer än normal nederbörd, eftersom lågtrycket stannat där, blockerat av högtrycket över centrala och östra Brasilien. Torkan påverkar även betet. Landet är som bekant en stor kött- och mjölkproducent och när betet tryter blir konsumtionen av spannmål högre.
Kina, som varit torrt, väntas få betydligt mer nederbörd än det normala de kommande två veckorna enligt GFS-modellen.
Europa väntas få väsentligt mycket mer nederbörd än normalt, utom i södra Italien och längs Norges kust.
USA, som varit kallt och torrt, kommer att få ordentligt med nederbörd de kommande två veckorna, men något mindre än normalt i Texas och angränsande delstater.
Vete
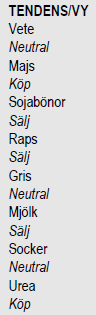
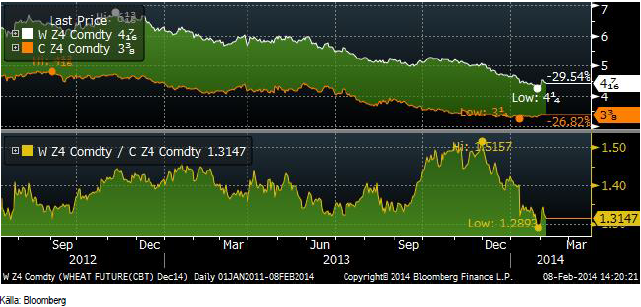
Matifs novemberkontrakt gick inte genom 180 euro per ton. I fredags stängde marknaden på 185 euro, som är den övre delen av det smala prisintervall om 5 euro som marknaden handlat inom den senaste månaden.
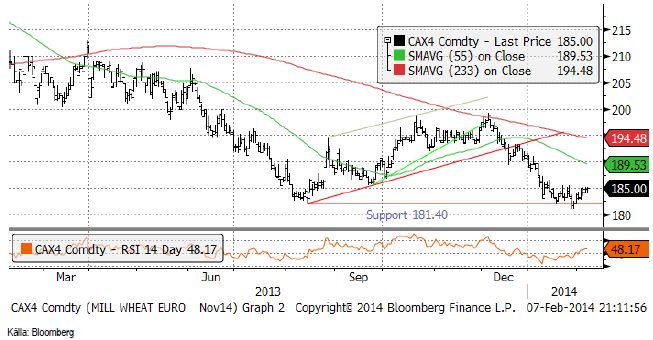
Nedanför ser vi Chicagovetet (Dec 14), som stängde fredagen på 598.50 cent / bushel – under den psykologiskt viktiga nivån 600 cent.
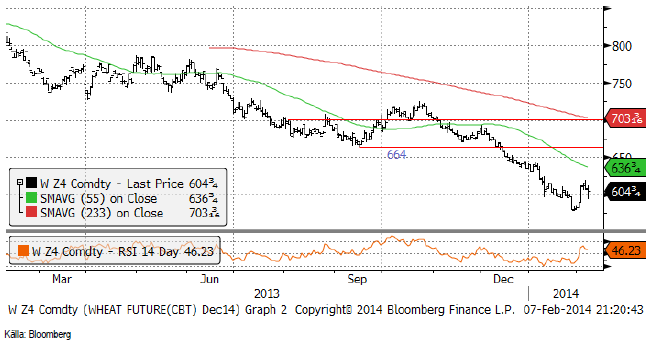
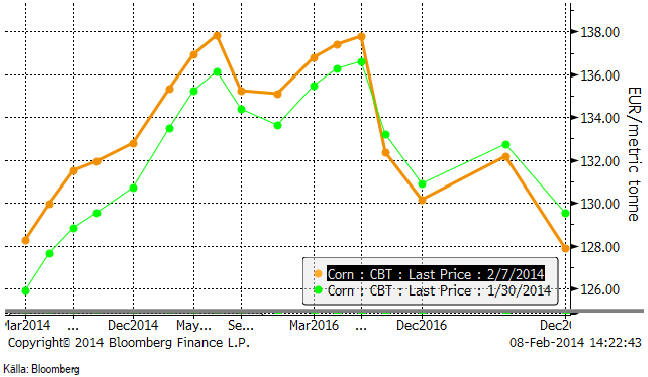
Nedan ser vi terminskurvorna för Chicagovete och Matif, båda uttryckta i euro per ton. Exportframgångarna för Rouen bidrar till att kurvan gått mer in i backwardation. I Chicago, där terminsmarknaden vanligtvis är i contango, har kurvan flackat, i synnerhet för gammal skörd.
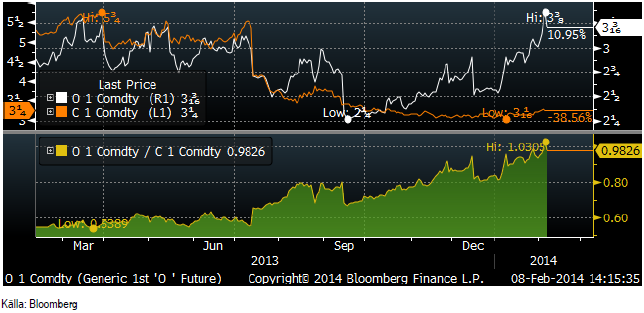
Vetekontrakten för decemberleverans i Chicago har blivit billigare än någonsin tidigare i förhållande till majs. Tidigare har vi sett spotpriset på majs ligga över majspriset, men inte i kontrakten för ny skörd. Vete ser alltså ”billigt” ut i förhållande till majs nu.
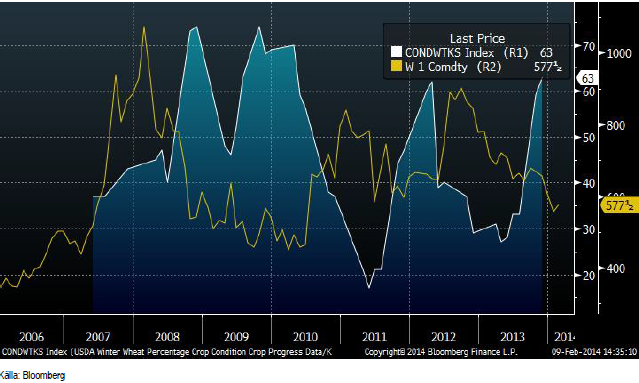
Crop condition som NASS i några delstater publicerade i måndags den 3 februari var en chock för marknaden. I Kansas är 3% av höstvetet ”very poor”, 17% ”poor”, 45% ”fair”, 33% ”good” och 2% ”excellent”. När höstvetet gick in i vintervilan vid den sista crop condition-rapporten den 22 november var 63% i good/excellen condition. Nu är det alltså 35%, dvs 28%-enheter lägre.
Situationen påminner lite om vintern 2009/2010, när vetet gick in i vintervilan på 69% good/excellent. Priset på vete var naturligtvis lågt. När sedan crop condition föll under 2010, kunde priset stiga från en låg nivå under haussartade former senare på hösten. Nedan ser vi historiken på crop condition i Kansas och priset på spotkontraktet (W1) i Chicago.
Crop condition sjönk i fler delstater: Texas 19% good/excellent (-13%) och Oklahoma 36% (-40%). Det är något för torrt i marken skriver NASS i sina kommentarer.
Stats Canada som kom i mitten av veckan visade på lager på 28.3 mt, väsentligt högre än förra årets 20.5 mt, men i linje med förväntningarna. Den varslade tågstrejken i Kanada ställdes in på order av regeringen.
FAO meddelade så sent som den 28 januari att Iran kommer att importera 10.7 mt spannmål i år, ner från 14.2 mt förra året, men landet verkar importera mer än så. Importbehovet av vete anges av FAO till 4 mt. I veckan köpte landet 0.5 mt från EU och Ryssland. I veckan anklagades också regeringen i Iran för att ha skickat falska uppgifter till FAO.
Marknaden förväntar sig att USDA ska lämna carry-out stocks i USA oförändrade på 608 mbu i måndagens rapport, enligt en sammanställning gjord av Bloomberg. Men man förväntar sig en sänkning av lagren av majs och en stark majsmarknad kan dra vetepriset högre.
Det mest sannolika är att priset på vete går ner, men ”risk/reward” är helt klart på uppsidan, så vi väljer att gå ur korta positioner på vete. Än så länge stannar vi med neutral rekommendation.
Maltkorn
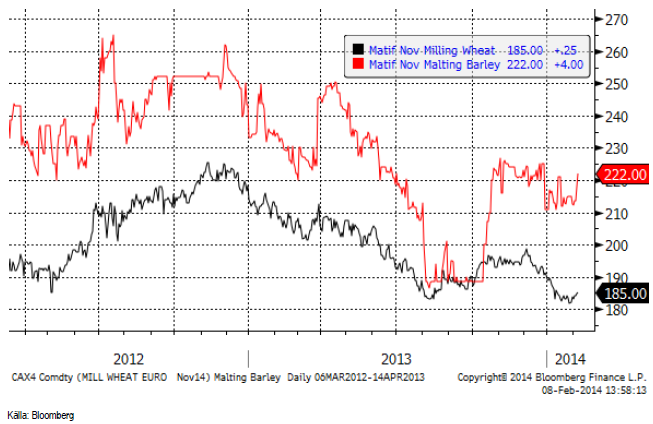
November 2014 – kontraktet på maltkorn håller sig stabilt när vetet visar svaghet. Som vi skrev i höstas, är maltkorn förmodligen en gröda som bör betala sig bra i år. Dessutom är det fotbolls-VM i sommar och kan öka efterfrågan på maltkorn. I veckan handlades terminerna för novemberleverans upp till 222 euro per ton och vidgade därmed premien till kvarvetekontrakten på Matif.
Majs
Majsmarknaden ser ut att vara på väg att ha avslutat sin fallande pristrend och börja vända upp. Vi rekommenderar köp av majs nu, från tidigare neutral vy.
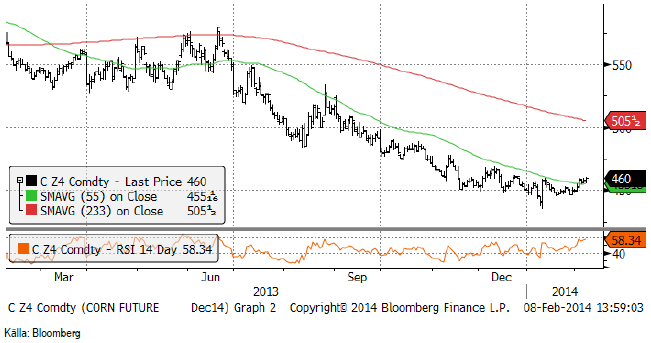
Det är framförallt de kortare terminskontrakten som gått upp, medan de riktigt långa gått ner.
Terminerna på havre gick i veckan över priset på majs. Det här gäller för spotkontrakten och orsakades i veckan som gick framförallt av den befarade tågstrejken i Kanada, som dock inte blev av. Decemberkontraktet på havre handlas alltjämt till 60% av priset för majs, så det här handlar om en bristsituation just nu. Det är möjligtvis ett bra tillfälle att sälja havre till USA nu.
Det är väldigt torrt i östra Brasilien, främst i delstaterna Minas Gerais och Espirito Santo, men som vi skrivit är det torrt även i Goias, Sao Paulo och upp mot Mato Grosso. Medan detta är bra för skörden av sojabönor, är det mindre bra för den andra skörden, som till stor del utgörs av majs. Vi tror att många kommer att försöka odla soja (igen). Torrt väder är inte bra för någon av grödorna.
Terminerna i USA på etanol nådde sin högsta nivå på sju månader i veckan.
Exporten från USA är liksom för soja, högre än normalt. 91% av den volym USDA har estimerat för export i år är redan såld, efter veckans stora export på 1.7 mt.
Marknaden förväntar sig att USDA ska sänka carry-out stocks i USA från 1631 mbu till 1616 mbu i måndagens rapport, enligt en sammanställning gjord av Bloomberg.
Vi går alltså över till köprekommendation på majs.
Sojabönor
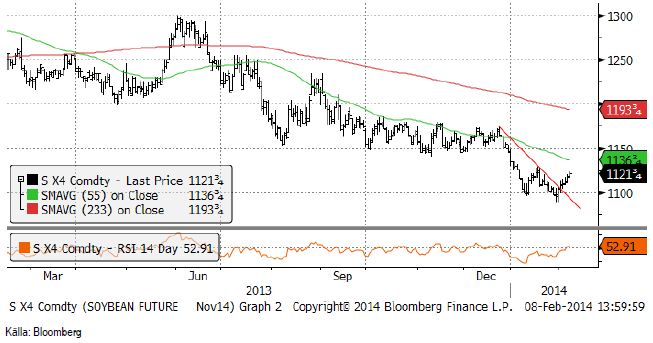
Sojabönorna steg över ett tekniskt motstånd i veckan som gick och stängde 21 cent över stödnivån på 1100 cent per bushel.
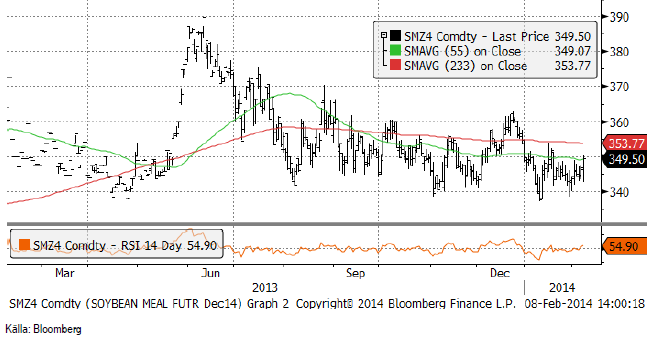
Sojamjölet håller sig kvar i intervallet 340 – 360 dollar per short ton.
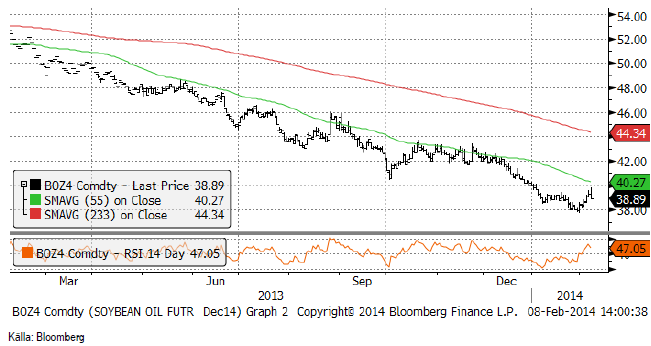
Sojaoljan gick inte under 38 dollar och har sedan vänt upp med stöd av prisutvecklingen på palmoljan i Malaysia.
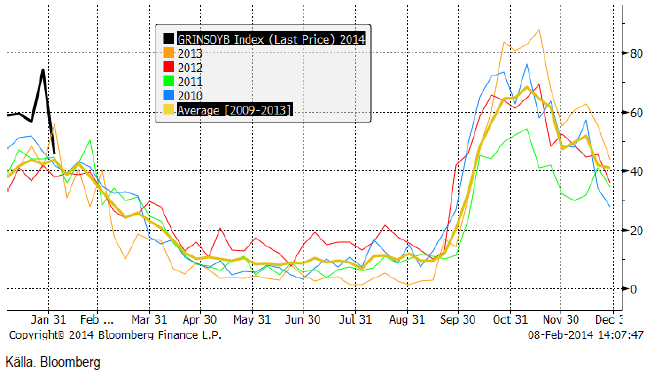
Exportstatistiken fortsätter att vara starkare än normalt, även om det uppenbarligen börjar ta slut på sojabönor i USA:s lager. Brasiliens skörd är till 10% klar och de första lasterna gick iväg från hamnarna för nästan två veckor sedan.
Situationen i Argentina är präglad av regeringens panik att få in skatteinskomster. De exportföretag som inte exporterar hotades med nationalisering i veckan som gick. Staten kräver att lantbrukarna ska sälja, men dessa håller naturligtvis emot så gott de kan.
Marknaden förväntar sig att USDA ska sänka carry-out stocks i USA från 150 mbu till 145 mbu i måndagens rapport, enligt en sammanställning gjord av Bloomberg.
Raps
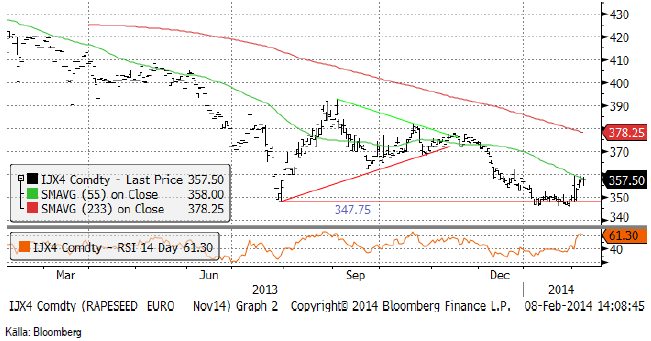
November 2014-kontraktet på raps följde sojabönorna upp i veckan som gick. Rapskaka har som bekant blivit ett viktigt alternativ i foderblandningarna i EU till sojabönor. Vi tycker dock alltjämt att rapspriset för ny skörd borde vara väsentligt lägre och tycker att den här prisuppgången ger ett utmärkt tillfälle att sälja terminer för ny skörd.
Marknaden blev mycket oroad av strejkvarslet från järnvägsanställda i Kanada. I onsdags nåddes dock marknaden av att strejken var avblåst. Den kanadensiska regeringen förbjöd dem att strejka, eftersom detta skulle ha skadat landets export av jordbruksprodukter och andra råvaror.
Terminskontrakten på Canola i Winnipeg har fortsatt att falla fritt, även sedan förra veckan. Statistics Canadas lagerstatistik visade på lager på 12.6 mt, 56% mer än förra året. Skillnaden mellan canola-kontraktet för novemberleverans och matifs på rapsfrö, har ökat från 12.7% för två veckor sedan till 16.7%. Det innebär att rapsfrökontraktet är minst 12- 14% för dyrt i förhållande till den tidigare etablerade relationen.
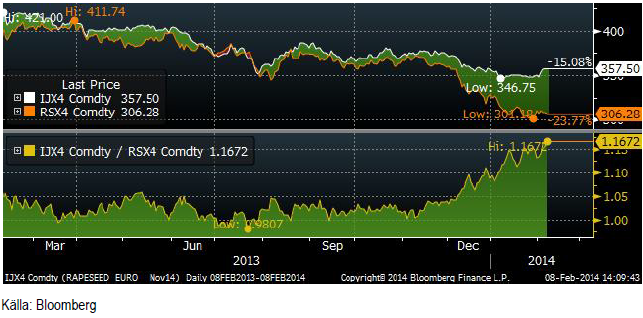
I diagrammet nedan ser vi hur spotkontrakten handlat mot varandra de senaste fem åren. Rapsfröet är helt enkelt onormalt dyrt just nu.
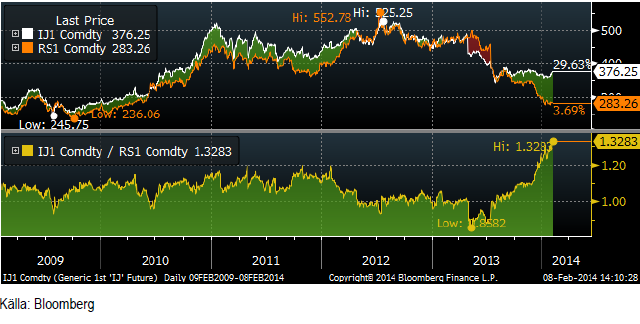
Vi fortsätter med säljrekommendation och upprepar den!
Potatis
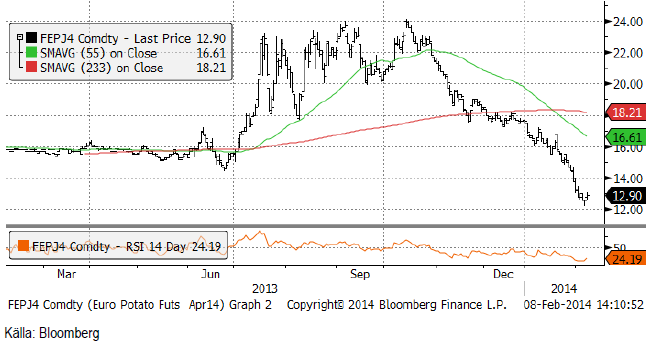
När potatispriset i januari nådde ner till den prisnivå som etablerats under förra året på 16 euro per 100 Kg, och utbudet sedan fortsatte att överträffa efterfrågan, föll priset ner till 12 euro som lägst i veckan som gick. Potatis har varit en av de allra mest volatila jordbruksprodukterna det senaste året. Märkligt nog är det också en av de som prissäkras minst. Korrelationen mellan noteringen på Eurex, som i stor utsträckning är detsamma som priset i Holland, är låg till de olika svenska priserna, men inte på årsbasis. Är det i norra Kontinentaleuropa är det i regel torrt i Sverige och vice versa. Det innebär att priserna i stort sett rör sig åt samma håll.
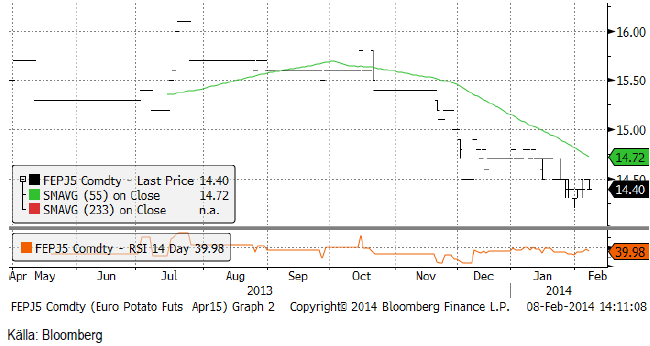
Kontraktet för den kommande skörden börjar nu handlas allt mer. Nedan ser vi kurdiagrammet för april 2015-kontraktet. 14.40 euro per 100 Kg är väsentligt lägre än de 16 euro som priset började på. Marknaden kan se illikvid ut, men vi har inga problem att finna köpare av terminskontrakt på potatis för april 2015 och även för april 2016 – om det finns någon potatisodlare som vill bli av med den osäkerhet om priset som marknaden har.
Gris
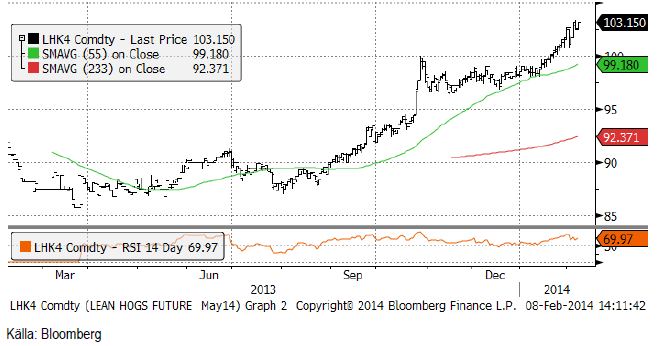
Lean hogs maj-kontrakt har fortsatt att stiga och priset ligger nu över 100 cent per pund. Trenden är tydligt uppåtriktad, vilket innebär att det är mer sannolikt att priset fortsätter upp, än att det vänder ner.
Rysslands importstopp från EU, föranlett av ett sjukt vildsvin i Litauen (förmodligen smittat från Ryssland, som har sjukdomen), har fått priserna på griskött i EU att rasa. Eftersom sjukdomen finns i Ryssland och endast hos vildsvin vid Litauens östgräns är det rimligt att tro att detta är ett svepskäl från Rysslands sida. Ryssland har i flera år haft en vilja att minska importberoendet och bygga upp en egen grisnäring, baserad på den spannmål som produceras i allt större volymer. Utrotandet av sjukdomen hos vildsvin i EU kommer inte att ta bort det faktum att EU måste anpassa sig till en situation utan export till Ryssland. Ändå verkar det vara en överutbudssituation just nu. Spotkontraktet på Eurex handlas på motsvarande 13 kr per kilo. Marknaden är i kraftigt conango, nästan 50% omräknat till årsbasis. Juli-kontraktet handlas på över 15 kr per kilo. Den som är orolig för att även dessa priser ska falla kan naturligtvis prissäkra genom att sälja terminskontrakt på den väntade produktionen i juli (och övriga månader).
Mjölk
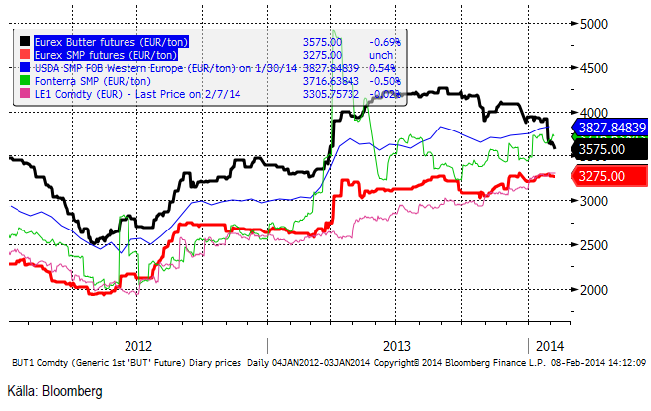
Prisfallet på smör har fortsatt på Eurex. SMP håller fortfarande emot. Eftersom priset på smör faller, innebär det att priset på mjölkråvara faller. Vi har sett priset på smör backa sedan månadsskiftet oktober / november förra året, försiktigt i början men nu med en tydligt fallande pristrend. SMP har fortsatt att stiga, men hittills i år har vi inte längre noterat någon prisuppgång på Eurexmarknaden. Fonterra har däremot utvecklats positivt.
Nedan ser vi prisutvecklingen på Eurex smör och pulver (de feta linjerna), samt på USDA:s notering av SMP (FOB Västeuropa), Chicagopriset i euro per ton och Fonterras pris; Fonterra faktiskt lite lägre den här veckan.
LTO Nederland rapporterade i fredags att mjölkpriset i EU föll med 1.6% i december från rekodnivån i november. På sin hemsida skriver de att priset i december var 40.55 euro per 100 Kg i november och det föll till 39.89 euro i december. De skriver också att den ökande produktionen av mjölk i de viktigaste producentländerna i världen är ett hot mot prisnivån och har gjort marknaden mer sårbar. Skriver att prispressen kan intensifieras tidigare än vanligt, kanske redan till slutet av det första kvartalet i år.
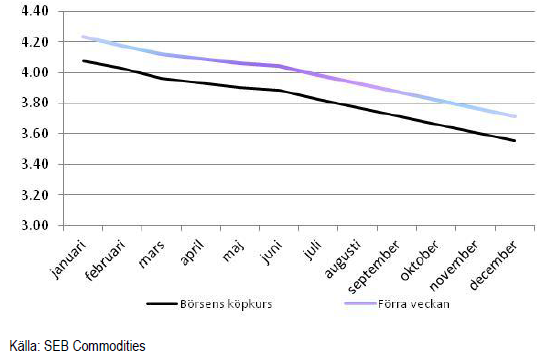
Nedan ser vi terminspriserna man får i svenska kronor från terminspriserna på SMP och smör på Eurex, omräknat till kronor per kilo mjölkråvara. Notera att hela den här prisnivån alltid ska ligga över avräkningspriset på mjölkråvara med ca 50 öre, som är en uppskattning av kostnaden för att förädla mjölkråvara till SMP och smör.
Som vi redan sett har terminspriserna fallit. Det är möjligt att detta är inledningen på det prisfall som har befarats.
Socker
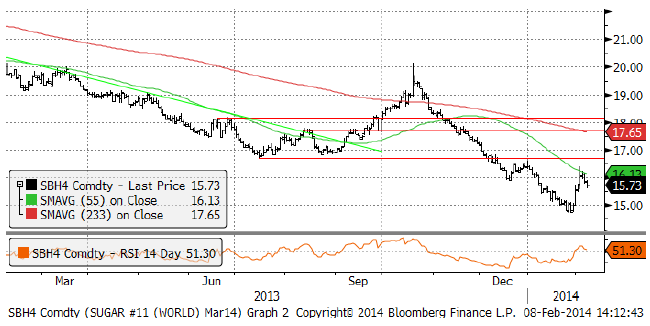
Marskontraktet på råsocker rekylerade upp kraftigt efter att informationen om torka i Brasilien sjönk in hos marknadsaktörerna. Torkan har dock inte drabbat de områden där sockerrör odlas lika hårt som områden där kaffe odlas.
Ecom Industrial Group sade dock i söndags (9 feb) att torkan kan innebära att Brasiliens produktion av socker blir 5% lägre än under 2013. Uttalandet gjordes på Kingsmans konferens i Dubai, som pågår till tisdag.
Kingsman själva som publicerade sin första rapport för året 2014/15, sade att detta blir det femte året med överskott i utbuds / efterfrågebalansen för socker. Global produktion förutspås stiga till 181 mt från 177.7 mt. Konsumtionen väntas öka med 2% till 178.96 mt. Skillnaden är drygt 2 mt, som alltså läggs till lagren. Orsaken till produktionsökningen anser Kingsman är att olika statliga stöd förhindrar prissignalen (lågt pris) att påverka produktionen. Svagare valutor i länder som producerar socker, t ex Brasilien, vars valuta fallit med 13% mot dollarn det senaste året, gör också att prisfallet inte upplevs på samma sätt av producenterna.
I fredags sammanträdde kabinettet i den indiska regeringen för att diskutera höjningen av exportbidraget för socker till motsvarande 56 USD / ton. Det är en höjning med 75%. Syftet är att exporten ska uppgå till 4 miljoner ton över de kommande två åren. Man hoppas att priset därmed ska bli högre inom landet.
Brasiliens UNICA svarade i fredags att alla former av exportbidrag är ett brott mot WTO-reglerna. UNICA menar att Indiens olagliga exportstöd tvingar producenter i Thailand, Australien, Colombia, Guatemala och Brasilien att minska sin produktion.
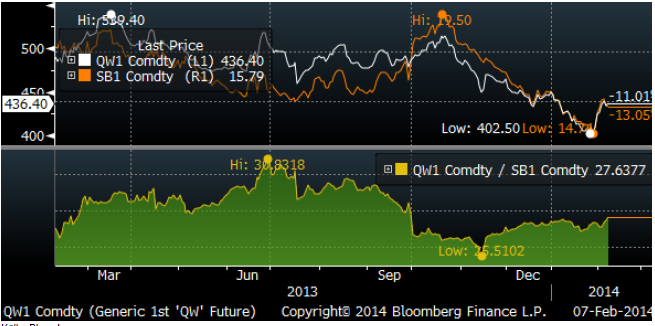
Brasilianskt råsocker har nästan alltid handlats till ett premium över terminsnoteringen på NYBOT i New York. Sedan oktober har priset emellertid legat under, vilket delvis hänger ihop med att skörden tas in under hösten.
När vi ser att kvoten mellan terminskontraktet för raffinerat vitt socker och råsocker minskade i början på oktober, måste vi också betänka att då började brasilianskt råsocker att handla under prisnoteringen på börsen. Nedan ser vi en bild på kvoten mellan priset på vitt socker (i dollar / ton) och priset på råsocker (i cent / pund).
Torkan i Brasilien är den enda faktor som är bulllish för socker. Men det är inte torrast där sockerrör odlas. Vi är hellre köpta kaffe än socker av den anledningen.
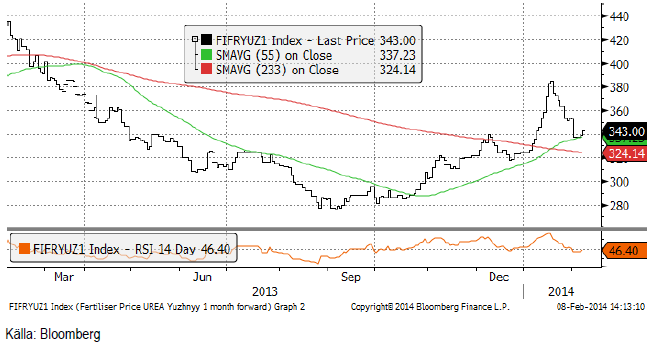
Gödsel
Urean sjönk tillbaka, men är alltjämt i stigande trend.
[box]SEB Veckobrev Jordbruksprodukter är producerat av SEB Commodities Sales desk och publiceras i samarbete och med tillstånd på Råvarumarknaden.se[/box]
Detta marknadsföringsmaterial, framtaget av SEB’s Commodities Sales desk, har upprättats enbart i informationssyfte.
Även om innehållet är baserat på källor som SEB bedömt som tillförlitliga ansvarar SEB inte för fel eller brister i informationen. Den utgör inte oberoende, objektiv investeringsanalys och skyddas därför inte av de bestämmelser som SEB har infört för att förebygga potentiella intressekonflikter. Yttranden från SEB’s Commodities Sales desk kan vara oförenliga med tidigare publicerat material från SEB, då den senare hänvisas uppmanas du att läsa den fullständiga rapporten innan någon åtgärd vidtas.
Dokumentationen utgör inte någon investeringsrådgivning och tillhandahålls till dig utan hänsyn till dina investeringsmål. Du uppmanas att självständigt bedöma och komplettera uppgifterna i denna dokumentation och att basera dina investeringsbeslut på material som bedöms erforderligt. Alla framåtblickande uttalanden, åsikter och förväntningar är föremål för risker, osäkerheter och andra faktorer och kan orsaka att det faktiska resultatet avviker väsentligt från det förväntade. Historisk avkastning är ingen garanti för framtida resultat. Detta dokument utgör inte ett erbjudande att teckna några värdepapper eller andra finansiella instrument. SEB svarar inte för förlust eller skada – direkt eller indirekt, eller av vad slag det vara må – som kan uppkomma till följd av användandet av detta material eller dess innehåll.
Observera att det kan förekomma att SEB, dess ledamöter, dess anställda eller dess moder- och/eller dotterbolag vid olika tillfällen innehar, har innehaft eller kommer att inneha aktier, positioner, rådgivningsuppdrag i samband med corporate finance-transaktioner, investment- eller merchantbankinguppdrag och/eller lån i de bolag/finansiella instrument som nämns i materialet.
Materialet är avsett för mottagaren, all spridning, distribuering mångfaldigande eller annan användning av detta meddelande får inte ske utan SEB:s medgivande. Oaktat detta får SEB tillåta omfördelning av materialet till utvald tredje part i enlighet med gällande avtal. Materialet får inte spridas till fysiska eller juridiska personer som är medborgare eller har hemvist i ett land där sådan spridning är otillåten enligt tillämplig lag eller annan bestämmelse.
Skandinaviska Enskilda Banken AB (publ) är ett [publikt] aktiebolag och står under tillsyn av Finansinspektionen samt de lokala finansiella tillsynsmyndigheter i varje jurisdiktionen där SEB har filial eller dotterbolag.

Market is starting to take US/Iran headlines with a pinch of salt. Brent crude rose $2.8/b yesterday to an official close of $112.1/b. But after that it traded as low as $108.05/b before ending late night at around $109.7/b. Through the day it traded in a range of $106.87 – 112.72/b amid a flurry of news or rumors from Iran and the US. ”US temporary sanctions during negotiations” (falls alarm). ”We will bomb Iran” (not anyhow),… etc. While the market is still fluctuating to this kind of news flow, it is starting to take such headlines with a pinch of salt.

We’ll see. Maybe, maybe not. The Brent M1 contract is trading at $110.2/b this morning which very close to the average ticks through yesterday of $110.4/b.
Trump with bearish, verbal intervention whenever Brent trades above $110/b it seems. What seems to be a pattern is that Trump states something like ”very good negotiations going on with Iran”, ”New leaders in Iran are great,..”, ”Great progress in negotiations,…”, ”Deal in sight,..” etc whenever the Brent M1 contract trades above $110/b. An effort to cool the market. These hot air verbal interventions from Trump used to have a heavy bearish impact on prices, but they now seems to have less and less effect unless they are backed by reality.
As far as we can see there has been no real progress in the negotiations between the US and Iran with both sides still standing by their previous demands.
Iran is getting stronger while the cease fire lasts making a return to war for Trump yet harder. Iran is naturally in constant preparation for a return to war given Trump’s steady threats of bombing Iran again. Iran is naturally doing what ever is possible to prepare for a return to war. And every day the cease fire lasts it is better prepared. This naturally makes it more and more difficult and dangerous for the US to return to warring activity versus Iran as the consequences for energy infrastructure in the Persian Gulf will be more and more severe the longer the cease fire lasts. Israel seems to see it this way as well. That the war is not won and that current frozen state of a cease fire gives Iran opportunity to rebuild military and politically.
Global inventories are drawing down day by day. How much? In the meantime the Strait of Hormuz stays closed. There is varying measures and estimates of how much global inventories are drawing down. Our rough estimate, back of the envelope, is that global inventories are drawing down by at least some 10 mb/d or about 300 mb/d in a balance between loss of supply versus demand destruction. Other estimates we see are a monthly draw of 250-270 mb/d. The IEA only ’measured’ a draw in global observable stocks of 117 mb in April with oil on water rising 53 mb while on shore stocks fell 170 mb. But global stocks are hard to measure with large invisible, unmeasured stocks. As such a back of the envelope approach may be better.
Oil products is what the world is consuming. Oil product prices likely to rise while product stocks fall. Strategic Petroleum Reserves (SPR) are predominantly crude oil. Discharging oil from OECD SPR stocks, a sharp reduction in Chinese crude imports and a reduction in global refinery throughput of 6-7 mb/d has helped to keep crude oil markets satisfactorily supplied. But global inventories are drawing down none the less. And oil products is really what the world is consuming. So if global refinery throughput stays subdued, then demand will eventually have to match the supply of oil products. The likely path forward this summer is a steady draw down in jet fuel, diesel and gasoline. Higher prices for these. Then, if possible, higher refinery throughput and higher usage of crude in response to very profitable refinery margins. And lastly sharper draw in crude stocks and higher prices for these. But some 6 mb/d of oil products used to be exported through the Strait of Hormuz. And it may not be so easy to ramp up refinery activity across the world to compensate. Especially as Ukraine continues to damage Russian refineries as well as Russian crude production and export facilities.
Watch oil product stocks and prices as well as Brent calendar 2027. What to watch for this summer is thus oil product inventories falling and oil product premiums to crude rising. Another measure to watch is the Brent crude 2027 contract as it rises steadily day by day as the Strait of Hormuz stays closed and global oil inventories decline. The latter is close to the highest level since the start of the war and keeps rising.
The Brent M1 contract and the Brent 2027 prices and current price of jet fuel in Europe (ARA). All in USD/b

Our back of the envelope calculation of the global shortage created by the closure of the Strait of Hormuz. Note that 3.5 mb/d of discharge from SPR is also a draw. Note also that ’Forced demand loss’ of 2.5 mb/d is probably temporary and will fall back towards zero as logistics are sorted out leaving ’Price demand loss’ to do the job of balancing the market. Thus a shortfall of at least 9 mb/d created by the closure. More if SPR discharge is included and more if Forced demand loss recedes.

Brent is climbing higher. Front-month is at USD 106.3/bl this morning, close to a weekly high and a USD 9/bl jump from Mondays open. This is the move we flagged as a risk earlier in the week: the market shifting from ”a deal is around the corner” to ”this is going to take longer than we thought”.

Analyst Commodities, SEB
During April, rest-of-year Brent remained remarkably stable around USD 90/bl. A stability which rested on one single assumption: the SoH reopens around 1 May. That assumption is now slowly falling apart.
As we highlighted yesterday: every week of delay beyond 1 May adds (theoretically) ish USD 5/bl to the rest-of-year average, as global inventories draw 100 million barrels per week. i.e., a mid-May reopening implies rest-of-year Brent closer to USD 100/bl, and anything pushing into June or July takes us meaningfully higher.
What’s changed in the last 48 hours:
#1: The US military has formally warned that clearing suspected sea mines from SoH could take up to six months. That is a completely different timescale from what the financial market is pricing. Even a political deal tomorrow does not immediately reopen the strait.
#2: Trump has shifted his tone from urgency to ”strategic patience”. In yesterday’s press conference: ”Don’t rush me… I want a great deal.” The market is reading this as a president no longer feeling pressured by timelines, with the naval blockade running in the background.
#3: So far, the military activity is escalating, not de-escalating. Axios reports Iran is laying more mines in SoH. The US 3rd carrier strike group (USS George H.W. Bush) is arriving with two countermine vessels. Trump yesterday ordered the US Navy to destroy any Iranian boats caught laying mines. While CNN reports that the Pentagon is actively drawing up plans to strike Iranian SoH capabilities and individual Iranian military leaders if the ceasefire collapses. i.e., NOT a attitude consistent with an imminent deal!
Spot crude and product prices eased off the early-April highs on a combination of system rerouting and deal optimism. Both now weakening. Goldman estimates April Gulf output is reduced by 14.5 mbl/d, or 57% of pre-war supply, a number that keeps getting worse the longer this drags on.
Demand-side adaptation is ongoing: S. Korea has cut its Middle East crude dependence from 69% to 56% by pulling more from the Americas and Africa, and Japan is kicking off a second round of SPR releases from 1 May. But SPRs are finite.
Ref. to the negotiations, we should not bet on speed. The current Iranian leadership is dominated by genuine hardliners willing to absorb economic pain and run the clock to extract concessions. That is not a setup for a rapid resolution. US/Israeli media briefings keep framing the delay as ”internal Iranian divisions”, the reality is more complicated and points toward weeks and months, not days.
Our point is that the complexity is large, and higher prices have only just started (given a scenario where the negotiations drag out in time). The market spent April leaning on the USD 90/bl rest-of-year assumption; that case is diminishing by the hour. If ”early May reopening” is replaced by ”June, July or later” over the next week or two, both crude and products have meaningful room to reprice higher from here. There is a high risk being short energy and betting on any immediate political resolution(!).
Down on Friday. Up on Monday. The Brent June crude oil contract traded down 5.1% last week to a close of $90.38/b. It reached a high of $103.87/b last Monday and a low of $86.09/b on Friday as Iran announced that the Strait of Hormuz was fully open for transit. That quickly changed over the weekend as the US upheld its blockade of Iranian oil exports while Iran naturally responded by closing the SoH again. The US blew a hole in the engine room of the Iranian ship TOUSKA and took custody of the ship on Sunday. Brent crude is up 5.6% this morning to $95.4/b.
The cease-fire is expiring tomorrow. The US has said it will send a delegation for a second round of negotiations in Islamabad in Pakistan. But Iran has for now rejected a second round of talks as it views US demands as unrealistic and excessive while the US is also blocking the Strait of Hormuz.
While Brent is up 5% this morning, the financial market is still very optimistic that progress will be made. That talks will continue and that the SoH will fully open by the start of May which is consistent with a rest-of-year average Brent crude oil price of around $90/b with the market now trading that balance at around $88/b.
Financial optimism vs. physical deterioration. We have a divergence where the financial market is trading negotiations, improvements and resolution while at the same time the physical market is deteriorating day by day. Physical oil flows remain constrained by disrupted flows, longer voyage times and elevated freight and insurance costs.
Financial markets are betting that a US/Iranian resolution will save us in time from violent shortages down the road. But every day that the SoH remains closed is bringing us closer to a potentially very painful point of shortages and much higher prices.
The US blockade is also a weapon of leverage against its European and Asian allies. When Iran closed the SoH it held the world economy as a hostage against the US. The US blockade of the SoH is of course blocking Iranian oil exports. But it is also an action of disruption directed towards Europe and Asia. The US has called for the rest of the world to engaged in the war with Iran: ”If you want oil from the Persian Gulf, then go and get it”. A risk is that the US plays brinkmanship with the global oil market directed towards its European and Asian allies and maybe even towards China to force them to engage and take part. Maybe unthinkable. But unthinkable has become the norm with Trump in the White House.


Sommarväder skapar prisrally på elbörsen
Oil product price pain is set to rise as the Strait of Hormuz stays closed into summer

Solkraften pressar elpriserna dagtid

Michel Gubel ger sin syn på oljemarknaden