Analys
SEB Jordbruksprodukter, 10 december 2012
 Veteterminerna oavsett löptid och sida av Atlanten har inte rört sig ens en procent i veckan som gick. Majsen är ett par procent billigare och sojan är ett par procent dyrare. Rapspriset förändrades dock inte. SMP fortsätter att sjunka och smöret att bli dyrare, vilket innebär att kombinationen av dem (mjölk) är oförändrat sedan förra veckan. Klass III mjölk i USA har dock fortsatt att falla i pris. SEB fortsätter, att som första bank i världen, erbjuda sina kunder att prissäkra ett börsbaserat mjölkpris i kronor per kilo, i poster om 10,000 kg.
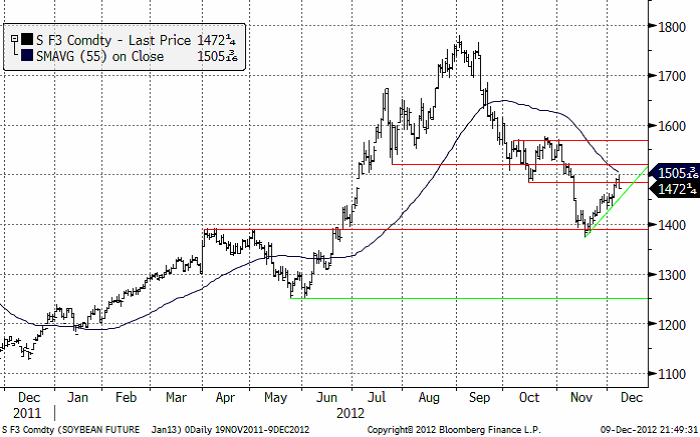
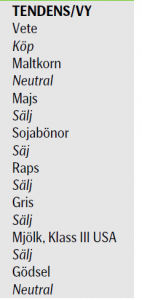 Vi förnyar vår säljrekommendation på sojabönor. Marknadsutvecklingen ser riktigt svag ut.
Odlingsväder
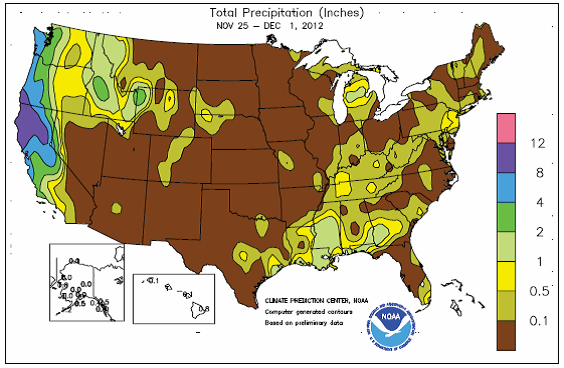
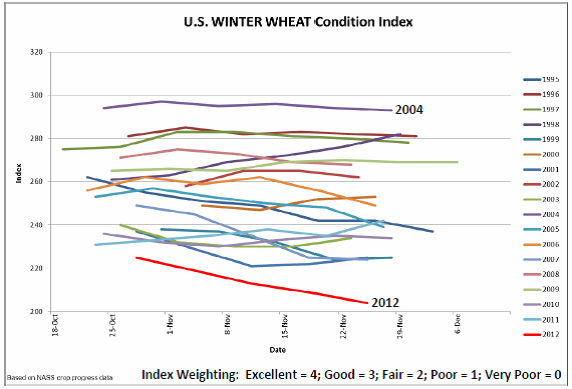
Det fortsätter att vara torrt i USA och det påverkar inte bara de allt lägre förväntningarna på höstvetet inför våren, utan också möjligheten att transportera bort skördat vete och majs. Norra delarna av Mississippi-floden är inte längre farbar pga för lågt vattenstånd. Det rapporteras att silos är nästan fulla och att lantbrukarna får lov att skeppa majs via tåg till Texas, vilket är väldigt dyrt. Detta innebär att USA kan få svårt att exportera under vintern i den takt som varit vanligt. Det innebär också att lagerhyrorna stiger, vilket allt annat lika bör öka contangot i terminsmarknaderna för majs och vete framförallt i USA.
Den andra väderavvikelsen är det myckna regnandet i norra Argentina, som gjort att det har varit omöjligt på sina håll att så.
FAO
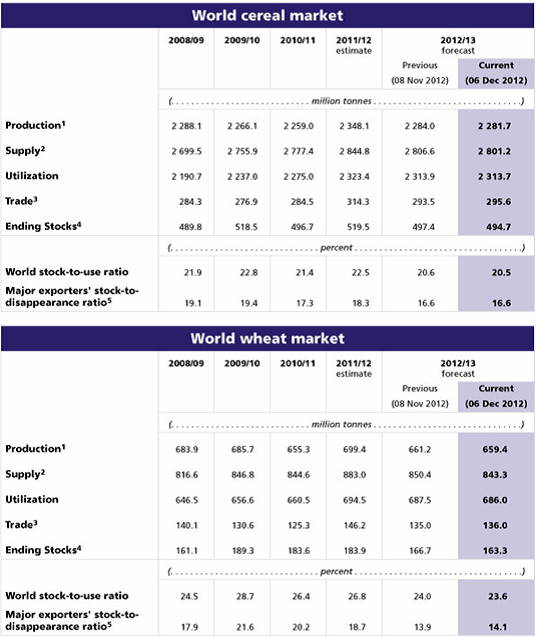
FAO’s senaste prognos över den globala spannmålsproduktionen under 2012 har reviderats ner marginellt med 2 mt till 2,282 mt sedan förra månadens rapport. Revideringen beror främst på justeringar av den beräknade produktionen av majs i Ryssland och Ukraina, efter att skördarna där nu går mot sitt slut, samt minskad produktion av vete i Australien och Brasilien där skörden nu pågår. Tidiga indikationer för höstvetet, som nu har såtts på det norra halvklotet, är blandade och något mindre lovande än för en månad sedan. Den senaste informationen tyder på att lantbrukare i allmänhet har ökat sådden av höstvete i respons till höga priser. Väderförhållandena är dock fortfarande negativa, med torka i delar av USA och Ryssland, medan stora producerande delar av EU har haft alltför mycket väta som har hindrat fältarbete.
Vete
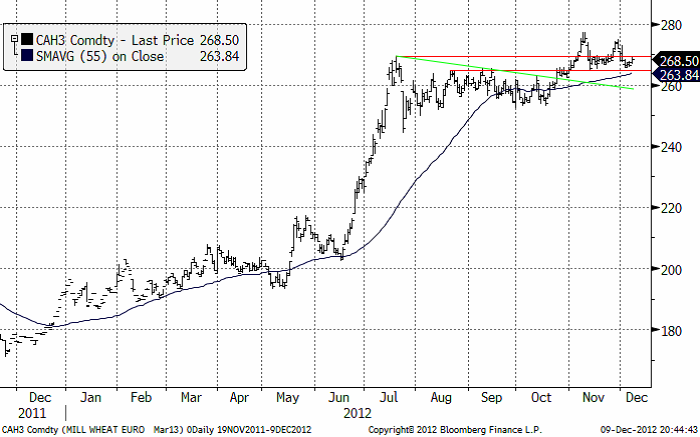
Nedan ser vi kursdiagrammet för marskontraktet på Matif. Priset har fortsatt sidledes under veckan. Det är inte någon vidare styrka i marknaden. Om priset inte vill gå upp, kanske det snart är dags att testa nedsidan.
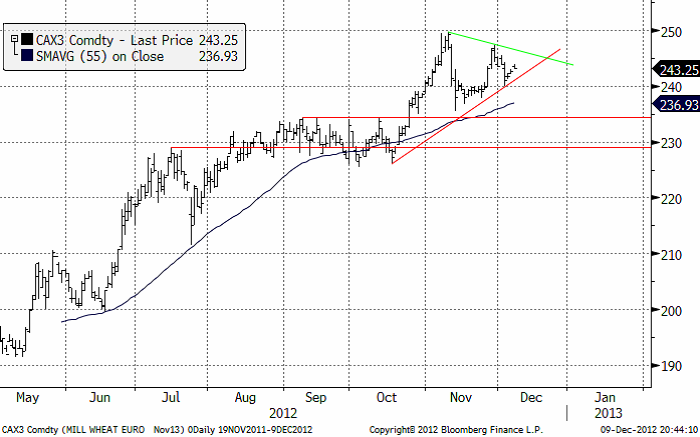
Nedan ser vi kursdiagrammet för kommande skörd, november 2013. Vi ser att den senaste toppen i slutet av november var lägre än den i början av november. Vi ser också stigande toppar. Det är alltså en så kallad ”triangelformation”, från textboken. Dessa uppträder ibland vid viktiga trendvändningar. Vi får hålla ett öga på vad som händer, i synnerhet om stödlinjen skulle brytas, vilket sker om kursen på kontraktet faller ner mot 240 euro igen. Det kan då innebära att trenden har vänt ner. Än så länge är dock trenden uppåtriktad, men vi skulle inte ta nya färska positioner för ytterligare en uppgång.
Den senaste GASC-tendern blev klar i veckan som gick. Den visade att franskt och amerikanskt vete tog hem det mesta. Rumänskt vete var med för leverans i närtid, men inte mot slutet av perioden. Ryskt och Ukrainskt vete var inte med alls, det kom inga erbjudanden alls. Det visar att dessa, som vi skrivit om tidigare, har nått sitt de facto ”exportstopp”. USA kan, pga stoppet i exportkanalen Mississippi-floden försvinna från världsmarknaden eller i vart fall minska. Ur detta perspektiv kan man inte utesluta ytterligare en pristopp i spotkontraktet under våren, alltså marskontrakten i Chicago och Paris.
Torkan i USA är så stor att man räknar med att upp mot 35% av HRWW-fälten kommer att överges och besås med annat. Det innebär att premien för högproteinvete troligtvis kommer att gå upp. De lantbrukare i Sverige som kommer att ”tvingas” så vårvete kan behöver därför troligtvis inte oroa sig för ett lågt pris vid skörd.
Maltkorn
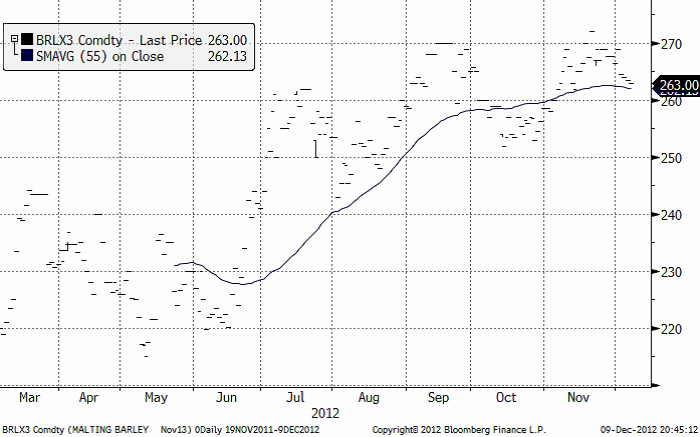
November 2013-kontraktet har fallit i pris med ett par procent. Marknaden har tappat mycket momentum sedan uppgången i somras.
Potatis
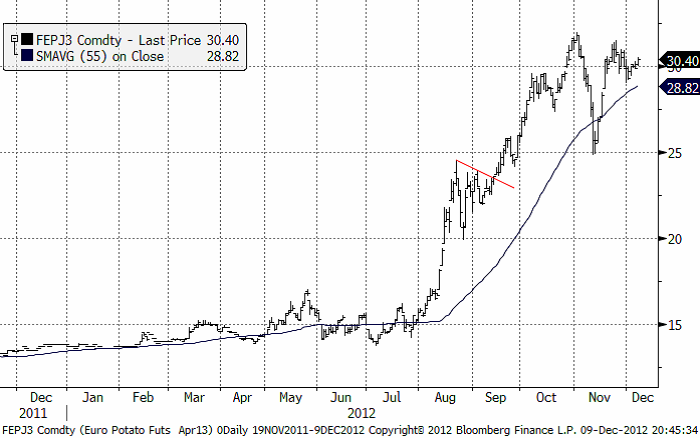
Potatispriset för leverans i april har fortsatt att pendla kring 30 euro per dt. Vi ser kursutvecklingen i diagrammet nedan. För leverans i april 2014, dvs av den kommande sommarens skörd, föll priset från 16 till 15.80 euro per dt. Hela prisfallet skedde i fredags. Under fredagen var priset nere på 15.50 euro, innan marknaden återhämtade sig till stängning på 15.80.
Majs
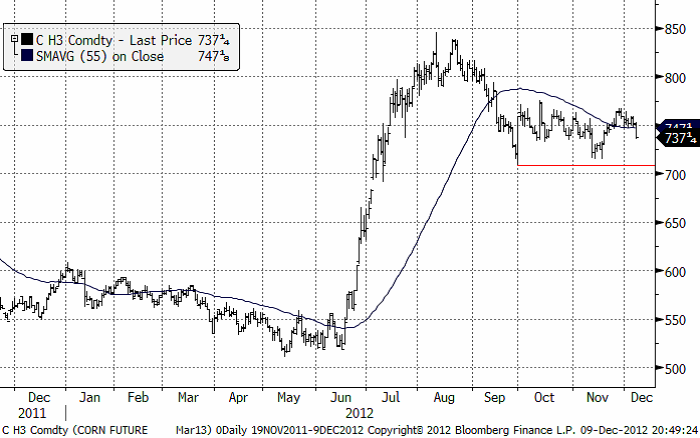
Majspriset (mars 2013) slutade veckan med ett ordentligt prisfall och stängde nära dagslägsta. Det ser ut som om fallet kan fortsätta ner mot det tekniska stödet på strax över 700 cent och testa det. Ett brott av det på nedsidan skulle signalera en större prisnedgång.
Etanolproduktionen i USA var något högre än väntat, däremot rapporterade DOE lagerstatstik som var högre än väntat. Om USA når ”the fiscal cliff” är stödet för etanolinblandning i fara. USA kan också ta till en sänkning av inblandningen för att undvika att ”the fiscal cliff” ska slå till. Marknaden har också slagits av att exporten från Sydamerika är så stark, samtidigt som USA har stora exportproblem med Mississippifloden som redan är stängd för vintern vid de norra delarna, från St Louis och norrut.
Sojabönor
Sojabönorna har stigit i pris de senaste veckorna, men vi anser inte att detta är en stigande trend, utan en normal rekyl i en fallande marknad. Stödlinjen ligger strax under dagens kurs och vi tror att den kommer att brytas i veckan. Vi har därför en säljrekommendation alltjämt, men något mer aktualiserad i det här veckobrevet. Priset har gått upp till en nivå där man kunde vänta sig motstånd och slutet på rekylen. Nu väntar troligen ett nytt test på nedsidan av 1400-nivån.
Som vi nämnt ovan, är norra Argentina blött. Stora delar av delstaten Buenos Aires är drabbat av översvämningar. Sådden är var avklarad till 54% i veckan. Det talas om att lantbrukare byter från majs till sojabönor i ganska stor utsträckning, vilket gör det svårt att följa statistiken. Väderleksprognosen ser bra ut för Argentina i veckan som kommer, med huvudsakligen torrt väder.
Raps
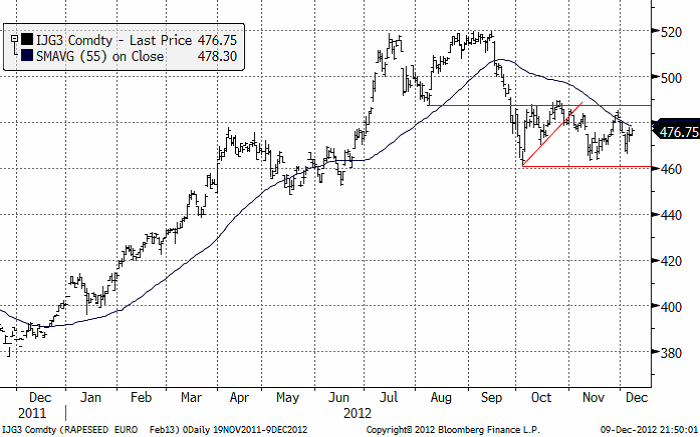
Rapspriset (februari 2013) är oförändrat jämfört med förra veckan. Marknaden handlar i ett brett intervall, liksom sojabönorna. Däremot hann inte marknaden påverkas av prisfallet på soja i USA i fredags, då Matif redan hade stängt då.
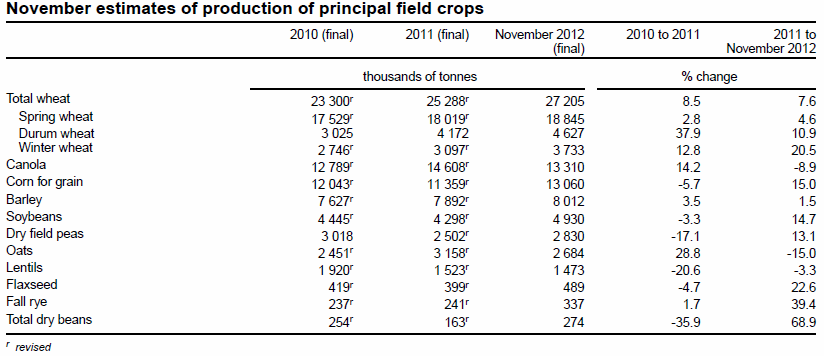
StatsCanadas senaste uppdatering av skördeestimatet kom in lägre än förväntat, på 13.3 mt. USDA hade senast ett estimat för Kanada på 13.4 mt. Men vid den sista juni har då Kanada bara 5 dagars konsumtion kvar i lager, vilket är osannolikt för lågt. Den här verkligheten talar för ett högt pris framöver, men det ser inte så ut tekniskt.
Gris
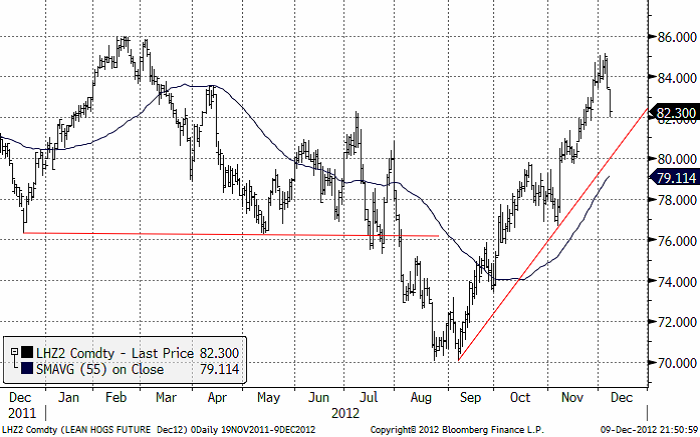
Grispriset (Dec 12) har fallit kraftigt i två dagar, efter att uppgången förmodligen nått sin topp i den uppgång som varat sedan augusti. Trenden uppåt är dock inte bruten än, men de två senaste dagarnas kraftiga kursfall stämmer inte med en marknad i uppgång. Prisfallet är för stort för det.
Mjölk
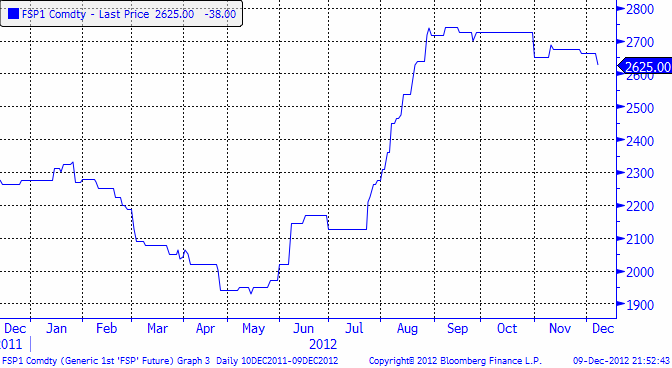
Från EUREX priser på smör och SMP kan vi utläsa att priset för ett kilo mjölk (råvara) nu ligger på 3.51 kr per kilo. Priset på mjölkpulver i Nordeuropa har fortsatt att utveckla sig svagt.
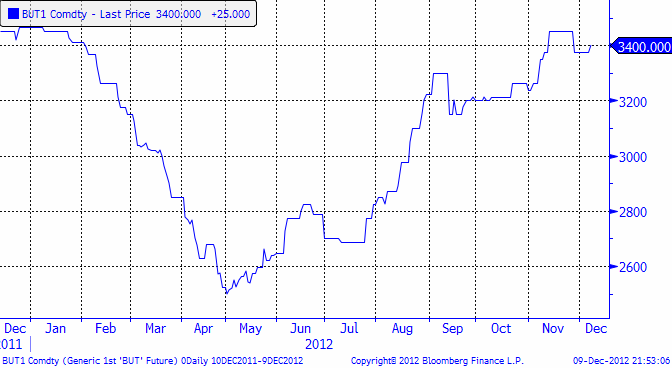
Nedan ser vi priset på smör, som är lite starkare än marknaden för pulver.
Det börsbaserade priset i svenska kronor beräknas med formeln:
där
BUT = priset på smör i euro per ton
SMP = priset på skummjölkspulver i euro per ton
FX = växelkursen för EURSEK.
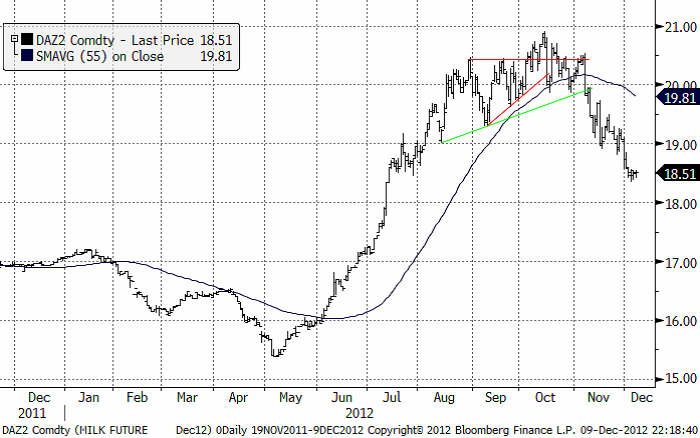
Precis som vi skrev i förra veckans brev så fann priset på Klass 3 mjölk, på den amerikanska börsen CME i Chicago, tekniskt stöd på 19 cent per pund och rekylerade uppåt därifrån. Trenden är dock nedåtriktad och en rekyl uppåt tycker vi ska ses som ett säljtillfälle.
Precis som vi skrivit de senaste veckorna, har priset på klass 3 mjölk fallit ordentligt.
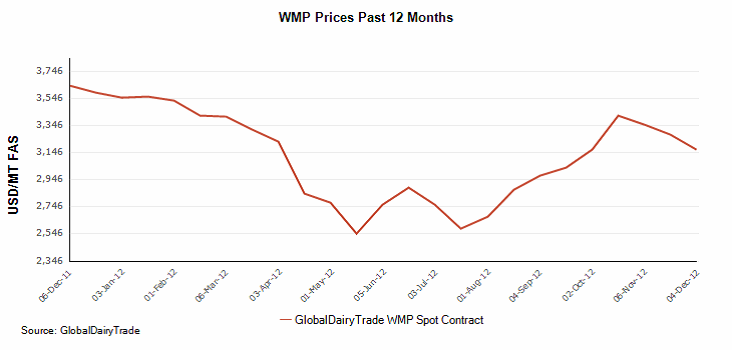
Enligt Nya Zeelands Fonterra Cooperative Group Ltd föll priset på helmjölkspulver till den lägsta nivån på två månader. Februarikontraktet för helmjölkspulver noterade en nedgång på 3.2 % till 3,157 usd/mt.
Socker
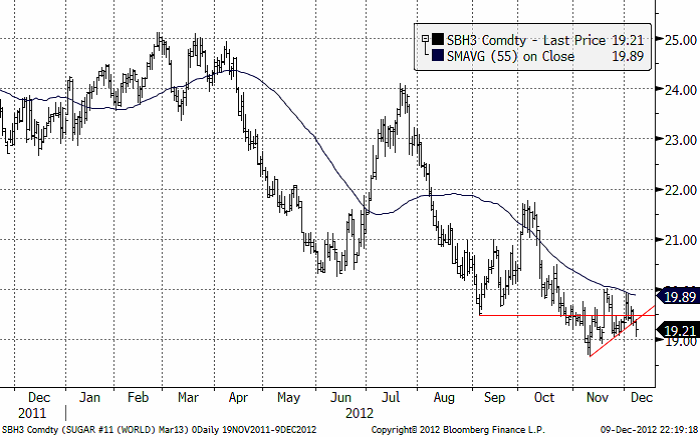
Priset på socker (mars 2013) har misslyckats med att ta sig över motståndet på 20 cent. Istället bröts stödlinjen vid 19.40 cent i fredags. Det signalerar ett nytt test av 19 cent och kanske även 18.69, som är kontraktslägsta.
Gödsel
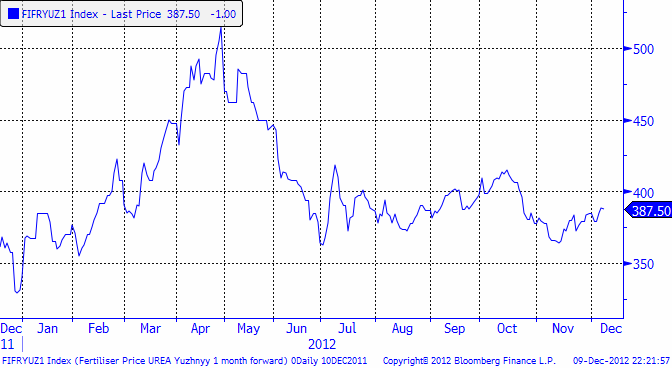
Spotkontraktet för Urea FOB Yuzhnyy som fann en stödnivå på 365 $ / ton i början av mnovember, har fortsatt att successivt stiga. Prisrörelsen ligger fortfarande inom det intervall som urea handlats till sedan juni. Det fortsätter alltså att vara stabila priser och det finns just nu inga tecken på att det ska förändras.
EURSEK
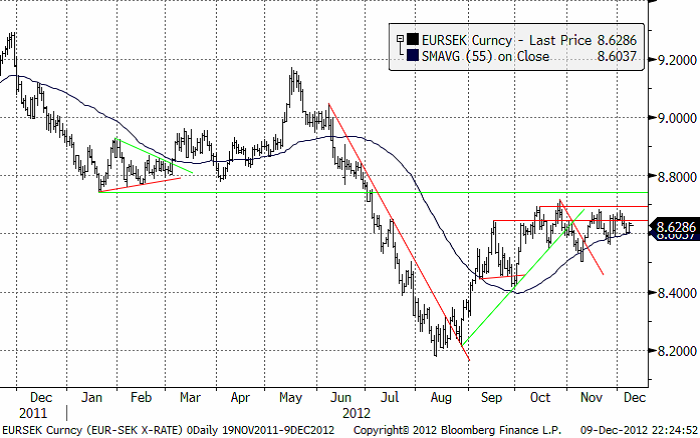
EURSEK har inte orkat ta sig över 8.70 kr, utan istället stött på ganska hårt motstånd där. Kampen mellan köpare och säljare av euro mot kronor kämpar om övertaget. Ett brott på uppsidan av 8.70 skulle innebära att säljarna vunnit för tillfället. Vi noterar dock att bottnarna stigit den högre månaden, utan att högre toppar noterats. Det kan betyda att ett brott på nedsidan rycker närmare.
USDSEK
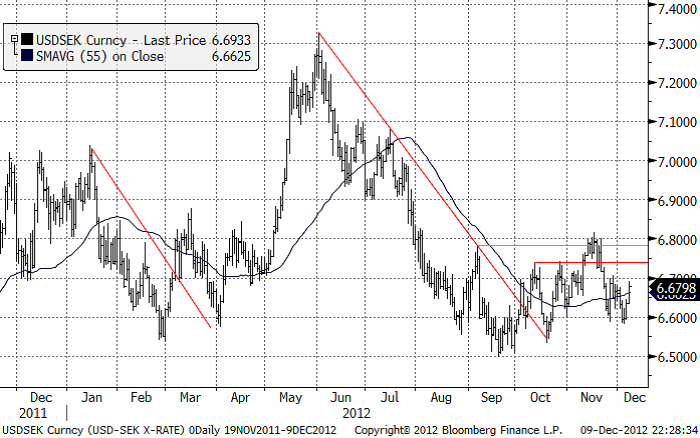
Dollarna fortsätter att handlas ”sidledes”. 6.60 kr per dollar ser ut som ett stöd. Kursen har vänt upp från den nivån två gånger sedan månadsskiftet oktober/november. 6.70 ser likaledes ut som en motståndsnivå. Vid 6.80 ser vi ytterligare en motståndsnivå. Just nu ser det ut som om vi kan förvänta oss ännu mer ”sidledes” rörelse inom detta intervall.
[box]SEB Veckobrev Jordbruksprodukter är producerat av SEB Merchant Banking och publiceras i samarbete och med tillstånd på Råvarumarknaden.se[/box]
Disclaimer
The information in this document has been compiled by SEB Merchant Banking, a division within Skandinaviska Enskilda Banken AB (publ) (“SEB”).
Opinions contained in this report represent the bank’s present opinion only and are subject to change without notice. All information contained in this report has been compiled in good faith from sources believed to be reliable. However, no representation or warranty, expressed or implied, is made with respect to the completeness or accuracy of its contents and the information is not to be relied upon as authoritative. Anyone considering taking actions based upon the content of this document is urged to base his or her investment decisions upon such investigations as he or she deems necessary. This document is being provided as information only, and no specific actions are being solicited as a result of it; to the extent permitted by law, no liability whatsoever is accepted for any direct or consequential loss arising from use of this document or its contents.
About SEB
SEB is a public company incorporated in Stockholm, Sweden, with limited liability. It is a participant at major Nordic and other European Regulated Markets and Multilateral Trading Facilities (as well as some non-European equivalent markets) for trading in financial instruments, such as markets operated by NASDAQ OMX, NYSE Euronext, London Stock Exchange, Deutsche Börse, Swiss Exchanges, Turquoise and Chi-X. SEB is authorized and regulated by Finansinspektionen in Sweden; it is authorized and subject to limited regulation by the Financial Services Authority for the conduct of designated investment business in the UK, and is subject to the provisions of relevant regulators in all other jurisdictions where SEB conducts operations. SEB Merchant Banking. All rights reserved.
Analys
Sell the rally. Trump has become predictable in his unpredictability

Hesitant today. Brent jumped to an intraday high of $66.36/b yesterday after having touched an intraday low of $60.07/b on Monday as Indian and Chinese buyers cancelled some Russian oil purchases and instead redirected their purchases towards the Middle East due to the news US sanctions. Brent is falling back 0.4% this morning to $65.8/b.

It’s our strong view that the only sensible thing is to sell this rally. In all Trump’s unpredictability he has become increasingly predictable. Again and again he has rumbled about how he is going to be tough on Putin. Punish Putin if he won’t agree to peace in Ukraine. Recent rumbling was about the Tomahawk rockets which Trump threatened on 10 October and 12 October to sell/send to Ukraine. Then on 17 October he said that ”the U.S. didn’t want to give away weapons (Tomahawks) it needs”.
All of Trump’s threats towards Putin have been hot air. So far Trump’s threats have been all hot air and threats which later have evaporated after ”great talks with Putin”. After all these repetitions it is very hard to believe that this time will be any different. The new sanctions won’t take effect before 21. November. Trump has already said that: ”he was hoping that these new sanctions would be very short-lived in any case”. Come 21. November these new sanctions will either evaporate like all the other threats Trump has thrown at Putin before fading them. Or the sanctions will be postponed by another 4 weeks or 8 weeks with the appearance that Trump is even more angry with Putin. But so far Trump has done nothing that hurt Putin/Russia. We can’t imagine that this will be different. The only way forward in our view for a propre lasting peace in Ukraine is to turn Ukraine into defensive porcupine equipped with a stinging tail if need be.
China will likely stand up to Trump if new sanctions really materialize on 21 Nov. Just one country has really stood up to Trump in his tariff trade war this year: China. China has come of age and strength. I will no longer be bullied. Trump upped tariffs. China responded in kind. Trump cut China off from high-end computer chips. China put on the breaks on rare earth metals. China won’t be bullied any more and it has the power to stand up. Some Chinese state-owned companies like Sinopec have cancelled some of their Russian purchases. But China’s Foreign Ministry spokesperson Guo Jiakun has stated that China “oppose unilateral sanctions which lack a basis in international law and authorization of the UN Security Council”. Thus no one, not even the US shall unilaterally dictate China from whom they can buy oil or not. This is yet another opportunity for China to show its new strength and stand up to Trump in a show of force. Exactly how China choses to play this remains to be seen. But China won’t be bullied by over something as important as its oil purchases. So best guess here is that China will defy Trump on this. But probably China won’t need to make a bid deal over this. Firstly because these new sanctions will either evaporate as all the other threats or be postponed once we get to 21 November. Secondly because the sanctions are explicit towards US persons and companies but only ”may” be enforced versus non-US entities.
Sanctions is not a reduction in global supply of oil. Just some added layer of friction. Anyhow, the new sanctions won’t reduce the supply of Russian crude oil to the market. It will only increase the friction in the market with yet more need for the shadow fleet and ship to ship transfer of Russian oil to dodge the sanctions. If they materialize at all.
The jump in crude oil prices is probably due to redirections of crude purchases to the Mid-East and not because all speculators are now turned bullish. Has oil rallied because all speculators now suddenly have turned bullish? We don’t think so. Brent crude has probably jumped because some Indian and Chinese oil purchasers of have redirected their purchases from Russia towards the Mid-East just in case the sanctions really materializes on 21 November.
Analys
Brent crude set to dip its feet into the high $50ies/b this week

Parts of the Brent crude curve dipping into the high $50ies/b. Brent crude fell 2.3% over the week to Friday. It closed the week at $61.29/b, a slight gain on the day, but also traded to a low of $60.14/b that same day and just barely avoided trading into the $50ies/b. This morning it is risk-on in equities which seems to help industrial metals a little higher. But no such luck for oil. It is down 0.8% at $60.8/b. This week looks set for Brent crude to dip its feet in the $50ies/b. The Brent 3mth contract actually traded into the high $50ies/b on Friday.

The front-end backwardation has been on a weakening foot and is now about to fully disappear. The lowest point of the crude oil curve has also moved steadily lower and lower and its discount to the 5yr contract is now $6.8/b. A solid contango. The Brent 3mth contract did actually dip into the $50ies/b intraday on Friday when it traded to a low point of $59.93/b.
More weakness to come as lots of oil at sea comes to ports. Mid-East OPEC countries have boosted exports along with lower post summer consumption and higher production. The result is highly visibly in oil at sea which increased by 17 mb to 1,311 mb over the week to Sunday. Up 185 mb since mid-August. On its way to discharge at a port somewhere over the coming month or two.
Don’t forget that the oil market path ahead is all down to OPEC+. Remember that what is playing out in the oil market now is all by design by OPEC+. The group has decided that the unwind of the voluntary cuts is what it wants to do. In a combination of meeting demand from consumers as well as taking back market share. But we need to remember that how this plays out going forward is all at the mercy of what OPEC+ decides to do. It will halt the unwinding at some point. It will revert to cuts instead of unwind at some point.
A few months with Brent at $55/b and 40-50 US shale oil rigs kicked out may be what is needed. We think OPEC+ needs to see the exit of another 40-50 drilling rigs in the US shale oil patches to set US shale oil production on a path to of a 1 mb/d year on year decline Dec-25 to Dec-26. We are not there yet. But a 2-3 months period with Brent crude averaging $55/b would probably do it.
Oil on water increased 17 mb over the week to Sunday while oil in transit increased by 23 mb. So less oil was standing still. More was moving.

Crude oil floating storage (stationary more than 7 days). Down 11 mb over week to Sunday

The lowest point of the Brent crude oil curve versus the 5yr contract. Weakest so far this year.

Crude oil 1mth to 3mth time-spreads. Dubai held out strongly through summer, but then that center of strength fell apart in late September and has been leading weakness in crude curves lower since then.

Analys
Crude oil soon coming to a port near you

Rebounding along with most markets. But concerns over solidity of Gaza peace may also contribute. Brent crude fell 0.8% yesterday to $61.91/b and its lowest close since May this year. This morning it is bouncing up 0.9% to $62.5/b along with a softer USD amid positive sentiment with both equities and industrial metals moving higher. Concerns that the peace in Gaza may be less solid than what one might hope for also yields some support to Brent. Bets on tech stocks are rebounding, defying fears of trade war. Money moving back into markets. Gold continues upwards its strong trend and a softer dollar helps it higher today as well.

US crude & products probably rose 5.6 mb last week (API) versus a normal seasonal decline of 2.4 mb. The US API last night partial and thus indicative data for US oil inventories. Their data indicates that US crude stocks rose 7.4 mb last week, gasoline stocks rose 3.0 mb while Distillate stocks fell 4.8 mb. Altogether an increase in commercial crude and product stocks of 5.6 mb. Commercial US crude and product stocks normally decline by 2.4 mb this time of year. So seasonally adjusted the US inventories rose 8 mb last week according to the indicative numbers by the API. That is a lot. Also, the counter seasonal trend of rising stocks versus normally declining stocks this time of year looks on a solid pace of continuation. If the API is correct then total US crude and product stocks would stand 41 mb higher than one year ago and 6 mb higher than the 2015-19 average. And if we combine this with our knowledge of a sharp increase in production and exports by OPEC(+) and a large increase in oil at sea, then the current trend in US oil inventories looks set to continue. So higher stocks and lower crude oil prices until OPEC(+) switch to cuts. Actual US oil inventory data today at 18:00 CET.
US commercial crude and product stocks rising to 1293 mb in week 41 if last nights indicative numbers from API are correct.

Crude oil soon coming to a port near you. OPEC has lifted production sharply higher this autumn. At the same time demand for oil in the Middle-East has fallen as we have moved out of summer heat and crude oil burn for power for air-conditioning. The Middle-East oil producers have thus been able to lift exports higher on both accounts. Crude oil and condensates on water has shot up by 177 mb since mid-August. This oil is now on its way to ports around the world. And when they arrive, it will likely help to lift stocks onshore higher. That is probably when we will lose the last bit of front-end backwardation the the crude oil curves. That will help to drive the front-month Brent crude oil price down to the $60/b line and revisit the high $50ies/b. Then the eyes will be all back on OPEC+ when they meet in early November and then again in early December.
Crude oil and condensates at sea have moved straight up by 177 mb since mid-August as OPEC(+) has produced more, consumed less and exported more.

-

 Nyheter3 veckor sedan
Goldman Sachs höjer prognosen för guld, tror priset når 4900 USD
-

 Nyheter4 veckor sedan
Blykalla och amerikanska Oklo inleder ett samarbete
-

 Nyheter3 veckor sedan
Guld nära 4000 USD och silver 50 USD, därför kan de fortsätta stiga
-

 Nyheter2 veckor sedan
Leading Edge Materials är på rätt plats i rätt tid
-

 Nyheter3 veckor sedan
Nytt prisrekord, guld stiger över 4000 USD
-

 Nyheter4 veckor sedan
Ett samtal om guld, olja, koppar och stål
-

 Analys4 veckor sedan
OPEC+ will likely unwind 500 kb/d of voluntary quotas in October. But a full unwind of 1.5 mb/d in one go could be in the cards
-

 Nyheter4 veckor sedan
Neptune Energy bekräftar enorma litiumfyndigheter i Tyskland


