

Analys
Risk for OPEC dissapointment and a short term sell-off as all bets are on the long side

 Marked has placed all chips on the long side betting on an extension of OPEC/non-OPEC production cuts which officially ends in Q1-18. In general we do think that OPEC/non-OPEC will manage the market and hold back production if needed through 2018 in order to secure further gradual draw down of OECD inventories. However we also think that it would be better for OPEC/non-OPEC to make hard decissions on this in Feb/Mar getting as much data as possible before making that decission. That is also what the group has mostly consistengly communicated through the autumn. The market seems to expect and demand a firm decission right now this week. As such the market is rigged for dissapointment with a possible short term sell-off as all chips are on the long side.
On Thursday 30th OPEC and some non-OPEC producers will meet in Vienna to discuss whether to extend current production cuts or not.
The communication all through the autumn has been that they want to make this decission in February/March 2018 in order to have as much data on the table as possible before making the decission.
That makes a lot of sense since there is substantial dissagreement with respect to how much oil is needed from OPEC in 2018.
Somehow the market has geared it self up to an expectation that OPEC/non-OPEC needs to make a firm decission on this right now on Thursday. And further that the decission will be an extension of current cuts maintained all to the end of 2018.
As such it seems to us that there is a substantial risk that the market is setting it self up for a dissapointment this week. For us it makes much more sense for the group to make this call in Feb/Mar which is also what they mostly have been communicating all through the autumn.
The challenge for the group this is week may thus be all about managing the market’s expectations. How not to let the market down when it communicates that the decission will be taken in Feb/March.
And if there is a decission this week it is likely going to be a sign of intention: “If needed we’ll maintain cuts to the end of 2018”, or “We’ll maintain cuts to June 2018 and then make a new assessment”, or “We are all in agreement that we’ll extend cuts as long as needed in order to drive OECD inventories down to the 5 year average”.
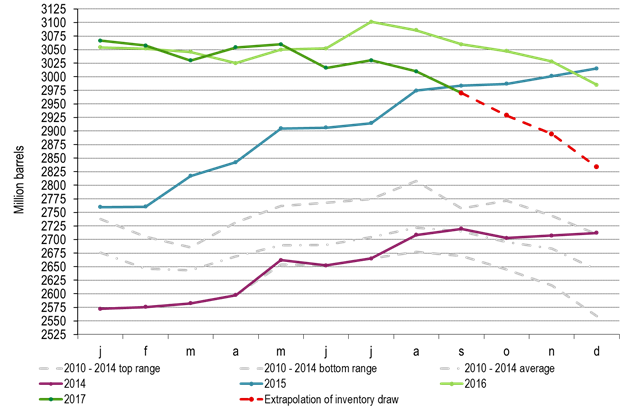
That is indeed a trickey reference. This is because for every month we move forward the 5 year average reference is rising. Since March 2017 the OECD inventories have declined some 0.7 mb/d when adjusting for seasonal trends (given by the 2010-2014 seasonal average profile). If we extend this decline rate on top of the seasonal trend (2010-2014) we actually almost get all the way down the 2013-2017 average profile.
As such one can say that in February when we get the OECD inventory data for December 2017 the goal of getting inventories down to the 5 year average (2013-2017) will have been achieved. The goal of getting OECD inventories down to the 5 year average is thus a trickey goal and a moving target.
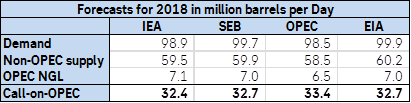
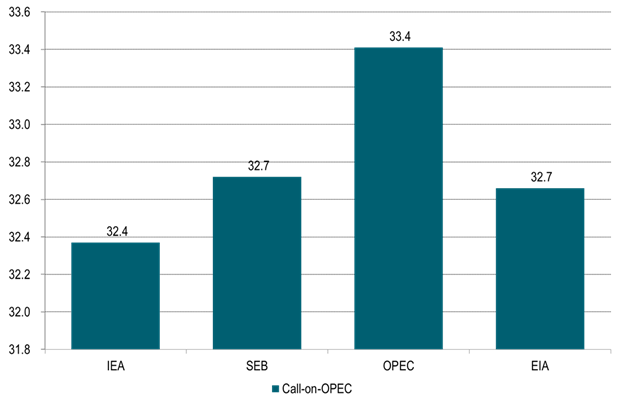
The big question though is what is really needed in order to secure a balanced oil market in 2018? There is a significant dissagreement on this. The IEA says that call-on-OPEC will be 32.4 mb/d in 2018. SEB’s estimate is 32.7 mb/d, the US EIA’s is 32.7 mb/d while OPEC’s own estimate is 33.4 mb/d. Variations on this comes down to projections for demand, US shale oil production and the level of OPEC’s NGL production in 2018.
The OECD draw down since March this year of 0.7 mb/d (adjusted for seasonallity) indicates an implied oil market deficit of 0.7 mb/d thrugh Q2 and Q3 this year during which OPEC produced 32.55 mb/d. However, if we assume that the OECD inventories only cover half or a third of global inventories then what we see of deficit implied by the draw down in the OECD inventories could actually be two or three times as much if there have been comparable draw downs in non-OECD inventories.
Thus beeing carefule about committing to further cuts now on Thursday seems kind of sensible with the aim of instead making that decission in Feb/Mar.
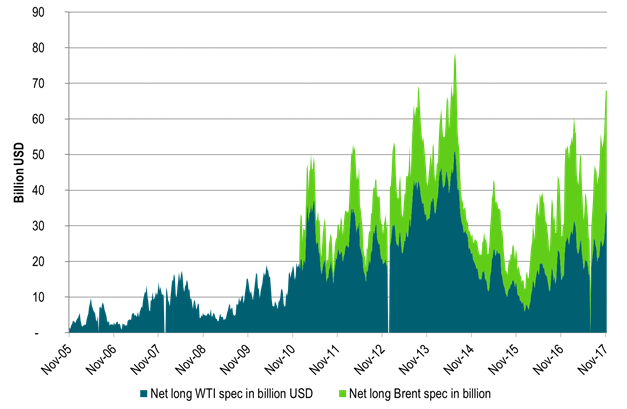
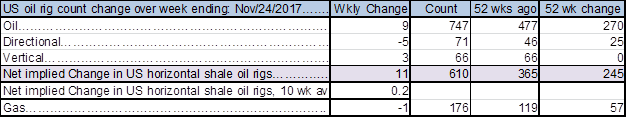
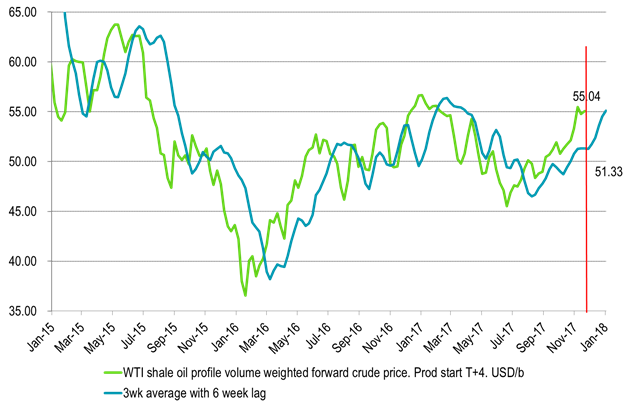
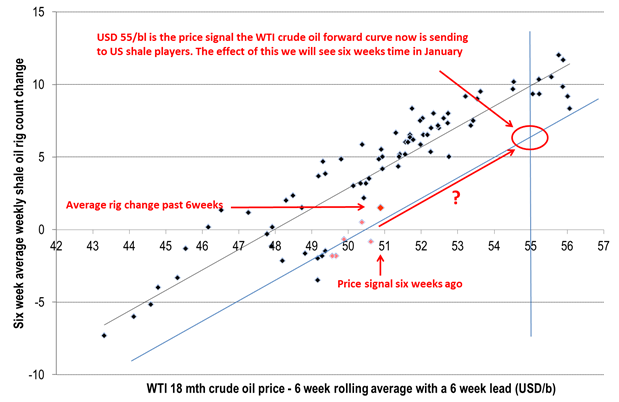
Market participants are seemingly all expecting OPEC/non-OPEC to make a firm and clear decission this Thursday for extending current cuts to Dec-2018. Net long speculative positions for Brent and WTI together are now very close to all time high. US oil rig count has started to rise again (+9 rigs last week). The decission to add these 9 rigs was probably taken some 6-8 weeks ago when the WTI forward price only stood at $51-52/b. Now that reference WTI price stands at $55/bl with a clear risk for a rise in rig count in the weeks to come. The outage of the 590 kbl/d Keystone pipeline due to an oil spill has reduced supply into Cushing Oklahoma by some 4 mbl/week. It has helped to reduce Chushing inventories and to drive also the WTI crude curve into backwardation. However, the Keystone pipline is likely to back in operation within a week or so.
Thus overall there is a fair chance that the market will be dissapointed on Thursday. That there will be no firm decission even though there will be firm support for further cuts if needed. And if OPEC/non-OPEC actually do make a firm decission to maintain cuts all to the end of 2018 then there may not be much upside price action since that decission is already so highly priced in already.
Thus buying a put option on the front month WTI contract with short time to expiry may be a good strattegy in the run-up to this week’s digital OPEC/non-OPEC decission risk on Thursday.
Our general stand on OPEC/non-OPEC cuts for 2018 is that further cuts are likely needed but also that if needed we expect OPEC/non-OPEC to manage the market in order to prevent inventories from rising back up.
Needed cuts will likely be of a magnitude which are perfectly manageable for the group. Why through away all they have acchieved in 2017 with inventory draw downs when they can hold back a little supply.
Ch1: OECD inventories with extrapolation to end of 2017 of the 0.7 mb/d draw down in Q2 and Q3 2017
Getting closer to the 2010-2014 average in December 2017
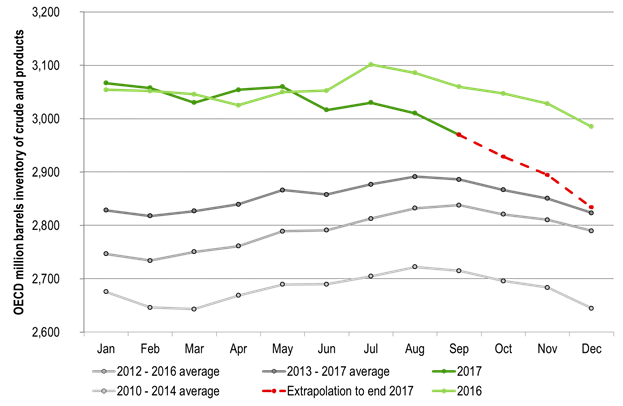
Ch2: OECD inventories. Which 5 year normal should you use? The 2013-2017?
If the latter then mission acomplished in December 2017, but we won’t know before February
Ch3: Call-on-OPEC 2018? – Big dissagreement!
Who knows OPEC NGL the best? Account for 0.6 mb/d difference to the IEA!
Ch4: Close to record USD allocation in net long speculative Brent crude oil positions
Makes it vulnerable to downside corrections and OPEC/non-OPEC dissapointments
Net long Brent crude oil speculative positions are now at the 3rd highest over the past 52 weeks
Ch5: US oil rig count has started to rise again
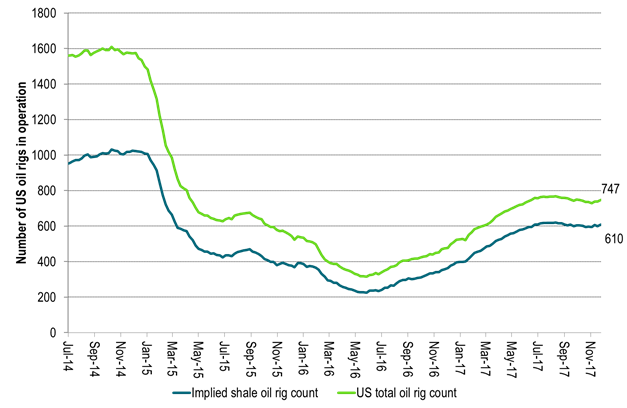
Ch6 The increas in rig count we see now came from price signals some 6-8 weeks ago
Since then the WTI curve price has moved from $51/bl to $55/bl.
The effect of the price rise over the past 6-8 weeks will be visible in terms of rig count over the coming 6-8 weeks
Ch7: Risk of rising rig count in the weeks to come
Could weight bearishly on the WTI crude oil price
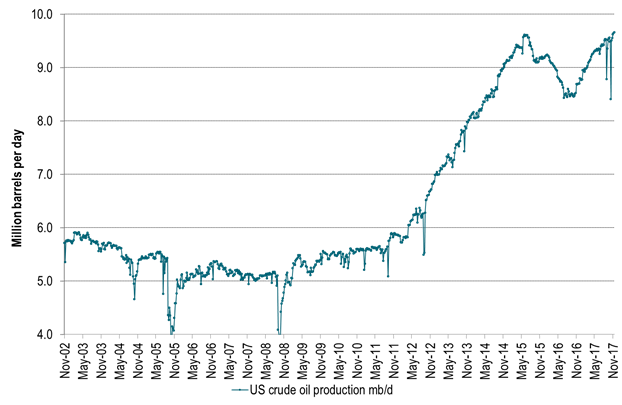
Ch8: While US crude oil production continues to rise
Will it rise 0.7 mb/d or 1.5 mb/d next year?
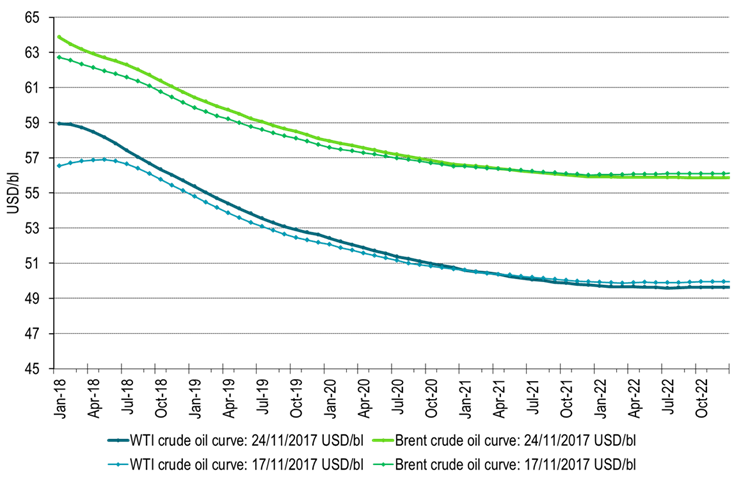
Ch9: WTI crude oil curve shifted into backwardation following the outage of the Keystone pipeline which feeds 590 kbl/d of Canadian oil into Chushing Oklahoma
The Keystone pipeline is likely going to be back on line within a week or so which could push the WTI curve back into contango again
Kind regards
Bjarne Schieldrop
Chief analyst, Commodities
SEB Markets
Merchant Banking
Rebounding along with most markets. But concerns over solidity of Gaza peace may also contribute. Brent crude fell 0.8% yesterday to $61.91/b and its lowest close since May this year. This morning it is bouncing up 0.9% to $62.5/b along with a softer USD amid positive sentiment with both equities and industrial metals moving higher. Concerns that the peace in Gaza may be less solid than what one might hope for also yields some support to Brent. Bets on tech stocks are rebounding, defying fears of trade war. Money moving back into markets. Gold continues upwards its strong trend and a softer dollar helps it higher today as well.

US crude & products probably rose 5.6 mb last week (API) versus a normal seasonal decline of 2.4 mb. The US API last night partial and thus indicative data for US oil inventories. Their data indicates that US crude stocks rose 7.4 mb last week, gasoline stocks rose 3.0 mb while Distillate stocks fell 4.8 mb. Altogether an increase in commercial crude and product stocks of 5.6 mb. Commercial US crude and product stocks normally decline by 2.4 mb this time of year. So seasonally adjusted the US inventories rose 8 mb last week according to the indicative numbers by the API. That is a lot. Also, the counter seasonal trend of rising stocks versus normally declining stocks this time of year looks on a solid pace of continuation. If the API is correct then total US crude and product stocks would stand 41 mb higher than one year ago and 6 mb higher than the 2015-19 average. And if we combine this with our knowledge of a sharp increase in production and exports by OPEC(+) and a large increase in oil at sea, then the current trend in US oil inventories looks set to continue. So higher stocks and lower crude oil prices until OPEC(+) switch to cuts. Actual US oil inventory data today at 18:00 CET.
US commercial crude and product stocks rising to 1293 mb in week 41 if last nights indicative numbers from API are correct.

Crude oil soon coming to a port near you. OPEC has lifted production sharply higher this autumn. At the same time demand for oil in the Middle-East has fallen as we have moved out of summer heat and crude oil burn for power for air-conditioning. The Middle-East oil producers have thus been able to lift exports higher on both accounts. Crude oil and condensates on water has shot up by 177 mb since mid-August. This oil is now on its way to ports around the world. And when they arrive, it will likely help to lift stocks onshore higher. That is probably when we will lose the last bit of front-end backwardation the the crude oil curves. That will help to drive the front-month Brent crude oil price down to the $60/b line and revisit the high $50ies/b. Then the eyes will be all back on OPEC+ when they meet in early November and then again in early December.
Crude oil and condensates at sea have moved straight up by 177 mb since mid-August as OPEC(+) has produced more, consumed less and exported more.

When it starts to move lower it moves rather quickly. Gaza, China, IEA. Brent crude is down 2.1% today to $62/b after having traded as high as $66.58/b last Thursday and above $70/b in late September. The sell-off follows the truce/peace in Gaze, a flareup in US-China trade and yet another bearish oil outlook from the IEA.
A lasting peace in Gaze could drive crude oil at sea to onshore stocks. A lasting peace in Gaza would probably calm down the Houthis and thus allow more normal shipments of crude oil to sail through the Suez Canal, the Red Sea and out through the Bab-el-Mandeb Strait. Crude oil at sea has risen from 48 mb in April to now 91 mb versus a pre-Covid normal of about 50-60 mb. The rise to 91 mb is probably the result of crude sailing around Africa to be shot to pieces by the Houthis. If sailings were to normalize through the Suez Canal, then it could free up some 40 mb in transit at sea moving onshore into stocks.
The US-China trade conflict is of course bearish for demand if it continues.
Bearish IEA yet again. Getting closer to 2026. Credibility rises. We expect OPEC to cut end of 2025. The bearish monthly report from the IEA is what it is, but the closer we get to 2026, the more likely the IEA is of being ball-park right in its outlook. In its monthly report today the IEA estimates that the need for crude oil from OPEC in 2026 will be 25.4 mb/d versus production by the group in September of 29.1 mb/d. The group thus needs to do some serious cutting at the end of 2025 if it wants to keep the market balanced and avoid inventories from skyrocketing. Given that IEA is correct that is. We do however expect OPEC to implement cuts to avoid a large increase in inventories in Q1-26. The group will probably revert to cuts either at its early December meeting when they discuss production for January or in early January when they discuss production for February. The oil price will likely head yet lower until the group reverts to cuts.
Dubai: The Mid-East anchor dragging crude oil lower. Surplus emerging in Mid-East pricing. Crude oil prices held surprisingly strong all through the summer. A sign and a key source of that strength came from the strength in the front-end backwardation of the Dubai crude oil curve. It held out strong from mid-June and all until late September with an average 1-3mth time-spread premium of $1.8/b from mid-June to end of September. The 1-3mth time-spreads for Brent and WTI however were in steady deterioration from late June while their flat prices probably were held up by the strength coming from the Persian Gulf. Then in late September the strength in the Dubai curve suddenly collapsed. Since the start of October it has been weaker than both the Brent and the WTI curves. The Dubai 1-3mth time-spread now only stands at $0.25/b. The Middle East is now exporting more as it is producing more and also consuming less following elevated summer crude burn for power (Aircon) etc.
The only bear-element missing is a sudden and solid rise in OECD stocks. The only thing that is missing for the bear-case everyone have been waiting for is a solid, visible rise in OECD stocks in general and US oil stocks specifically. So watch out for US API indications tomorrow and official US oil inventories on Thursday.
No sign of any kind of fire-sale of oil from Saudi Arabia yet. To what we can see, Saudi Arabia is not at all struggling to sell its oil. It only lowered its Official Selling Prices (OSPs) to Asia marginally for November. A surplus market + Saudi determination to sell its oil to the market would normally lead to a sharp lowering of Saudi OSPs to Asia. Not yet at least and not for November.
The 5yr contract close to fixed at $68/b. Of importance with respect to how far down oil can/will go. When the oil market moves into a surplus then the spot price starts to trade in a large discount to the 5yr contract. Typically $10-15/b below the 5yr contract on average in bear-years (2009, 2015, 2016, 2020). But the 5yr contract is usually pulled lower as well thus making this approach a moving target. But the 5yr contract price has now been rock solidly been pegged to $68/b since 2022. And in the 2022 bull-year (Brent spot average $99/b), the 5yr contract only went to $72/b on average. If we assume that the same goes for the downside and that 2026 is a bear-year then the 5yr goes to $64/b while the spot is trading at a $10-15/b discount to that. That would imply an average spot price next year of $49-54/b. But that is if OPEC doesn’t revert to cuts and instead keeps production flowing. We think OPEC(+) will trim/cut production as needed into 2026 to prevent a huge build-up in global oil stocks and a crash in prices. But for now we are still heading lower. Into the $50ies/b.
Some rebound but not much. Brent crude rebounded 1.5% yesterday to $65.47/b. This morning it is inching 0.2% up to $65.6/b. The lowest close last week was on Thursday at $64.11/b.
The curve structure is almost as week as it was before the weekend. The rebound we now have gotten post the message from OPEC+ over the weekend is to a large degree a rebound along the curve rather than much strengthening at the front-end of the curve. That part of the curve structure is almost as weak as it was last Thursday.
We are still on a weakening path. The message from OPEC+ over the weekend was we are still on a weakening path with rising supply from the group. It is just not as rapidly weakening as was feared ahead of the weekend when a quota hike of 500 kb/d/mth for November was discussed.
The Brent curve is on its way to full contango with Brent dipping into the $50ies/b. Thus the ongoing weakening we have had in the crude curve since the start of the year, and especially since early June, will continue until the Brent crude oil forward curve is in full contango along with visibly rising US and OECD oil inventories. The front-month Brent contract will then flip down towards the $60/b-line and below into the $50ies/b.
At what point will OPEC+ turn to cuts? The big question then becomes: When will OPEC+ turn around to make some cuts? At what (price) point will they choose to stabilize the market? Because for sure they will. Higher oil inventories, some more shedding of drilling rigs in US shale and Brent into the 50ies somewhere is probably where the group will step in.
There is nothing we have seen from the group so far which indicates that they will close their eyes, let the world drown in oil and the oil price crash to $40/b or below.
The message from OPEC+ is also about balance and stability. The world won’t drown in oil in 2026. The message from the group as far as we manage to interpret it is twofold: 1) Taking back market share which requires a lower price for non-OPEC+ to back off a bit, and 2) Oil market stability and balance. It is not just about 1. Thus fretting about how we are all going to drown in oil in 2026 is totally off the mark by just focusing on point 1.
When to buy cal 2026? Before Christmas when Brent hits $55/b and before OPEC+ holds its last meeting of the year which is likely to be in early December.
Brent crude oil prices have rebounded a bit along the forward curve. Not much strengthening in the structure of the curve. The front-end backwardation is not much stronger today than on its weakest level so far this year which was on Thursday last week.

The front-end backwardation fell to its weakest level so far this year on Thursday last week. A slight pickup yesterday and today, but still very close to the weakest year to date. More oil from OPEC+ in the coming months and softer demand and rising inventories. We are heading for yet softer levels.


Vad guldets uppgång egentligen betyder för världen

Spotpriset på guld över 4300 USD och silver över 54 USD
Crude oil soon coming to a port near you

Guld och silver stiger hela tiden mot nya höjder
The Mid-East anchor dragging crude oil lower

OPEC+ missar produktionsmål, stöder oljepriserna

Ett samtal om guld, olja, fjärrvärme och förnybar energi

Goldman Sachs höjer prognosen för guld, tror priset når 4900 USD
Guld nära 4000 USD och silver 50 USD, därför kan de fortsätta stiga
Are Ukraine’s attacks on Russian energy infrastructure working?
-
 Nyheter3 veckor sedan
OPEC+ missar produktionsmål, stöder oljepriserna
-
 Nyheter4 veckor sedan
Ett samtal om guld, olja, fjärrvärme och förnybar energi
-
 Nyheter2 veckor sedan
Goldman Sachs höjer prognosen för guld, tror priset når 4900 USD
-
 Nyheter2 veckor sedan
Guld nära 4000 USD och silver 50 USD, därför kan de fortsätta stiga
-
Analys4 veckor sedan
Are Ukraine’s attacks on Russian energy infrastructure working?
-

 Nyheter3 veckor sedan
Blykalla och amerikanska Oklo inleder ett samarbete
-

 Nyheter4 veckor sedan
Guldpriset uppe på nya höjder, nu 3750 USD
-
Nyheter3 veckor sedan
Ett samtal om guld, olja, koppar och stål