

Analys
Getting to zero, getting the job done


Politicians have been talking and talking for decades but with only marginal improvements in terms of emission reductions. Primarily because actually doing the job has earlier been technologically and economically almost impossible. Now suddenly renewable energy has come of age with prices set to decline yet further. And onshore transportation can soon be electrified cost efficiently. For politicians there is now a viable path. It is still a large task but now it is more and more about just getting the job done. In rough terms some € 150 – 250 bn per year to 2050 is probably needed to build EU’s new power system.

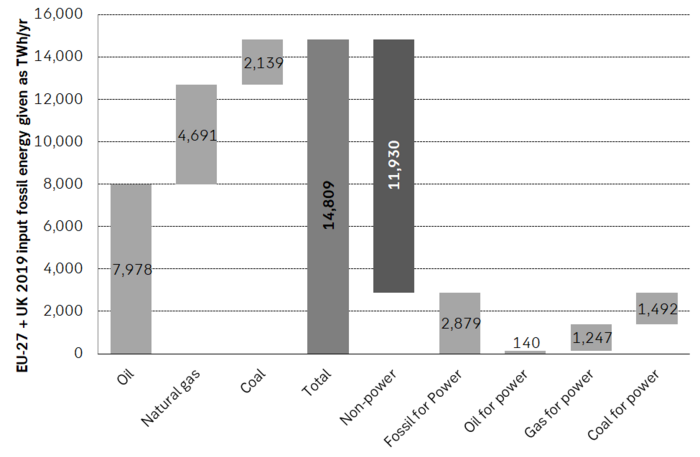
In 2019 the EU + UK consumed 15,000 worth of fossil fuels. It all needs to be gone by 2050. In 2019 the EU + UK produced 3,200 TWh of electricity of which 1,295 TWh (40%) was fossil fuel based. Thus 60% of the power supply is already non-fossil. However, if we look at the larger picture of energy we see that the region consumed nearly 15,000 TWh of raw (evaluated pre-combustion) fossil fuels that year of which only 3,000 TWh was used for power. The remaining 12,000 TWh of fossil fuel consumption was consumed for heat, transportation, petrochemical and industrial uses. I.e. the lion’s share of fossil fuel consumption in the region is non-power related.
Thus getting to zero by 2050 is far more than swapping out of the 3,000 TWh of fossil fuels (pre-combustion) used for power supply today which post combustion creates 40% and 1,295 TWh of the regions electricity supply. The challenge is also about replacing the other 12,000 TWh of fossil energy for non-power uses.
As most know the conversion of fossil fuels to useful energy and work done is highly inefficient. In cars one rarely get more than 30% of the energy converted to useful driving with the rest just lost as heat. In large, power plants the conversion ratio is usually around 35% to 55% but mostly below 50%. Gas for heating purposes is of course highly efficient as almost all of it naturally is converted to heat.
The region is now aiming to go green by 2050 and that mostly means going electric. This again means that some 15,000 TWh of fossil energy spent today needs to be replaced by non-fossil based electricity. Given the highly inefficient burn of fossil energy to useful work it is no surprise that we don’t need the same amount of electricity output to replace it but rather something like only 30% to 50% as much.
When it comes to synthetically generated “electric fuels” (power to liquids or hydrogen) we are talking about an up to 200% replacement ratio because up to 50% of the electricity is lost in the conversion of power to liquids. But for most other purposes like electrifying transportation and replacing the burning of fossil fuels for power etc. the replacement ratio is often more like 30% to 50%. When it comes to replacing gas for heating purposes it is a one-to-one replacement.
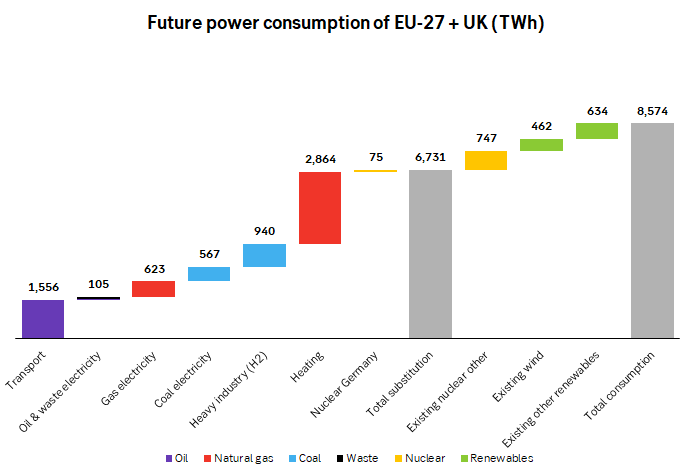
In our calculations the region is going to need 6,731 TWh of new non-fossil based electricity by 2050 in order to replace the 15,000 TWh worth (pre-combustion) of fossil energy spent today. I.e. a replacement ratio of 46%. It is thus good news that we don’t need at total of 15,000 TWh of new non-fossil based power supply by 2050 but instead “only” 6,731 TWh.
This replacement is still huge! In comparison the supply of electricity in 2019 was 3,200 TWh (including fossil based power). I.e. the region needs to build its total power supply of today more than two times over by 2050 and at that point in time reach a total power supply of 8,574 TWh.
If we equate the challenge to the number of nuclear power units needed to cover it we are talking 570 new nuclear power units each of 1,500 MW capacity. In 2013 there were 131 operational nuclear power plants and today we are probably closer to 110. Thus to do the job by nuclear we need to increase nuclear power by more than 500% by 2050.
While the job is challenging it is by no means impossible. If we take the new UK Hinkley nuclear power plant as an example in terms of capex we have the following. It will generate about 25 TWh of electricity per year and cost about € 27 bn to build. I.e. €1.1 bn for a 1 TWh/year supply rate. Multiply by the needed 6,731 TWh/year of new power supply by 2050 and we get a needed capex € 7,147 bn in total which again equates to € 238 bn/yr over the next 30 years. Nuclear power is today considered to be a quite expensive source of new electricity with renewable energy often being significantly cheaper (up to 50% cheaper) though not providing baseload supply and rather intermittent supply.
Capex spending in the EU + UK should be in the ball-park of € 150 – 250 bn per year or 1.3% of GDP. Capex spending on new power supply over the coming 30 years should probably be in the ball-park of $ 150 – 250bn/year. And then some additional investments for a lot of infrastructure adaptation. EU and UK thus needs to spend some 1.3% of its GDP per year for the energy transition (€ 238 bn/yr divided by GDP of € 18,292 bn in 2019). But that of course assumes that there is no further declines in the cost of new renewable energy which by most measures is projected to continue to fall year by year. And going electric in the transportation sector (on land) will in not too long be a pure net saving as electric cars becomes cheaper than fossil cars while electric cars are also much more energy efficient than fossil cars.
The example of nuclear energy is for simplicity purposes. It is not in the cards at all today that the region is going big-time nuclear. The direction is rather much more renewable energy.
On the table we already have a pledge of 2,100 TWh/year of offshore wind by 2050. On the drawing table we already have an announced build-out of 300 GW of new offshore wind by the EU and 100 GW of offshore wind by the UK. Both by 2050. What does that mean? At a 60% offshore wind utilization ratio this equates to 2,100 TWh/year of new power supply by 2050. Thus already today a total of 31% of the new, needed 6,731 TWh by 2050 is firmly on the drawing table.
For many decades there has been endless political discussions about climate change. As a result we have moved a little forward but not all that much. We have gotten the European emission trading scheme (EU ETS) which is good and where we now have a decent carbon price of € 42/ton which starts to matter and where abatement (carbon reductions) is happening on the margin.
We have now come to the point where it is all bout getting the job done. To actually build what needs to be replaced. However, we have now gotten to the point of crunch-time. The time to act. The time to start the real change. Now it is about figuring out how to get to zero by 2050. Now it is all about getting the job done for real. Our sense is that thousands of engineers across Europe today suddenly are mapping out detailed plans of what we actually need to do to get there. It is not easy. It does not happen by itself. But it is absolutely doable and it will require some €150 – 250/bn per year in capex spending on new non-fossil based power supply over the next 30 years. But probably less than that as the cost of renewable energy continues to decline.
The region is not going to get to zero by 2050 by marginal abatement in the EU ETS emission system. The region is going to get there by outright building the alternative and then increasingly retiring the current system. And what it looks like already is that offshore wind is going to be a major part of the solution with plans already in place to solve 30% of the challenge.
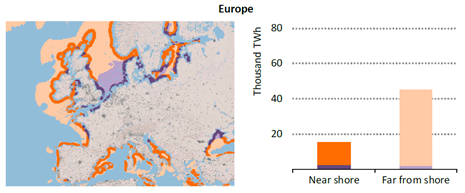
IEA estimated in a report from 2019 that technical offshore wind power resources in Europe is 60,000 TWh worth of power supply. That is almost 10 times as much as what is needed to solve EU + UK’s goal of zero emissions by 2050. And as stated above the two have already committed to build 2,100 TWh/year of offshore wind power supply by 2050. So on the drawing table we are already one third of the way.
Norway is not really on the map here yet but it could easily offer to build 2,000 TWh of offshore wind power supply if EU agreed to buy it and pay for it at an agreeable price. If so this would lead to a real offshore wind bonanza over the coming 30 years equal to the build-out of the oil and gas on the NCS.
The EU + UK needs to kick the habit of consuming close to 15,000 TWh worth of fossil fuels per year by 2050 (evaluated pre-combustion). The replacement is going to happen by building the alternative and governments will be involved big-time to get it done. The current power supply for the region needs to be build more than two times over by 2050 to get the job done.
The EU + UK produced a total of 3,200 TWh of power in 2019 of which 1,295 TWh (40%) was generated by fossil fuels. In total the EU + UK will need 6,731 TWh of new non-fossil based power supply by 2050 in order to kick 15,000 worth of fossil fuels (evaluated pre-combustion) out the door. At that point total power supply in the region needs to be 8,574 TWh/year in order for the region to go green. Of the 6,731 TWh of new non-fossil power needed we already have a pledge by the EU and the UK together of 2,100 TWh of new offshore wind power supply by 2050. Thus 31% of the power needed to go fully green by 2050 is already pledged for through offshore wind. In the following graph ”EU” is short of ”EU+UK” for the sake of abbreviation.

The following graph shows how much new non-emitting power supply the EU + UK needs for each sector to go electric and green by 2050. Today’s consumption of 15,000 TWh (pre-combustion) is mostly outside of the power sector. Some 1,900 TWh of current power supply can be kept for the future as it is non-emitting like nuclear, wind and other renewables. Total non-emitting power supply in the region needs to be 8,574 TWh by 2050 in order to go green.
Technical offshore wind potential in Europe is close to 60,000 TWh per year according to a recent report by the IEA published in November 2019. Almost 10x of what the EU + UK needs to go fully green by 2050. And much of the capacity is in the North Sea between the UK and Norway.

The latest weekly report from the US DOE showed a substantial drawdown across key petroleum categories, adding more upside potential to the fundamental picture.

Commercial crude inventories (excl. SPR) fell by 5.8 million barrels, bringing total inventories down to 415.1 million barrels. Now sitting 11% below the five-year seasonal norm and placed in the lowest 2015-2022 range (see picture below).
Product inventories also tightened further last week. Gasoline inventories declined by 2.1 million barrels, with reductions seen in both finished gasoline and blending components. Current gasoline levels are about 3% below the five-year average for this time of year.
Among products, the most notable move came in diesel, where inventories dropped by almost 4.1 million barrels, deepening the deficit to around 20% below seasonal norms – continuing to underscore the persistent supply tightness in diesel markets.
The only area of inventory growth was in propane/propylene, which posted a significant 5.1-million-barrel build and now stands 9% above the five-year average.
Total commercial petroleum inventories (crude plus refined products) declined by 4.2 million barrels on the week, reinforcing the overall tightening of US crude and products.


A classic case of “buy the rumor, sell the news” played out in oil markets, as Brent crude has dropped sharply – down nearly USD 10 per barrel since yesterday evening – following Iran’s retaliatory strike on a U.S. air base in Qatar. The immediate reaction was: “That was it?” The strike followed a carefully calibrated, non-escalatory playbook, avoiding direct threats to energy infrastructure or disruption of shipping through the Strait of Hormuz – thus calming worst-case fears.
After Monday morning’s sharp spike to USD 81.4 per barrel, triggered by the U.S. bombing of Iranian nuclear facilities, oil prices drifted sideways in anticipation of a potential Iranian response. That response came with advance warning and caused limited physical damage. Early this morning, both the U.S. President and Iranian state media announced a ceasefire, effectively placing a lid on the immediate conflict risk – at least for now.
As a result, Brent crude has now fallen by a total of USD 12 from Monday’s peak, currently trading around USD 69 per barrel.
Looking beyond geopolitics, the market will now shift its focus to the upcoming OPEC+ meeting in early July. Saudi Arabia’s decision to increase output earlier this year – despite falling prices – has drawn renewed attention considering recent developments. Some suggest this was a response to U.S. pressure to offset potential Iranian supply losses.
However, consensus is that the move was driven more by internal OPEC+ dynamics. After years of curbing production to support prices, Riyadh had grown frustrated with quota-busting by several members (notably Kazakhstan). With Saudi Arabia cutting up to 2 million barrels per day – roughly 2% of global supply – returns were diminishing, and the risk of losing market share was rising. The production increase is widely seen as an effort to reassert leadership and restore discipline within the group.
That said, the FT recently stated that, the Saudis remain wary of past missteps. In 2018, Riyadh ramped up output at Trump’s request ahead of Iran sanctions, only to see prices collapse when the U.S. granted broad waivers – triggering oversupply. Officials have reportedly made it clear they don’t intend to repeat that mistake.
The recent visit by President Trump to Saudi Arabia, which included agreements on AI, defense, and nuclear cooperation, suggests a broader strategic alignment. This has fueled speculation about a quiet “pump-for-politics” deal behind recent production moves.
Looking ahead, oil prices have now retraced the entire rally sparked by the June 13 Israel–Iran escalation. This retreat provides more political and policy space for both the U.S. and Saudi Arabia. Specifically, it makes it easier for Riyadh to scale back its three recent production hikes of 411,000 barrels each, potentially returning to more moderate increases of 137,000 barrels for August and September.
In short: with no major loss of Iranian supply to the market, OPEC+ – led by Saudi Arabia – no longer needs to compensate for a disruption that hasn’t materialized, especially not to please the U.S. at the cost of its own market strategy. As the Saudis themselves have signaled, they are unlikely to repeat previous mistakes.
Conclusion: With Brent now in the high USD 60s, buying oil looks fundamentally justified. The geopolitical premium has deflated, but tensions between Israel and Iran remain unresolved – and the risk of missteps and renewed escalation still lingers. In fact, even this morning, reports have emerged of renewed missile fire despite the declared “truce.” The path forward may be calmer – but it is far from stable.
Analys
A muted price reaction. Market looks relaxed, but it is still on edge waiting for what Iran will do
Brent crossed the 80-line this morning but quickly fell back assigning limited probability for Iran choosing to close the Strait of Hormuz. Brent traded in a range of USD 70.56 – 79.04/b last week as the market fluctuated between ”Iran wants a deal” and ”US is about to attack Iran”. At the end of the week though, Donald Trump managed to convince markets (and probably also Iran) that he would make a decision within two weeks. I.e. no imminent attack. Previously when when he has talked about ”making a decision within two weeks” he has often ended up doing nothing in the end. The oil market relaxed as a result and the week ended at USD 77.01/b which is just USD 6/b above the year to date average of USD 71/b.

Brent jumped to USD 81.4/b this morning, the highest since mid-January, but then quickly fell back to a current price of USD 78.2/b which is only up 1.5% versus the close on Friday. As such the market is pricing a fairly low probability that Iran will actually close the Strait of Hormuz. Probably because it will hurt Iranian oil exports as well as the global oil market.
It was however all smoke and mirrors. Deception. The US attacked Iran on Saturday. The attack involved 125 warplanes, submarines and surface warships and 14 bunker buster bombs were dropped on Iranian nuclear sites including Fordow, Natanz and Isfahan. In response the Iranian Parliament voted in support of closing the Strait of Hormuz where some 17 mb of crude and products is transported to the global market every day plus significant volumes of LNG. This is however merely an advise to the Supreme leader Ayatollah Ali Khamenei and the Supreme National Security Council which sits with the final and actual decision.
No supply of oil is lost yet. It is about the risk of Iran closing the Strait of Hormuz or not. So far not a single drop of oil supply has been lost to the global market. The price at the moment is all about the assessed risk of loss of supply. Will Iran choose to choke of the Strait of Hormuz or not? That is the big question. It would be painful for US consumers, for Donald Trump’s voter base, for the global economy but also for Iran and its population which relies on oil exports and income from selling oil out of that Strait as well. As such it is not a no-brainer choice for Iran to close the Strait for oil exports. And looking at the il price this morning it is clear that the oil market doesn’t assign a very high probability of it happening. It is however probably well within the capability of Iran to close the Strait off with rockets, mines, air-drones and possibly sea-drones. Just look at how Ukraine has been able to control and damage the Russian Black Sea fleet.
What to do about the highly enriched uranium which has gone missing? While the US and Israel can celebrate their destruction of Iranian nuclear facilities they are also scratching their heads over what to do with the lost Iranian nuclear material. Iran had 408 kg of highly enriched uranium (IAEA). Almost weapons grade. Enough for some 10 nuclear warheads. It seems to have been transported out of Fordow before the attack this weekend.
The market is still on edge. USD 80-something/b seems sensible while we wait. The oil market reaction to this weekend’s events is very muted so far. The market is still on edge awaiting what Iran will do. Because Iran will do something. But what and when? An oil price of 80-something seems like a sensible level until something do happen.


Sommarvädret styr elpriset i Sverige

Samtal om flera delar av råvarumarknaden
Tightening fundamentals – bullish inventories from DOE

Jonas Lindvall är tillbaka med ett nytt oljebolag, Perthro, som ska börsnoteras

Oljan, guldet och marknadens oroande tystnad

Stor uppsida i Lappland Guldprospekterings aktie enligt analys

Brookfield ska bygga ett AI-datacenter på hela 750 MW i Strängnäs
Silverpriset släpar efter guldets utveckling, har mer uppsida

Uppgången i oljepriset planade ut under helgen

Låga elpriser i sommar – men mellersta Sverige får en ökning
-
 Nyheter3 veckor sedan
Stor uppsida i Lappland Guldprospekterings aktie enligt analys
-
 Nyheter4 veckor sedan
Brookfield ska bygga ett AI-datacenter på hela 750 MW i Strängnäs
-
 Nyheter3 veckor sedan
Silverpriset släpar efter guldets utveckling, har mer uppsida
-
 Nyheter3 veckor sedan
Uppgången i oljepriset planade ut under helgen
-
 Nyheter3 veckor sedan
Låga elpriser i sommar – men mellersta Sverige får en ökning
-
Analys3 veckor sedan
Very relaxed at USD 75/b. Risk barometer will likely fluctuate to higher levels with Brent into the 80ies or higher coming 2-3 weeks
-

 Nyheter2 veckor sedan
Mahvie Minerals växlar spår – satsar fullt ut på guld
-
 Nyheter1 vecka sedan
Oljan, guldet och marknadens oroande tystnad