

Analys
Crude oil higher as Hurricanes disrupt crude supply rather than crude demand (refinery processing of crude)

 Crude oil comment – Crude oil higher as Hurricanes disrupt crude supply rather than crude demand (refinery processing of crude)
All since the end of July we have seen Brent crude trading fairly range bound between $50/b and $53.64/b. This week it broke upwards out of this trend. Brent crude hit an intraday low of $50.58/b last Wednesday on the fear that Hurricane Harvey would disrupt U.S. Gulf refineries’ consumption of crude oil for a lengthy period of time. I.e. lower refinery activity would give lower crude consumption and thus lower crude prices. When refineries gave signals that damage was not too great and restarts were on the table then Brent crude rose back up and then continued higher.
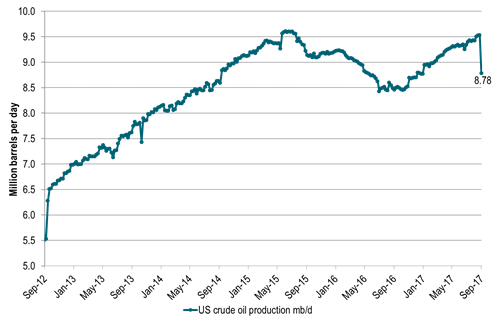
While the fear last week was for reduced oil processing by refineries due to hurricane Harvey, the coin has now flipped. Now the concern is that this may be a heavy hurricane season with the risk of substantial disruptions to crude oil production in the Gulf of Mexico. The US EIA yesterday reported that US crude oil production last week was down 749 kb/d WoW to 8,781 kb/d which is the lowest since December last year.
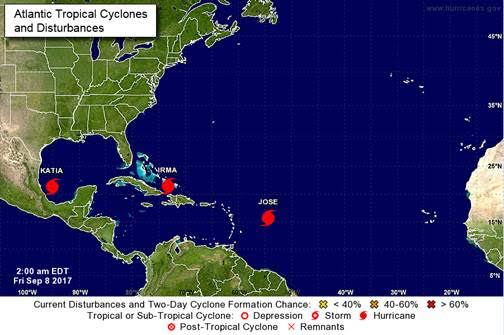
Following Harvey we now have Katia, Irma and Jose queuing up with Irma of course getting most attention as it leaves devastation in its trail as it heads for Florida. What we have seen of hurricanes so far this season may of course not be a good predictor for the rest of the hurricane season but it still setts the mind to expect more of the same. I.e. potentially more disruptions of supply.
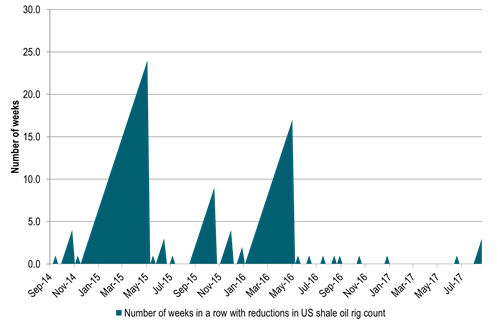
The take from the sell-off down to $50.58/b last week is that there is little risk to the downside of $50/b at the moment. The Saudi oil put is firmly in place. Cutting exports to 6.6 mb/d in August (lowest since 2011), lifting official selling prices for all grades for October delivery while stating that Saudi Arabia goes full ahead for the Aramco IPO in 2018. They are not dropping the ball anytime soon. In addition we have seen the implied US shale oil rig count declining three weeks in a row now for the first time since May 2016.
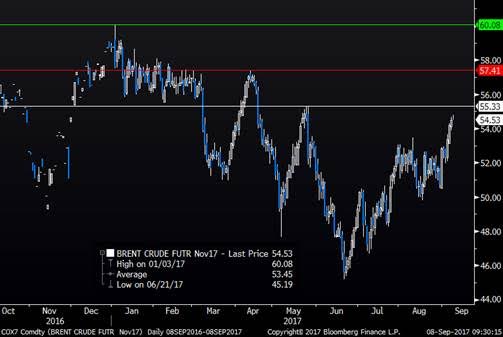
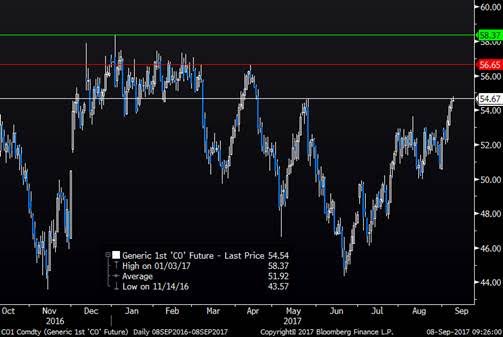
On the upside price action the market will now look at technical references. I.e. highs from earlier in 2017 both for the Brent November contract as well as for the rolling 1mth Brent contract. For the November contract we have $55.33/b (25th May), $57.41/b (12th April) and then $60.08/b (3rd Jan). In references to historical values for the front end rolling Brent contract we comparably have $54.67/b (25th May, but already reached yesterday), $56.65/b (12th April) and then $58.37/b (3rd Jan).
The ball is definitely in the court of the bulls at the moment and the price action is looking towards earlier highs this year. However, when we look forward towards 2018 we do have concerns for the global oil market balance.
We expect US crude and NGL production growth to be very strong with lots of drilled but uncompleted wells ready to be completed. The declining drilling rig count right now is thus more a bullish sentiment driver than having a strong fundamental value. Combined with a still high level of commissioning of legacy non-OPEC crude oil production in 2018 we foresee the need for production management by OPEC+ all through 2018.
Thus bullish price moves this autumn towards the higher end of the $50ies/b should be utilized for those who need to hedge the downside price risk for 2018. When the Aramco IPO is done or if OPEC+ falls apart there is definitely downside price risk on the table in 2018. We must not forget that the current market tightness with declining oil inventories is as of now artificially managed by OPEC+. If it had not been for OPEC+ we would have been running a surplus.
This evening we again have the weekly US rig count data at 19.00 CET. We expect to see yet another week of declining US shale oil rig count. Sentiment wise it should help Brent crude to take out highs from earlier in 2017.
Ch1: Hurricane Harvey is taking out supply, not just demand
Ch2: Three weeks in a row of declining US shale oil rig count (implied)
Now three weeks in a row for the first time since May 2016
Ch3: Brent crude goal One: $55.33/b
Brent crude November contract price references from earlier in 2017
$55.33/b highlighted as next in line to reach for the Nov Brent contract
Ch4: Brent crude goal two and three: $56.65/b and then $58.37/b
Brent crude rolling front month price references from earlier in 2017
Bulls eying high of the year from Jan 3rd at $58.37/b
Ch5: Three hurricanes now in action
Is this what we should expect for the rest of the hurricane season?
More dissruptions to come all through the season?
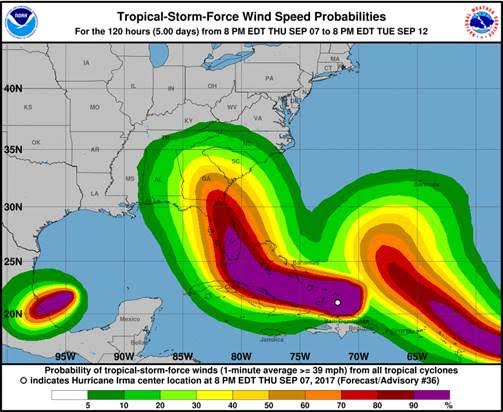
Ch6: With Irma soon to make landfall but with not too much impact on oil infrastructure
Kind regards
Bjarne Schieldrop
Chief analyst, Commodities
SEB Markets
Merchant Banking
Some rebound but not much. Brent crude rebounded 1.5% yesterday to $65.47/b. This morning it is inching 0.2% up to $65.6/b. The lowest close last week was on Thursday at $64.11/b.

The curve structure is almost as week as it was before the weekend. The rebound we now have gotten post the message from OPEC+ over the weekend is to a large degree a rebound along the curve rather than much strengthening at the front-end of the curve. That part of the curve structure is almost as weak as it was last Thursday.
We are still on a weakening path. The message from OPEC+ over the weekend was we are still on a weakening path with rising supply from the group. It is just not as rapidly weakening as was feared ahead of the weekend when a quota hike of 500 kb/d/mth for November was discussed.
The Brent curve is on its way to full contango with Brent dipping into the $50ies/b. Thus the ongoing weakening we have had in the crude curve since the start of the year, and especially since early June, will continue until the Brent crude oil forward curve is in full contango along with visibly rising US and OECD oil inventories. The front-month Brent contract will then flip down towards the $60/b-line and below into the $50ies/b.
At what point will OPEC+ turn to cuts? The big question then becomes: When will OPEC+ turn around to make some cuts? At what (price) point will they choose to stabilize the market? Because for sure they will. Higher oil inventories, some more shedding of drilling rigs in US shale and Brent into the 50ies somewhere is probably where the group will step in.
There is nothing we have seen from the group so far which indicates that they will close their eyes, let the world drown in oil and the oil price crash to $40/b or below.
The message from OPEC+ is also about balance and stability. The world won’t drown in oil in 2026. The message from the group as far as we manage to interpret it is twofold: 1) Taking back market share which requires a lower price for non-OPEC+ to back off a bit, and 2) Oil market stability and balance. It is not just about 1. Thus fretting about how we are all going to drown in oil in 2026 is totally off the mark by just focusing on point 1.
When to buy cal 2026? Before Christmas when Brent hits $55/b and before OPEC+ holds its last meeting of the year which is likely to be in early December.
Brent crude oil prices have rebounded a bit along the forward curve. Not much strengthening in the structure of the curve. The front-end backwardation is not much stronger today than on its weakest level so far this year which was on Thursday last week.

The front-end backwardation fell to its weakest level so far this year on Thursday last week. A slight pickup yesterday and today, but still very close to the weakest year to date. More oil from OPEC+ in the coming months and softer demand and rising inventories. We are heading for yet softer levels.

Down to the lowest since early May. Brent crude has fallen sharply the latest four days. It closed at USD 64.11/b yesterday which is the lowest since early May. It is staging a 1.3% rebound this morning along with gains in both equities and industrial metals with an added touch of support from a softer USD on top.
What stands out the most to us this week is the collapse in the Dubai one to three months time-spread.
Dubai is medium sour crude. OPEC+ is in general medium sour crude production. Asian refineries are predominantly designed to process medium sour crude. So Dubai is the real measure of the balance between OPEC+ holding back or not versus Asian oil demand for consumption and stock building.
A sharp weakening of the front-end of the Dubai curve. The front-end of the Dubai crude curve has been holding out very solidly throughout this summer while the front-end of the Brent and WTI curves have been steadily softening. But the strength in the Dubai curve in our view was carrying the crude oil market in general. A source of strength in the crude oil market. The core of the strength.
The now finally sharp decline of the front-end of the Dubai crude curve is thus a strong shift. Weakness in the Dubai crude marker is weakness in the core of the oil market. The core which has helped to hold the oil market elevated.
Facts supports the weakening. Add in facts of Iraq lifting production from Kurdistan through Turkey. Saudi Arabia lifting production to 10 mb/d in September (normal production level) and lifting exports as well as domestic demand for oil for power for air con is fading along with summer heat. Add also in counter seasonal rise in US crude and product stocks last week. US oil stocks usually decline by 1.3 mb/week this time of year. Last week they instead rose 6.4 mb/week (+7.2 mb if including SPR). Total US commercial oil stocks are now only 2.1 mb below the 2015-19 seasonal average. US oil stocks normally decline from now to Christmas. If they instead continue to rise, then it will be strongly counter seasonal rise and will create a very strong bearish pressure on oil prices.
Will OPEC+ lift its voluntary quotas by zero, 137 kb/d, 500 kb/d or 1.5 mb/d? On Sunday of course OPEC+ will decide on how much to unwind of the remaining 1.5 mb/d of voluntary quotas for November. Will it be 137 kb/d yet again as for October? Will it be 500 kb/d as was talked about earlier this week? Or will it be a full unwind in one go of 1.5 mb/d? We think most likely now it will be at least 500 kb/d and possibly a full unwind. We discussed this in a not earlier this week: ”500 kb/d of voluntary quotas in October. But a full unwind of 1.5 mb/d”
The strength in the front-end of the Dubai curve held out through summer while Brent and WTI curve structures weakened steadily. That core strength helped to keep flat crude oil prices elevated close to the 70-line. Now also the Dubai curve has given in.

Brent crude oil forward curves

Total US commercial stocks now close to normal. Counter seasonal rise last week. Rest of year?

Total US crude and product stocks on a steady trend higher.

Analys
OPEC+ will likely unwind 500 kb/d of voluntary quotas in October. But a full unwind of 1.5 mb/d in one go could be in the cards
Down to mid-60ies as Iraq lifts production while Saudi may be tired of voluntary cut frugality. The Brent December contract dropped 1.6% yesterday to USD 66.03/b. This morning it is down another 0.3% to USD 65.8/b. The drop in the price came on the back of the combined news that Iraq has resumed 190 kb/d of production in Kurdistan with exports through Turkey while OPEC+ delegates send signals that the group will unwind the remaining 1.65 mb/d (less the 137 kb/d in October) of voluntary cuts at a pace of 500 kb/d per month pace.
Signals of accelerated unwind and Iraqi increase may be connected. Russia, Kazakhstan and Iraq were main offenders versus the voluntary quotas they had agreed to follow. Russia had a production ’debt’ (cumulative overproduction versus quota) of close to 90 mb in March this year while Kazakhstan had a ’debt’ of about 60 mb and the same for Iraq. This apparently made Saudi Arabia angry this spring. Why should Saudi Arabia hold back if the other voluntary cutters were just freeriding? Thus the sudden rapid unwinding of voluntary cuts. That is at least one angle of explanations for the accelerated unwinding.
If the offenders with production debts then refrained from lifting production as the voluntary cuts were rapidly unwinded, then they could ’pay back’ their ’debts’ as they would under-produce versus the new and steadily higher quotas.
Forget about Kazakhstan. Its production was just too far above the quotas with no hope that the country would hold back production due to cross-ownership of oil assets by international oil companies. But Russia and Iraq should be able to do it.
Iraqi cumulative overproduction versus quotas could reach 85-90 mb in October. Iraq has however steadily continued to overproduce by 3-5 mb per month. In July its new and gradually higher quota came close to equal with a cumulative overproduction of only 0.6 mb that month. In August again however its production had an overshoot of 100 kb/d or 3.1 mb for the month. Its cumulative production debt had then risen to close to 80 mb. We don’t know for September yet. But looking at October we now know that its production will likely average close to 4.5 mb/d due to the revival of 190 kb/d of production in Kurdistan. Its quota however will only be 4.24 mb/d. Its overproduction in October will thus likely be around 250 kb/d above its quota with its production debt rising another 7-8 mb to a total of close to 90 mb.
Again, why should Saudi Arabia be frugal while Iraq is freeriding. Better to get rid of the voluntary quotas as quickly as possible and then start all over with clean sheets.
Unwinding the remaining 1.513 mb/d in one go in October? If OPEC+ unwinds the remaining 1.513 mb/d of voluntary cuts in one big go in October, then Iraq’s quota will be around 4.4 mb/d for October versus its likely production of close to 4.5 mb/d for the coming month..
OPEC+ should thus unwind the remaining 1.513 mb/d (1.65 – 0.137 mb/d) in one go for October in order for the quota of Iraq to be able to keep track with Iraq’s actual production increase.
October 5 will show how it plays out. But a quota unwind of at least 500 kb/d for Oct seems likely. An overall increase of at least 500 kb/d in the voluntary quota for October looks likely. But it could be the whole 1.513 mb/d in one go. If the increase in the quota is ’only’ 500 kb/d then Iraqi cumulative production will still rise by 5.7 mb to a total of 85 mb in October.
Iraqi production debt versus quotas will likely rise by 5.7 mb in October if OPEC+ only lifts the overall quota by 500 kb/d in October. Here assuming historical production debt did not rise in September. That Iraq lifts its production by 190 kb/d in October to 4.47 mb/d (August level + 190 kb/d) and that OPEC+ unwinds 500 kb/d of the remining quotas in October when they decide on this on 5 October.


Teck Resources kan förse Nordamerika och kanske hela G7 med all germanium som behövs

Leading Edge Materials är på rätt plats i rätt tid

Oljepriset faller efter ny handelskonflikt mellan USA och Kina

Christian Kopfer kommenterar guld, koppar, olja och stål, samt några råvarubolag

Silver spränger den magiska gränsen, kostar nu över 50 USD per uns

Kinas elproduktion slog nytt rekord i augusti, vilket även kolkraft gjorde

Tyskland har så höga elpriser att företag inte har råd att använda elektricitet

Det stigande guldpriset en utmaning för smyckesköpare

Ett samtal om guld, olja, fjärrvärme och förnybar energi

OPEC+ missar produktionsmål, stöder oljepriserna
-
 Nyheter4 veckor sedan
Kinas elproduktion slog nytt rekord i augusti, vilket även kolkraft gjorde
-
Nyheter4 veckor sedan
Tyskland har så höga elpriser att företag inte har råd att använda elektricitet
-
 Nyheter4 veckor sedan
Det stigande guldpriset en utmaning för smyckesköpare
-
 Nyheter3 veckor sedan
Ett samtal om guld, olja, fjärrvärme och förnybar energi
-
 Nyheter2 veckor sedan
OPEC+ missar produktionsmål, stöder oljepriserna
-
Analys4 veckor sedan
Brent crude ticks higher on tension, but market structure stays soft
-
Analys3 veckor sedan
Are Ukraine’s attacks on Russian energy infrastructure working?
-

 Nyheter1 vecka sedan
Guld nära 4000 USD och silver 50 USD, därför kan de fortsätta stiga