

Analys
Brent crude in non-USD as expensive as in 2011 to 2014

 In order to reach a consensus and keep the OPEC+ group united the latest proposal on the table for the upcoming meeting of OPEC+ on Friday and Saturday in Vienna is a modest increase of 300 to 600 k bl/d in 2H1. The proposal before the weekend by Saudi Arabia and Russia was an increase of 1.5 m bl/d. What is most imperative in our view is that the group is adaptive to market conditions going forward. Uncertainties on both the supply side and the demand side are significant. In the eyes of emerging markets (but also Norway) the oil price in local currency is today as high as it was when Brent traded at $110/bl from 2011 to 2014 with demand destruction naturally setting in at such a cost level. Rapidly escalating US – China trade tension is adding to global growth headwinds. With large uncertainties on the supply side the group should stay ready to increase production in order to avoid escalating pain for the consumers.

Bjarne Schieldrop, Chief analyst commodities
It turns out that Donald Trump’s tweets over the past months that “OPEC is at it again creating artificially high prices” are not just a whim. It is actually one of his core views going back more than 30 years. US lawmakers have tried to pass the NOPEC bill (“Non Oil Producing and Exporting Cartels Act”) for years. It will allow the US Government to sue OPEC for oil market manipulation. Earlier attempts to pass the bill have been blocked by President vetoes. Donald is however one of the big supporters of the bill. This bill is now rolling towards OPEC+ and the group certainly do not want to stir the pot by holding back to much oil creating too high prices.
Price action – Rebounding 2.6% ydy as OPEC+ seen to aim for modest compromise. Sinking back on trade war today
Following Friday’s 3.3% sharp sell-off on the back of Saudi Arabia’s comment that an increase in production is “inevitable” the Brent price yesterday rebounded 2.6% to $75.34/bl as the group was seen to aim for a modest compromise. An increase of 1.5 m bl/d has earlier been seen as the proposal by Russia and Saudi Arabia while the latest proposal said to be discussed is an output hike of 300 to 600 k bl/d. This helped the Brent price to rebound yesterday. This morning Brent is pulling back 0.6% to $74.9/bl following the queue of the sharp sell-off in Asian equities on fear that Donald Trump will add tariffs on an additional $200 billion worth of Chinese goods exported to the US.
Aiming for a compromise but adaption to market conditions will be key
In order to hold the OPEC+ group together and appease Iran, Iraq and Venezuela who have strongly opposed any increase in production the group now seems to aim for a compromise of a modest increase of 300 to 600 k bl/d at the upcoming meeting on Friday and Saturday this week. It has all the time been argued that any revival in production will be gradual and adapted to market conditions. To be reactive and adaptive to market conditions seems to be even more important now due to significant uncertainties for both supply and demand.
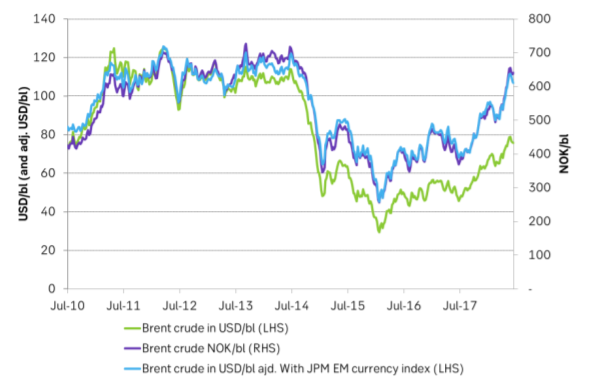
The global economy ex the US has been cooling since the start of the year and the US – China trade tension is escalating rapidly with an additional $200 billion worth of exports to the US at risk of getting tariffs. This is not good for global growth and for oil demand growth. The strengthening of the USD, especially versus emerging markets is bad both for global growth and for oil demand growth. An oil price of $75/bl seems fairly modest, neither too hot nor too cold. However, if we measure it in local currencies like the Norwegian krone the oil price now is just as high as it was during the period 2011 to 2014 when Brent crude was trading at around $110/bl. The same goes if we take JPM’s EM currency index and adjust Brent crude prices from July 2010. So in the eyes of the emerging market consumers the oil price today is just as expensive as it was during the 2011 to 2014 period. That means that demand destruction is naturally setting in at these prices for the EM’s. And, since EM’s holds the lion’s share of the world’s oil demand growth this is probably not insignificant. It is thus highly important that OPEC+ is sensitive, adaptive and reactive to oil demand conditions going forward.
The supply side is of course just as challenging to gauge as production in Venezuela is declining rapidly but could as well disrupt entirely and unpredictably. US sanctions towards Iran, a sharp decline in Nigeria’s production in June and increasing violence in Libya where the destruction of two of five crude storage tanks at Ras Lanuf“ may take years” to rebuild are all contributing to a highly unpredictable supply.
For a large share of the world’s consumers the oil price is already as high as it was during 2011 to 2014 and OPEC+ does definitely not want to risk that the oil price moves yet higher as the world economy is already facing challenges. Thus adaptivity to market conditions must be the most imperative goal of OPEC+ at the upcoming meeting this week as the goal of getting OECD inventories down to the rolling five year average has been reached. Thus aim for moderate increase in 2H18, but increase more if needed.
Ch1: The oil price for emerging markets is just as high today as it was in 2011 to 2014
Thus demand destruction is naturally setting in at such a price level with weakness in demand as a result
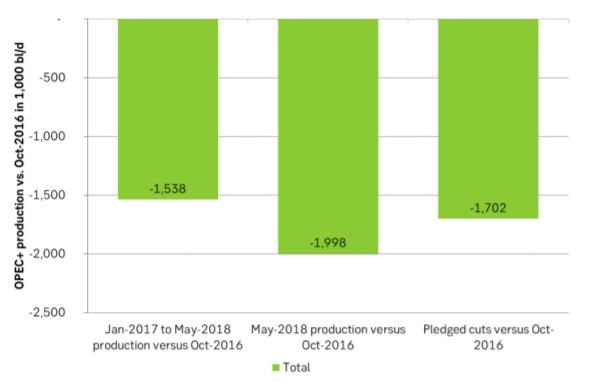
Ch2: OPEC+ produced 2 m bl/d less in May than it did in October 2016
On average since the start of 2017 the group has delivered net cuts of 1.5 m bl/d and slightly less than the pledged 1.7 m bl/d
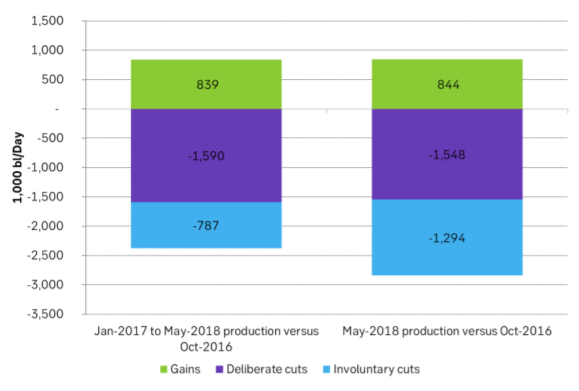
Ch3: But deliberate cuts were only 1.55 m bl/d while involuntary cuts amounted to 1.3 m bl/d

The latest weekly report from the US DOE showed a substantial drawdown across key petroleum categories, adding more upside potential to the fundamental picture.

Commercial crude inventories (excl. SPR) fell by 5.8 million barrels, bringing total inventories down to 415.1 million barrels. Now sitting 11% below the five-year seasonal norm and placed in the lowest 2015-2022 range (see picture below).
Product inventories also tightened further last week. Gasoline inventories declined by 2.1 million barrels, with reductions seen in both finished gasoline and blending components. Current gasoline levels are about 3% below the five-year average for this time of year.
Among products, the most notable move came in diesel, where inventories dropped by almost 4.1 million barrels, deepening the deficit to around 20% below seasonal norms – continuing to underscore the persistent supply tightness in diesel markets.
The only area of inventory growth was in propane/propylene, which posted a significant 5.1-million-barrel build and now stands 9% above the five-year average.
Total commercial petroleum inventories (crude plus refined products) declined by 4.2 million barrels on the week, reinforcing the overall tightening of US crude and products.


A classic case of “buy the rumor, sell the news” played out in oil markets, as Brent crude has dropped sharply – down nearly USD 10 per barrel since yesterday evening – following Iran’s retaliatory strike on a U.S. air base in Qatar. The immediate reaction was: “That was it?” The strike followed a carefully calibrated, non-escalatory playbook, avoiding direct threats to energy infrastructure or disruption of shipping through the Strait of Hormuz – thus calming worst-case fears.
After Monday morning’s sharp spike to USD 81.4 per barrel, triggered by the U.S. bombing of Iranian nuclear facilities, oil prices drifted sideways in anticipation of a potential Iranian response. That response came with advance warning and caused limited physical damage. Early this morning, both the U.S. President and Iranian state media announced a ceasefire, effectively placing a lid on the immediate conflict risk – at least for now.
As a result, Brent crude has now fallen by a total of USD 12 from Monday’s peak, currently trading around USD 69 per barrel.
Looking beyond geopolitics, the market will now shift its focus to the upcoming OPEC+ meeting in early July. Saudi Arabia’s decision to increase output earlier this year – despite falling prices – has drawn renewed attention considering recent developments. Some suggest this was a response to U.S. pressure to offset potential Iranian supply losses.
However, consensus is that the move was driven more by internal OPEC+ dynamics. After years of curbing production to support prices, Riyadh had grown frustrated with quota-busting by several members (notably Kazakhstan). With Saudi Arabia cutting up to 2 million barrels per day – roughly 2% of global supply – returns were diminishing, and the risk of losing market share was rising. The production increase is widely seen as an effort to reassert leadership and restore discipline within the group.
That said, the FT recently stated that, the Saudis remain wary of past missteps. In 2018, Riyadh ramped up output at Trump’s request ahead of Iran sanctions, only to see prices collapse when the U.S. granted broad waivers – triggering oversupply. Officials have reportedly made it clear they don’t intend to repeat that mistake.
The recent visit by President Trump to Saudi Arabia, which included agreements on AI, defense, and nuclear cooperation, suggests a broader strategic alignment. This has fueled speculation about a quiet “pump-for-politics” deal behind recent production moves.
Looking ahead, oil prices have now retraced the entire rally sparked by the June 13 Israel–Iran escalation. This retreat provides more political and policy space for both the U.S. and Saudi Arabia. Specifically, it makes it easier for Riyadh to scale back its three recent production hikes of 411,000 barrels each, potentially returning to more moderate increases of 137,000 barrels for August and September.
In short: with no major loss of Iranian supply to the market, OPEC+ – led by Saudi Arabia – no longer needs to compensate for a disruption that hasn’t materialized, especially not to please the U.S. at the cost of its own market strategy. As the Saudis themselves have signaled, they are unlikely to repeat previous mistakes.
Conclusion: With Brent now in the high USD 60s, buying oil looks fundamentally justified. The geopolitical premium has deflated, but tensions between Israel and Iran remain unresolved – and the risk of missteps and renewed escalation still lingers. In fact, even this morning, reports have emerged of renewed missile fire despite the declared “truce.” The path forward may be calmer – but it is far from stable.
Analys
A muted price reaction. Market looks relaxed, but it is still on edge waiting for what Iran will do
Brent crossed the 80-line this morning but quickly fell back assigning limited probability for Iran choosing to close the Strait of Hormuz. Brent traded in a range of USD 70.56 – 79.04/b last week as the market fluctuated between ”Iran wants a deal” and ”US is about to attack Iran”. At the end of the week though, Donald Trump managed to convince markets (and probably also Iran) that he would make a decision within two weeks. I.e. no imminent attack. Previously when when he has talked about ”making a decision within two weeks” he has often ended up doing nothing in the end. The oil market relaxed as a result and the week ended at USD 77.01/b which is just USD 6/b above the year to date average of USD 71/b.

Brent jumped to USD 81.4/b this morning, the highest since mid-January, but then quickly fell back to a current price of USD 78.2/b which is only up 1.5% versus the close on Friday. As such the market is pricing a fairly low probability that Iran will actually close the Strait of Hormuz. Probably because it will hurt Iranian oil exports as well as the global oil market.
It was however all smoke and mirrors. Deception. The US attacked Iran on Saturday. The attack involved 125 warplanes, submarines and surface warships and 14 bunker buster bombs were dropped on Iranian nuclear sites including Fordow, Natanz and Isfahan. In response the Iranian Parliament voted in support of closing the Strait of Hormuz where some 17 mb of crude and products is transported to the global market every day plus significant volumes of LNG. This is however merely an advise to the Supreme leader Ayatollah Ali Khamenei and the Supreme National Security Council which sits with the final and actual decision.
No supply of oil is lost yet. It is about the risk of Iran closing the Strait of Hormuz or not. So far not a single drop of oil supply has been lost to the global market. The price at the moment is all about the assessed risk of loss of supply. Will Iran choose to choke of the Strait of Hormuz or not? That is the big question. It would be painful for US consumers, for Donald Trump’s voter base, for the global economy but also for Iran and its population which relies on oil exports and income from selling oil out of that Strait as well. As such it is not a no-brainer choice for Iran to close the Strait for oil exports. And looking at the il price this morning it is clear that the oil market doesn’t assign a very high probability of it happening. It is however probably well within the capability of Iran to close the Strait off with rockets, mines, air-drones and possibly sea-drones. Just look at how Ukraine has been able to control and damage the Russian Black Sea fleet.
What to do about the highly enriched uranium which has gone missing? While the US and Israel can celebrate their destruction of Iranian nuclear facilities they are also scratching their heads over what to do with the lost Iranian nuclear material. Iran had 408 kg of highly enriched uranium (IAEA). Almost weapons grade. Enough for some 10 nuclear warheads. It seems to have been transported out of Fordow before the attack this weekend.
The market is still on edge. USD 80-something/b seems sensible while we wait. The oil market reaction to this weekend’s events is very muted so far. The market is still on edge awaiting what Iran will do. Because Iran will do something. But what and when? An oil price of 80-something seems like a sensible level until something do happen.


USA ska införa 50 procent tull på koppar

Ryska staten siktar på att konfiskera en av landets största guldproducenter

Hur säkrar vi Sveriges tillgång till kritiska metaller och mineral i en ny geopolitisk verklighet?

Lundin Mining ska bli en av de tio största kopparproducenterna i världen

Sommarvädret styr elpriset i Sverige

Uppgången i oljepriset planade ut under helgen

Mahvie Minerals växlar spår – satsar fullt ut på guld

Låga elpriser i sommar – men mellersta Sverige får en ökning

Oljan, guldet och marknadens oroande tystnad
Very relaxed at USD 75/b. Risk barometer will likely fluctuate to higher levels with Brent into the 80ies or higher coming 2-3 weeks
-
 Nyheter4 veckor sedan
Uppgången i oljepriset planade ut under helgen
-
 Nyheter3 veckor sedan
Mahvie Minerals växlar spår – satsar fullt ut på guld
-
 Nyheter4 veckor sedan
Låga elpriser i sommar – men mellersta Sverige får en ökning
-
 Nyheter2 veckor sedan
Oljan, guldet och marknadens oroande tystnad
-
Analys4 veckor sedan
Very relaxed at USD 75/b. Risk barometer will likely fluctuate to higher levels with Brent into the 80ies or higher coming 2-3 weeks
-

 Nyheter2 veckor sedan
Jonas Lindvall är tillbaka med ett nytt oljebolag, Perthro, som ska börsnoteras
-
Analys3 veckor sedan
A muted price reaction. Market looks relaxed, but it is still on edge waiting for what Iran will do
-

 Nyheter2 veckor sedan
Domstolen ger klartecken till Lappland Guldprospektering