

Analys
Brent crude again heading towards the $60/bl danger-zone


Following its intraday low of $59.45/bl last week the Brent August contract staged a mild rebound this week and reached an intraday high of $64.1/bl on Monday before falling back down again. This morning it is selling off 1.9% to $61.1/bl on numbers from API last night indicating that US crude oil inventories probably rose 4.85 m bl last week.

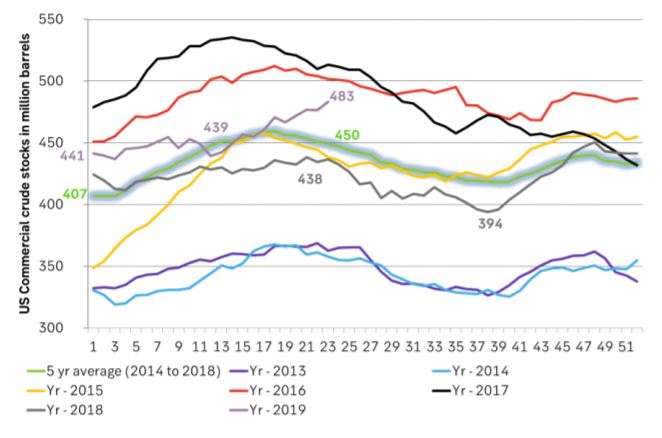
US crude stocks have been rising almost uninterrupted since mid-march. Until late April that was partially along a seasonally normal rise in US crude stocks and thus less pressing. Since early May however the US crude stocks have just continued higher during a period where they usually decline. That is probably why Brent crude managed to reach its ytd high in late April but has been heading lower since then. Depressed by counter seasonally rising US crude stocks now standing 32 m bl above the 5yr average. Thus news by API that they probably continued to rise for yet another week last week is not taken lightly by the market. Negative equity markets this morning is not helping the matter either with “Quitaly” risk (Italy exiting the Euro) being one of the negatives.
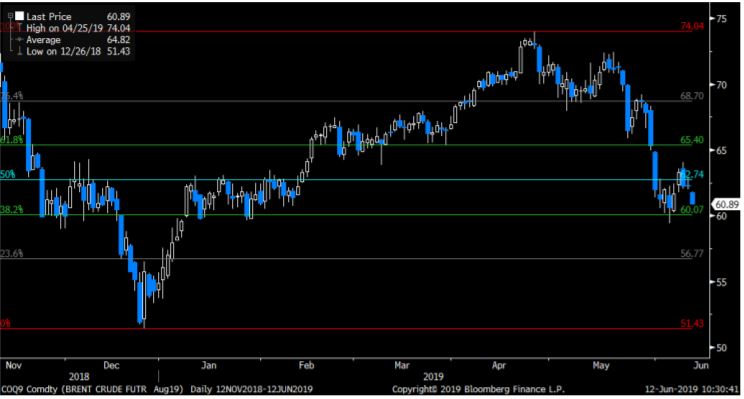
With Brent crude selling off towards $61/bl this morning it has again come dangerously close to the 38.2% Fibo retracement level of $60.07/bl for Brent Aug contract or $59.74/bl for the rolling front month contract below which there is basically no support before $51.43/bl for the Aug contract or $49.93/bl for the rolling front month contract.
The big question is of course why US crude stocks are rising?
If there were no pipeline, refinery or quality issues a rise in US crude and/or product stocks would correctly be interpreted as a residual reflection of a running surplus in the global oil market. A part of this surplus would then naturally pile up in the US as well as everywhere else. Rising US crude and product stocks would then be a telling sing of a global oil market in surplus. This is the natural and instinctive financial market interpretation of the rising US oil inventories: “Wow, the global market must really be running a large surplus if US stocks are rising this much!”
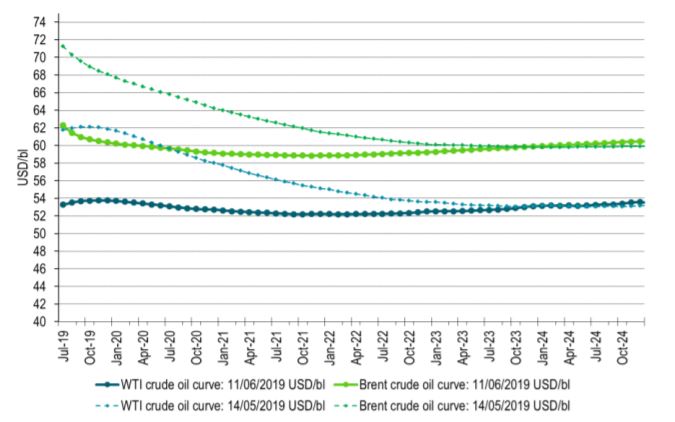
The Brent crude oil curve has however been trading in sharp backwardation until late May pointing instead to a physically very tight global oil market. Since then the Brent backwardation has come off a bit along with speculative sell-off but it is still trading in backwardation. Usually a sell-off in financial oil contracts will lead to a softening in the curve structure as the sell-off mostly takes place at the front end of the curve.
The natural and instinctive interpretation that rising US crude stocks is a reflection of a running surplus in the global oil market does thus not seem to be fully consistent with the backwardated Brent crude curve structure.
The fact is that in the US today we do have pipeline, refinery and quality issues blurring the picture. These issues are leading to a widening Brent to WTI price spread. The wider it gets the more it means that the US has local oil market issues which are not necessarily an equal reflection of the same issues in the global oil market.
- US shale crude oil production continues to rise by the day (+83,000 bl/d MoM in June according to the US EIA). Building of pipeline capacity is under way but is lagging with a lot more capacity coming online late 2019 and 2020. Thus crude oil is for now naturally backing up in the US, depressing WTI and widening the Brent to WTI price spread.
- US refineries have for several reasons been running well below normal and thus processed significantly less crude oil than normal (5yr). In our calculations they have processed 31 m bl/d less than normal since week 6.
- US shale crude oil is very light and contains lots of gasoline. This leads to a natural overproduction of gasoline with such stocks now again above the 5yr average and the gasoline crack has come off again. US refineries may thus prefer to import more medium sour crude and process less shale crude oil thus leading to rising US crude stocks.
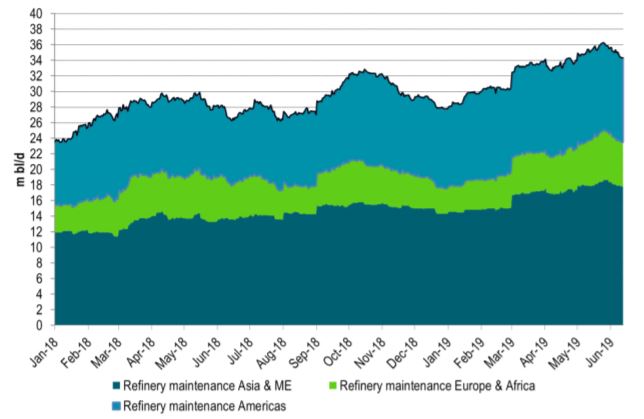
In total there has been a significant amount of refinery capacity out for spring maintenance/turnaround. These have now started to ramp up again and will thus process much more crude oil going forward. US refinery utilization is also rising.
There are obviously sensible concerns for the health of the global economy due to the ongoing US/China trade war with fears that global oil demand growth may falter.
Historically though it is quite rare that global oil demand grows by less than 1.0% per year. Intra-year though the global oil demand may look very gloomy. That is however usually a reflection of a refinery inventory cycle where refineries becomes concerned for global oil product demand, they buy less crude and sell more products from their inventories. Just 1-2% tweak in their normal behaviour drives rippling waves into the global oil market. In the end though it most often turns out that oil demand for the year turned out to be not all that bad after all.
We do think that rising US oil inventories may not be an excellent reflection of the health of the global oil market and as such that the market may over-sell Brent crude on the back of what is happening in the US oil market / US oil inventories.
This is especially so now that we again rapidly are narrowing in on the very important Brent crude oil support level around the $60/bl line. If broken it opens up for a significant over-sell down to towards the $50/bl line.
Ch1: Brent and WTI forward crude curves. Brent still in backwardation
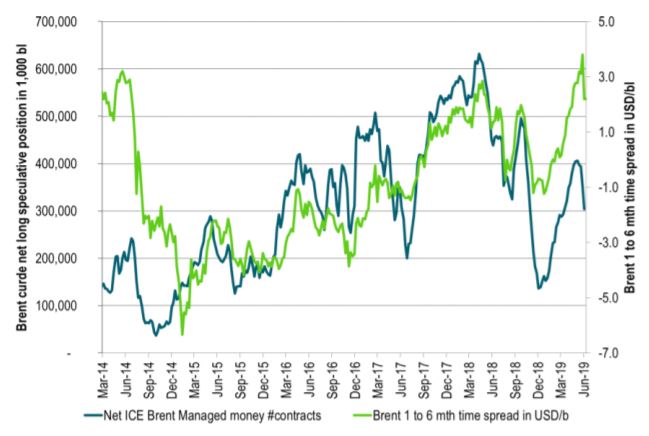
Ch2: Changes in speculative positions do impact the crude curve structure as buying and selling mostly takes place in the front end of the curves. Thus contango and backwardation is not totally a reflection of physical market
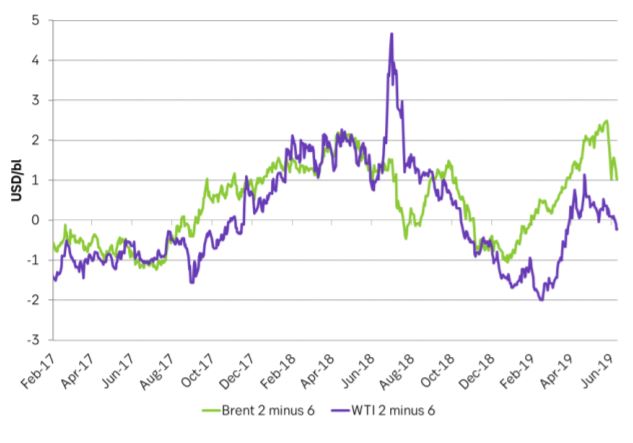
Ch3: Brent crude and WTI curve structures in terms of time spreads of the 2 month contract minus the 6 month contract. Usually they track closely: Same shape = same fundamentals. Significant divergence since late 2018
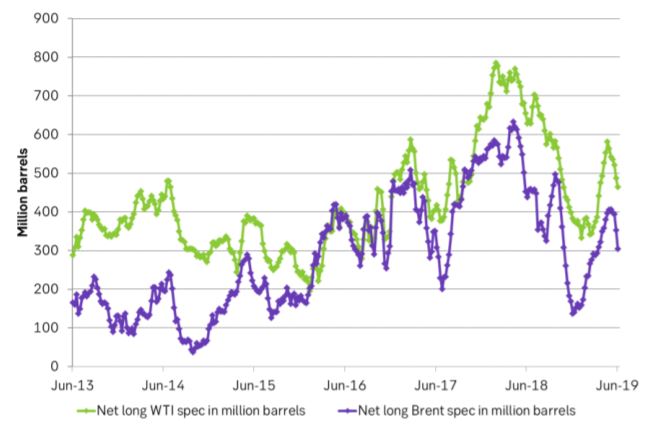
Ch4: Net long specs in Brent and WTI have come off but still room for further sell-off if markets sour more
Ch5: US crude inventories on the rise. Most damaging has been the rise after week 17/18 as US crude stocks usually decline after that. Counter seasonal crude stock rise is bad news
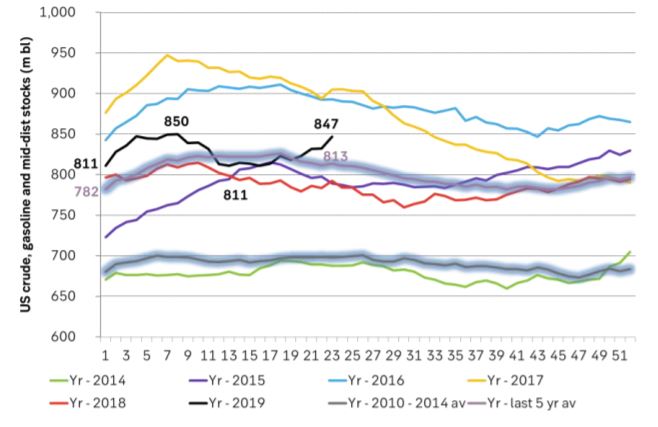
Ch6: Total US crude, gasoline and mid-dist stocks have however risen less dramatically
Ch7: Global refinery outage has been very high this spring. They are now coming back on-line thus consuming and processing more crude oil. But as we seen have seen the Brent crude oil curve is already in backwardation.
Ch8: The Brent Aug contract Fibo retracement levels. No real support before $51.4/bl if $60.07/bl is broken
Parts of the Brent crude curve dipping into the high $50ies/b. Brent crude fell 2.3% over the week to Friday. It closed the week at $61.29/b, a slight gain on the day, but also traded to a low of $60.14/b that same day and just barely avoided trading into the $50ies/b. This morning it is risk-on in equities which seems to help industrial metals a little higher. But no such luck for oil. It is down 0.8% at $60.8/b. This week looks set for Brent crude to dip its feet in the $50ies/b. The Brent 3mth contract actually traded into the high $50ies/b on Friday.

The front-end backwardation has been on a weakening foot and is now about to fully disappear. The lowest point of the crude oil curve has also moved steadily lower and lower and its discount to the 5yr contract is now $6.8/b. A solid contango. The Brent 3mth contract did actually dip into the $50ies/b intraday on Friday when it traded to a low point of $59.93/b.
More weakness to come as lots of oil at sea comes to ports. Mid-East OPEC countries have boosted exports along with lower post summer consumption and higher production. The result is highly visibly in oil at sea which increased by 17 mb to 1,311 mb over the week to Sunday. Up 185 mb since mid-August. On its way to discharge at a port somewhere over the coming month or two.
Don’t forget that the oil market path ahead is all down to OPEC+. Remember that what is playing out in the oil market now is all by design by OPEC+. The group has decided that the unwind of the voluntary cuts is what it wants to do. In a combination of meeting demand from consumers as well as taking back market share. But we need to remember that how this plays out going forward is all at the mercy of what OPEC+ decides to do. It will halt the unwinding at some point. It will revert to cuts instead of unwind at some point.
A few months with Brent at $55/b and 40-50 US shale oil rigs kicked out may be what is needed. We think OPEC+ needs to see the exit of another 40-50 drilling rigs in the US shale oil patches to set US shale oil production on a path to of a 1 mb/d year on year decline Dec-25 to Dec-26. We are not there yet. But a 2-3 months period with Brent crude averaging $55/b would probably do it.
Oil on water increased 17 mb over the week to Sunday while oil in transit increased by 23 mb. So less oil was standing still. More was moving.

Crude oil floating storage (stationary more than 7 days). Down 11 mb over week to Sunday

The lowest point of the Brent crude oil curve versus the 5yr contract. Weakest so far this year.

Crude oil 1mth to 3mth time-spreads. Dubai held out strongly through summer, but then that center of strength fell apart in late September and has been leading weakness in crude curves lower since then.

Rebounding along with most markets. But concerns over solidity of Gaza peace may also contribute. Brent crude fell 0.8% yesterday to $61.91/b and its lowest close since May this year. This morning it is bouncing up 0.9% to $62.5/b along with a softer USD amid positive sentiment with both equities and industrial metals moving higher. Concerns that the peace in Gaza may be less solid than what one might hope for also yields some support to Brent. Bets on tech stocks are rebounding, defying fears of trade war. Money moving back into markets. Gold continues upwards its strong trend and a softer dollar helps it higher today as well.
US crude & products probably rose 5.6 mb last week (API) versus a normal seasonal decline of 2.4 mb. The US API last night partial and thus indicative data for US oil inventories. Their data indicates that US crude stocks rose 7.4 mb last week, gasoline stocks rose 3.0 mb while Distillate stocks fell 4.8 mb. Altogether an increase in commercial crude and product stocks of 5.6 mb. Commercial US crude and product stocks normally decline by 2.4 mb this time of year. So seasonally adjusted the US inventories rose 8 mb last week according to the indicative numbers by the API. That is a lot. Also, the counter seasonal trend of rising stocks versus normally declining stocks this time of year looks on a solid pace of continuation. If the API is correct then total US crude and product stocks would stand 41 mb higher than one year ago and 6 mb higher than the 2015-19 average. And if we combine this with our knowledge of a sharp increase in production and exports by OPEC(+) and a large increase in oil at sea, then the current trend in US oil inventories looks set to continue. So higher stocks and lower crude oil prices until OPEC(+) switch to cuts. Actual US oil inventory data today at 18:00 CET.
US commercial crude and product stocks rising to 1293 mb in week 41 if last nights indicative numbers from API are correct.

Crude oil soon coming to a port near you. OPEC has lifted production sharply higher this autumn. At the same time demand for oil in the Middle-East has fallen as we have moved out of summer heat and crude oil burn for power for air-conditioning. The Middle-East oil producers have thus been able to lift exports higher on both accounts. Crude oil and condensates on water has shot up by 177 mb since mid-August. This oil is now on its way to ports around the world. And when they arrive, it will likely help to lift stocks onshore higher. That is probably when we will lose the last bit of front-end backwardation the the crude oil curves. That will help to drive the front-month Brent crude oil price down to the $60/b line and revisit the high $50ies/b. Then the eyes will be all back on OPEC+ when they meet in early November and then again in early December.
Crude oil and condensates at sea have moved straight up by 177 mb since mid-August as OPEC(+) has produced more, consumed less and exported more.

When it starts to move lower it moves rather quickly. Gaza, China, IEA. Brent crude is down 2.1% today to $62/b after having traded as high as $66.58/b last Thursday and above $70/b in late September. The sell-off follows the truce/peace in Gaze, a flareup in US-China trade and yet another bearish oil outlook from the IEA.
A lasting peace in Gaze could drive crude oil at sea to onshore stocks. A lasting peace in Gaza would probably calm down the Houthis and thus allow more normal shipments of crude oil to sail through the Suez Canal, the Red Sea and out through the Bab-el-Mandeb Strait. Crude oil at sea has risen from 48 mb in April to now 91 mb versus a pre-Covid normal of about 50-60 mb. The rise to 91 mb is probably the result of crude sailing around Africa to be shot to pieces by the Houthis. If sailings were to normalize through the Suez Canal, then it could free up some 40 mb in transit at sea moving onshore into stocks.
The US-China trade conflict is of course bearish for demand if it continues.
Bearish IEA yet again. Getting closer to 2026. Credibility rises. We expect OPEC to cut end of 2025. The bearish monthly report from the IEA is what it is, but the closer we get to 2026, the more likely the IEA is of being ball-park right in its outlook. In its monthly report today the IEA estimates that the need for crude oil from OPEC in 2026 will be 25.4 mb/d versus production by the group in September of 29.1 mb/d. The group thus needs to do some serious cutting at the end of 2025 if it wants to keep the market balanced and avoid inventories from skyrocketing. Given that IEA is correct that is. We do however expect OPEC to implement cuts to avoid a large increase in inventories in Q1-26. The group will probably revert to cuts either at its early December meeting when they discuss production for January or in early January when they discuss production for February. The oil price will likely head yet lower until the group reverts to cuts.
Dubai: The Mid-East anchor dragging crude oil lower. Surplus emerging in Mid-East pricing. Crude oil prices held surprisingly strong all through the summer. A sign and a key source of that strength came from the strength in the front-end backwardation of the Dubai crude oil curve. It held out strong from mid-June and all until late September with an average 1-3mth time-spread premium of $1.8/b from mid-June to end of September. The 1-3mth time-spreads for Brent and WTI however were in steady deterioration from late June while their flat prices probably were held up by the strength coming from the Persian Gulf. Then in late September the strength in the Dubai curve suddenly collapsed. Since the start of October it has been weaker than both the Brent and the WTI curves. The Dubai 1-3mth time-spread now only stands at $0.25/b. The Middle East is now exporting more as it is producing more and also consuming less following elevated summer crude burn for power (Aircon) etc.
The only bear-element missing is a sudden and solid rise in OECD stocks. The only thing that is missing for the bear-case everyone have been waiting for is a solid, visible rise in OECD stocks in general and US oil stocks specifically. So watch out for US API indications tomorrow and official US oil inventories on Thursday.
No sign of any kind of fire-sale of oil from Saudi Arabia yet. To what we can see, Saudi Arabia is not at all struggling to sell its oil. It only lowered its Official Selling Prices (OSPs) to Asia marginally for November. A surplus market + Saudi determination to sell its oil to the market would normally lead to a sharp lowering of Saudi OSPs to Asia. Not yet at least and not for November.
The 5yr contract close to fixed at $68/b. Of importance with respect to how far down oil can/will go. When the oil market moves into a surplus then the spot price starts to trade in a large discount to the 5yr contract. Typically $10-15/b below the 5yr contract on average in bear-years (2009, 2015, 2016, 2020). But the 5yr contract is usually pulled lower as well thus making this approach a moving target. But the 5yr contract price has now been rock solidly been pegged to $68/b since 2022. And in the 2022 bull-year (Brent spot average $99/b), the 5yr contract only went to $72/b on average. If we assume that the same goes for the downside and that 2026 is a bear-year then the 5yr goes to $64/b while the spot is trading at a $10-15/b discount to that. That would imply an average spot price next year of $49-54/b. But that is if OPEC doesn’t revert to cuts and instead keeps production flowing. We think OPEC(+) will trim/cut production as needed into 2026 to prevent a huge build-up in global oil stocks and a crash in prices. But for now we are still heading lower. Into the $50ies/b.


Australien och USA investerar 8,5 miljarder USD för försörjningskedja av kritiska mineraler
Brent crude set to dip its feet into the high $50ies/b this week

Vad guldets uppgång egentligen betyder för världen

Spotpriset på guld över 4300 USD och silver över 54 USD
Crude oil soon coming to a port near you

OPEC+ missar produktionsmål, stöder oljepriserna

Goldman Sachs höjer prognosen för guld, tror priset når 4900 USD

Ett samtal om guld, olja, fjärrvärme och förnybar energi

Blykalla och amerikanska Oklo inleder ett samarbete
Guld nära 4000 USD och silver 50 USD, därför kan de fortsätta stiga
-
 Nyheter4 veckor sedan
OPEC+ missar produktionsmål, stöder oljepriserna
-
 Nyheter2 veckor sedan
Goldman Sachs höjer prognosen för guld, tror priset når 4900 USD
-
 Nyheter4 veckor sedan
Ett samtal om guld, olja, fjärrvärme och förnybar energi
-
 Nyheter3 veckor sedan
Blykalla och amerikanska Oklo inleder ett samarbete
-
 Nyheter3 veckor sedan
Guld nära 4000 USD och silver 50 USD, därför kan de fortsätta stiga
-
Analys4 veckor sedan
Are Ukraine’s attacks on Russian energy infrastructure working?
-

 Nyheter4 veckor sedan
Guldpriset uppe på nya höjder, nu 3750 USD
-
Nyheter3 veckor sedan
Ett samtal om guld, olja, koppar och stål