

Analys
Zink – Ökad efterfrågan, minskat utbud – Kan det bli bättre?
 Underliggande tillgång
SEB ZINK index (Zink noterat på London Metal Exchange)
Kort om underliggande tillgång
De största användningsområdena för zink är bygg- och transportindustrin. Två områden som nu gynnas av en mer positiv syn på tillväxten i Kina och USA.
Aktuell kurs i underliggande tillgång 2012-12-10
$ 2086/ton
Riktkurs 3 mån
$ 2400/ton
Placeringshorisont
3 månaders placeringshorisont, med stop-loss på $1790/ton.
Köprekommendation
Råvarucertifikat ZINK S
Råvarucertifikat ZINK S stiger i värde när priset på den underliggande tillgången stiger, och faller om den underliggande tillgången faller Certifikatet ger utvecklingen i den underliggande tillgången med ett 1:1-förhållande. Detta gäller exklusive avgift, räntor och eventuella valutakursrörelser.
Bakomliggande analys
Ökad efterfrågan, minskat utbud – Kan det bli bättre?
Vår positiva syn på zink baseras på både goda utsikter för efterfrågan och på minskad produktion av raffinerad zink. Efter några år med överskott vänder nu marknaden till underskott.
När det gäller den förväntade efterfrågeökningen, förutsätter den till stor del en fortsatt stabilisering av Kinas industrikonjunktur, och en försiktig vändning uppåt i början av nästa år. Samtidigt bygger scenariot på att den amerikanska ekonomin växer som väntat, vilket inkluderar en för konjunkturen ”godtagbar” lösning av de amerikanska budgetförhandlingarna (SEB:s huvudscenario).
De senaste veckornas mer positiva tillväxtutsikter i Kina baseras i stort på förväntningar om nya stimulansåtgärder, både monetära och i form av investeringar i infrastruktur. Det senare kommer att gynna zink. 60 procent av zinkkonsumtionen går till ytbehandling av stål, varav hälften representeras av byggindustrin.
Den andra hälften förbrukas av bilindustrin. Kina har redan beslutat om, och förväntas de närmsta veckorna ge indikationer på ytterligare investeringar, om inte förr så i samband med det officiella maktskiftet efter det kinesiska nyåret i slutet av februari.
En viktig del för uppsvinget i den amerikanska ekonomin är kopplat till bostadsmarknaden och ökade bygginvesteringar, vilket talar för basmetaller generellt, men också för zink.

Bilindustrin är den andra viktiga sektorn för zinkkonsumtionen (galvaniserad tunnplåt). Den amerikanska bilförsäljningen (se nedan) har tagit fart samtidigt som den är fortsatt stabil i Kina.

När det gäller utbudet ligger flaskhalsen hos smältverken. Det finns risk att raffinerad zinkproduktion minskar i år. Det beror inte på minskad gruvproduktion utan på smältverkens lönsamhetsproblem. Efter en period med utbudsöverskott, så kommer den förväntade efterfrågeökningen, i kombination med utbudsminskningar, att leda till bättre fundamental balans, kanske redan nästa år.
Tidigare års överskott har lett till stora globala lager. Det finns emellertid en överhängande risk att lagren inte kommer att vara tillgängliga till konsumtion, då en betydande del sitter på fasta händer. Finansiella aktörer köper fysisk metall som de säkrar genom att sälja på termin. Strukturerna har olika lång löptid, men gemensamt att de undanhåller material (så länge som terminspremien är tillräckligt stor för att garantera lönsamhet). Det tillgängliga lagret är därför väsentligt mycket mindre än vad som syns i den officiella statistiken.

Ett antal stora zinkgruvors malmtillgångar börjar ta slut. Enligt flera av marknadens mest tongivande oberoende analytiker förväntas 0,45 Mton försvinna redan nästa år, vilket motsvaras av 3,5 procent av det totala utbudet. Under perioden fram till 2016 bedöms hela 1,5 Mton ton gruvproduktion att stänga, vilket på sikt riskerar att skapa ett mer permanent underskott av zink. Vi tror marknadens aktörer successivt kommer att diskontera in detta utbudsunderskott i gruvsektorn, vilket i sig stärker priset.
+
Positiv efterfrågetillväxt
Minskad raffinerad zinkproduktion
Lager uppknutna i finansieringsaffärer som minskar mängden tillgängligt material
Gruvstängningar kommande år
–
Stora lager efter tidigare års överskott – kan ta tid att ”beta av”.
[box]Analysen är producerat av SEB Merchant Banking och publiceras i samarbete och med tillstånd på Råvarumarknaden.se[/box]
Disclaimer
The information in this document has been compiled by SEB Merchant Banking, a division within Skandinaviska Enskilda Banken AB (publ) (“SEB”).
Opinions contained in this report represent the bank’s present opinion only and are subject to change without notice. All information contained in this report has been compiled in good faith from sources believed to be reliable. However, no representation or warranty, expressed or implied, is made with respect to the completeness or accuracy of its contents and the information is not to be relied upon as authoritative. Anyone considering taking actions based upon the content of this document is urged to base his or her investment decisions upon such investigations as he or she deems necessary. This document is being provided as information only, and no specific actions are being solicited as a result of it; to the extent permitted by law, no liability whatsoever is accepted for any direct or consequential loss arising from use of this document or its contents.
About SEB
SEB is a public company incorporated in Stockholm, Sweden, with limited liability. It is a participant at major Nordic and other European Regulated Markets and Multilateral Trading Facilities (as well as some non-European equivalent markets) for trading in financial instruments, such as markets operated by NASDAQ OMX, NYSE Euronext, London Stock Exchange, Deutsche Börse, Swiss Exchanges, Turquoise and Chi-X. SEB is authorized and regulated by Finansinspektionen in Sweden; it is authorized and subject to limited regulation by the Financial Services Authority for the conduct of designated investment business in the UK, and is subject to the provisions of relevant regulators in all other jurisdictions where SEB conducts operations. SEB Merchant Banking. All rights reserved.
Analys
OPEC+ will likely unwind 500 kb/d of voluntary quotas in October. But a full unwind of 1.5 mb/d in one go could be in the cards

Down to mid-60ies as Iraq lifts production while Saudi may be tired of voluntary cut frugality. The Brent December contract dropped 1.6% yesterday to USD 66.03/b. This morning it is down another 0.3% to USD 65.8/b. The drop in the price came on the back of the combined news that Iraq has resumed 190 kb/d of production in Kurdistan with exports through Turkey while OPEC+ delegates send signals that the group will unwind the remaining 1.65 mb/d (less the 137 kb/d in October) of voluntary cuts at a pace of 500 kb/d per month pace.

Signals of accelerated unwind and Iraqi increase may be connected. Russia, Kazakhstan and Iraq were main offenders versus the voluntary quotas they had agreed to follow. Russia had a production ’debt’ (cumulative overproduction versus quota) of close to 90 mb in March this year while Kazakhstan had a ’debt’ of about 60 mb and the same for Iraq. This apparently made Saudi Arabia angry this spring. Why should Saudi Arabia hold back if the other voluntary cutters were just freeriding? Thus the sudden rapid unwinding of voluntary cuts. That is at least one angle of explanations for the accelerated unwinding.
If the offenders with production debts then refrained from lifting production as the voluntary cuts were rapidly unwinded, then they could ’pay back’ their ’debts’ as they would under-produce versus the new and steadily higher quotas.
Forget about Kazakhstan. Its production was just too far above the quotas with no hope that the country would hold back production due to cross-ownership of oil assets by international oil companies. But Russia and Iraq should be able to do it.
Iraqi cumulative overproduction versus quotas could reach 85-90 mb in October. Iraq has however steadily continued to overproduce by 3-5 mb per month. In July its new and gradually higher quota came close to equal with a cumulative overproduction of only 0.6 mb that month. In August again however its production had an overshoot of 100 kb/d or 3.1 mb for the month. Its cumulative production debt had then risen to close to 80 mb. We don’t know for September yet. But looking at October we now know that its production will likely average close to 4.5 mb/d due to the revival of 190 kb/d of production in Kurdistan. Its quota however will only be 4.24 mb/d. Its overproduction in October will thus likely be around 250 kb/d above its quota with its production debt rising another 7-8 mb to a total of close to 90 mb.
Again, why should Saudi Arabia be frugal while Iraq is freeriding. Better to get rid of the voluntary quotas as quickly as possible and then start all over with clean sheets.
Unwinding the remaining 1.513 mb/d in one go in October? If OPEC+ unwinds the remaining 1.513 mb/d of voluntary cuts in one big go in October, then Iraq’s quota will be around 4.4 mb/d for October versus its likely production of close to 4.5 mb/d for the coming month..
OPEC+ should thus unwind the remaining 1.513 mb/d (1.65 – 0.137 mb/d) in one go for October in order for the quota of Iraq to be able to keep track with Iraq’s actual production increase.
October 5 will show how it plays out. But a quota unwind of at least 500 kb/d for Oct seems likely. An overall increase of at least 500 kb/d in the voluntary quota for October looks likely. But it could be the whole 1.513 mb/d in one go. If the increase in the quota is ’only’ 500 kb/d then Iraqi cumulative production will still rise by 5.7 mb to a total of 85 mb in October.
Iraqi production debt versus quotas will likely rise by 5.7 mb in October if OPEC+ only lifts the overall quota by 500 kb/d in October. Here assuming historical production debt did not rise in September. That Iraq lifts its production by 190 kb/d in October to 4.47 mb/d (August level + 190 kb/d) and that OPEC+ unwinds 500 kb/d of the remining quotas in October when they decide on this on 5 October.

U.S. commercial crude inventories posted a marginal draw last week, falling by 0.6 million barrels to 414.8 million barrels. Inventories remain 4% below the five-year seasonal average, but the draw is far smaller than last week’s massive 9.3-million-barrel decline. Higher crude imports (+803,000 bl d WoW) and steady refinery runs (93% utilization) helped keep the crude balance relatively neutral.

Yet another drawdown indicates commercial crude inventories continue to trend below the 2015–2022 seasonal norm (~440 million barrels), though at 414.8 million barrels, levels are now almost exactly in line with both the 2023 and 2024 trajectory, suggesting stable YoY conditions (see page 3 attached).
Gasoline inventories dropped by 1.1 million barrels and are now 2% below the five-year average. The decline was broad-based, with both finished gasoline and blending components falling, indicating lower output and resilient end-user demand as we enter the shoulder season post-summer (see page 6 attached).
On the diesel side, distillate inventories declined by 1.7 million barrels, snapping a two-week streak of strong builds. At 125 million barrels, diesel inventories are once again 8% below the five-year average and trending near the low end of the historical range.
In total, commercial petroleum inventories (excl. SPR) slipped by 0.5 million barrels on the week to ish 1,281.5 million barrels. While essentially flat, this ends a two-week streak of meaningful builds, reflecting a return to a slightly tighter situation.
On the demand side, the DOE’s ‘products supplied’ metric (see page 6 attached), a proxy for implied consumption, softened slightly. Total demand for crude oil over the past four weeks averaged 20.5 million barrels per day, up just 0.9% YoY.
Summing up: This week’s report shows a re-tightening in diesel supply and modest draws across the board, while demand growth is beginning to flatten. Inventories remain structurally low, but the tone is less bullish than in recent weeks.


Brent crude rose 1.6% yesterday. After trading in a range of USD 66.1 – 68.09/b it settled at USD 67.63/b. A level which we are well accustomed to see Brent crude flipping around since late August. This morning it is trading 0.5% higher at USD 68/b. The market was expecting an increase of 230 kb/d in Iraqi crude exports from Kurdistan through Turkey to the Cheyhan port but that has so far failed to materialize. This probably helped to drive Brent crude higher yesterday. Indications last evening that US crude oil inventories likely fell 3.8 mb last week (indicative numbers by API) probably also added some strength to Brent crude late in the session. The market continues to await the much heralded global surplus materializing as rising crude and product inventories in OECD countries in general and the US specifically.
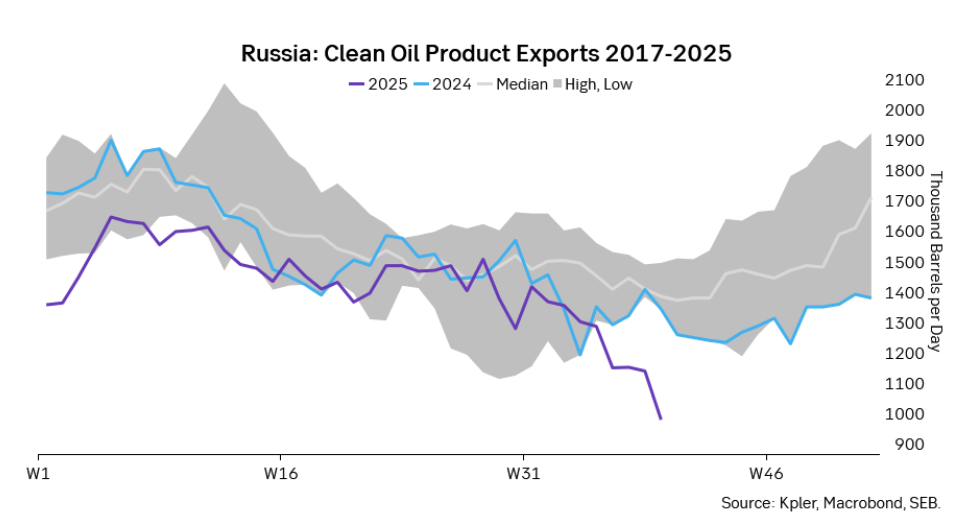
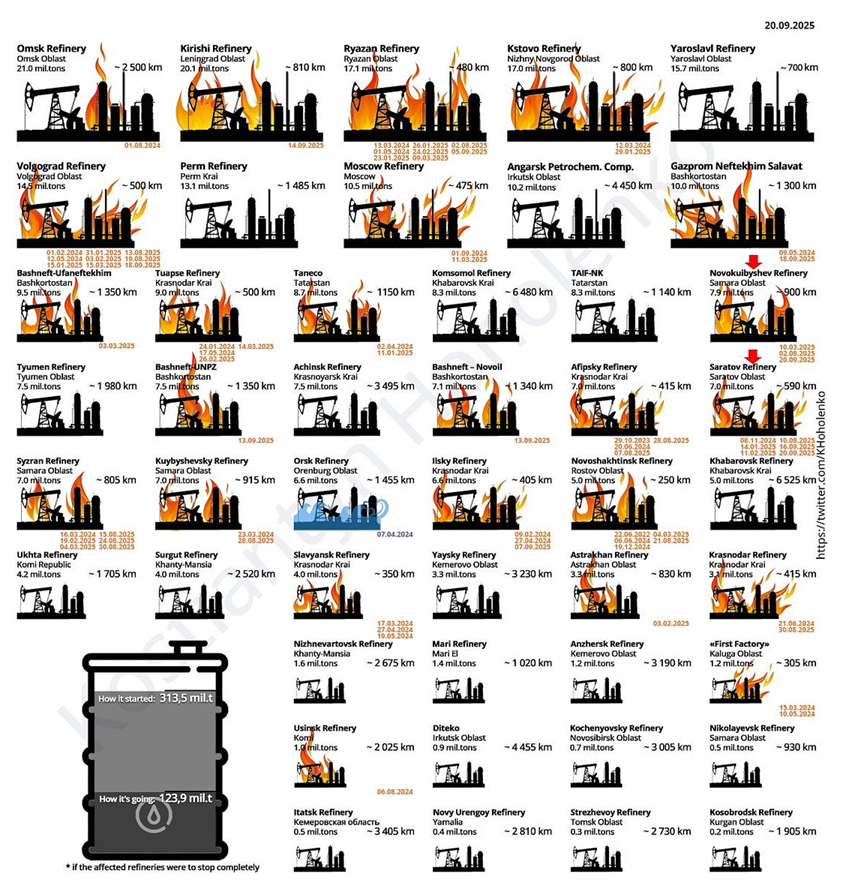
The oil market is starting to focus increasingly on the successful Ukrainian attacks on Russian oil infrastructure. Especially the attacks on Russian refineries. Refineries are highly complex and much harder to repair than simple crude oil facilities like export pipelines, ports and hubs. It can take months and months to repair complex refineries. It is thus mainly Russian oil products which will be hurt by this. First oil product exports will go down, thereafter Russia will have to ration oil product consumption domestically. Russian crude exports may not be hurt as much. Its crude exports could actually go up as its capacity to process crude goes down. SEB’s Emerging Market strategist Erik Meyersson wrote about the Ukrainian campaign this morning: ”Are Ukraine’s attacks on Russian energy infrastructure working?”. Phillips P O’Brian published an interesting not on this as well yesterday: ”An Update On The Ukrainian Campaign Against Russian Refineries”. It is a pay-for article, but it is well worth reading. Amongst other things it highlights the strategic focus of Ukraine towards Russia’s energy infrastructure. A Ukrainian on the matter also put out a visual representation of the attacks on twitter. We have not verified the data representation. It needs to be interpreted with caution in terms of magnitude of impact and current outage.
Complex Russian oil refineries are sitting ducks in the new, modern long-range drone war. Ukraine is building a range of new weapons as well according to O’Brian. The problem with attacks on Russian refineries is thus on the rise. This will likely be an escalating problem for Russia. And oil products around the world may rise versus the crude oil price while the crude oil price itself may not rise all that much due to this.
Russian clean oil product exports as presented by SEB’s Erik Meyersson in his note this morning.
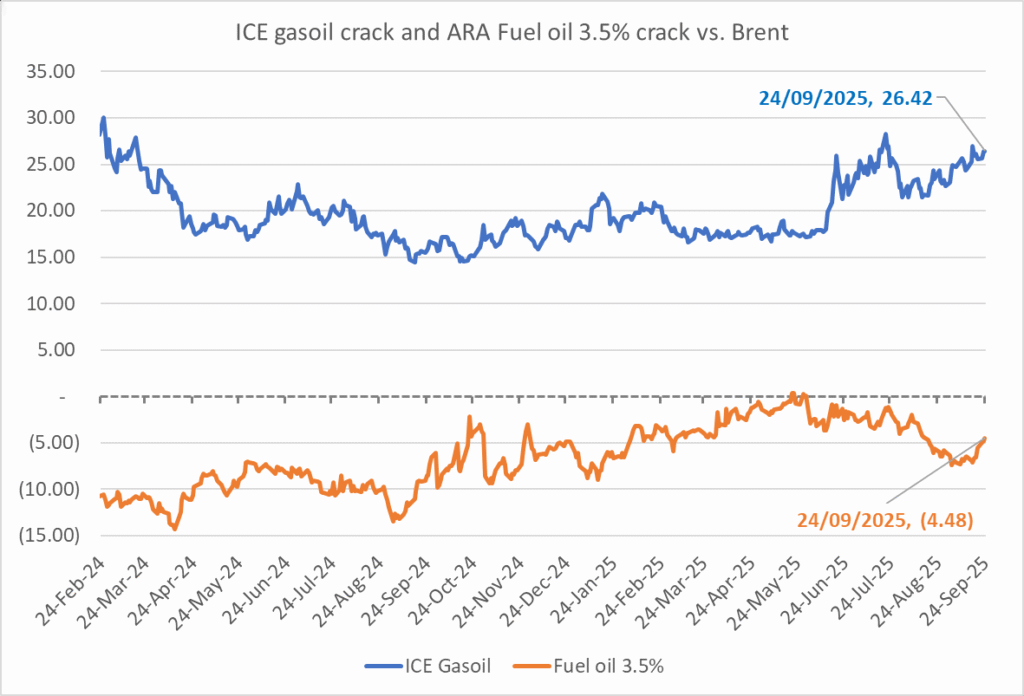
The ICE Gasoil crack and the 3.5% fuel oil crack has been strengthening. The 3.5% crack should have weakened along with rising exports of sour crude from OPEC+, but it hasn’t. Rather it has moved higher instead. The higher cracks could in part be due to the Ukrainian attacks on Russian oil refineries.
Ukrainian inhabitants graphical representation of Ukrainian attacks on Russian oil refineries on Twitter. Highlighting date of attacks, size of refineries and distance from Ukraine. We have not verified the detailed information. And you cannot derive the amount of outage as a consequence of this.

OPEC+ will likely unwind 500 kb/d of voluntary quotas in October. But a full unwind of 1.5 mb/d in one go could be in the cards

Blykalla och amerikanska Oklo inleder ett samarbete

Fortsatt stabilt elpris – men dubbelt så dyrt som i fjol

Ett samtal om guld, olja, koppar och stål

Mixat oktoberväder påverkar elpriset

Eurobattery Minerals satsar på kritiska metaller för Europas självförsörjning

Mahvie Minerals i en guldtrend

Guldpriset kan närma sig 5000 USD om centralbankens oberoende skadas

OPEC signalerar att de inte bryr sig om oljepriset faller kommande månader
Volatile but going nowhere. Brent crude circles USD 66 as market weighs surplus vs risk
-
 Nyheter4 veckor sedan
Eurobattery Minerals satsar på kritiska metaller för Europas självförsörjning
-
 Nyheter3 veckor sedan
Mahvie Minerals i en guldtrend
-
 Nyheter4 veckor sedan
Guldpriset kan närma sig 5000 USD om centralbankens oberoende skadas
-
 Nyheter4 veckor sedan
OPEC signalerar att de inte bryr sig om oljepriset faller kommande månader
-
Analys3 veckor sedan
Volatile but going nowhere. Brent crude circles USD 66 as market weighs surplus vs risk
-

 Nyheter3 veckor sedan
Aktier i guldbolag laggar priset på guld
-

 Nyheter3 veckor sedan
Kinas elproduktion slog nytt rekord i augusti, vilket även kolkraft gjorde
-
 Nyheter2 veckor sedan
Tyskland har så höga elpriser att företag inte har råd att använda elektricitet