

Analys
US shale oil production growth slowing sharply


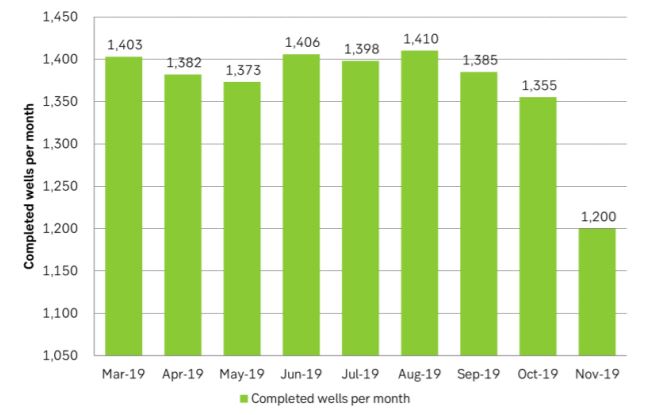
The US EIA yesterday released its monthly drilling and productivity data. It showed that US shale oil production is slowing down even faster than they assumed just one week ago in their monthly STEO oil market outlook. All through 2019 we have seen an ongoing sharp decline in drilling. The slowdown in production growth has however been much more muted as producers have been able to tap a large inventory of drilled but uncompleted wells (DUCs). The well-completion rate has been holding out at around 1350 to 1400 wells per month but now it suddenly fell off a cliff in November.

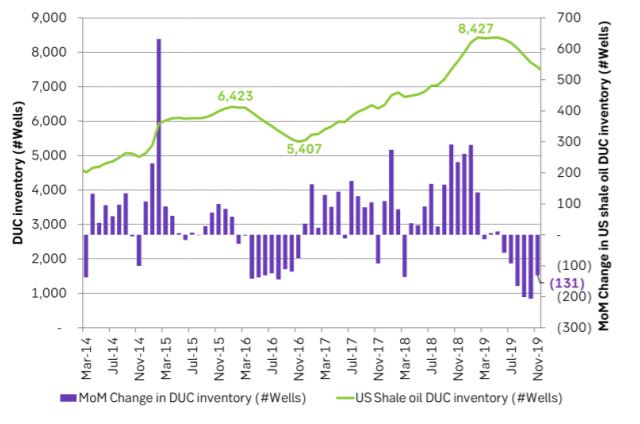
The number of usable wells in the DUC inventory has always been highly uncertain. We had expected the well-completion rate to hold out at around 1350 to 1400 until Feb/Mar next year before producers would be forced to reduce the completion rate in lack of usable wells in the DUC inventory. But now it is happening already in November. This could be noise, or it could be a sign that number of useful wells in the DUC inventory are fewer than expected.
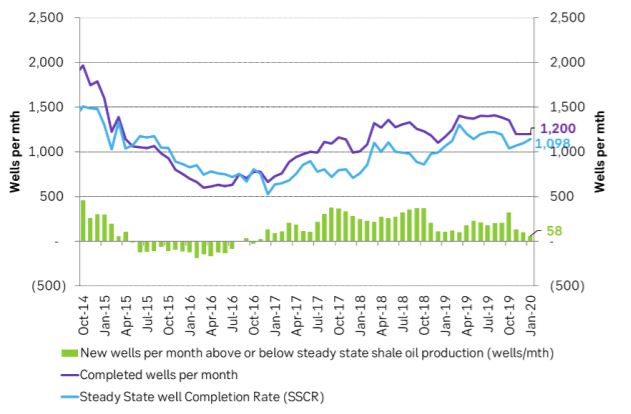
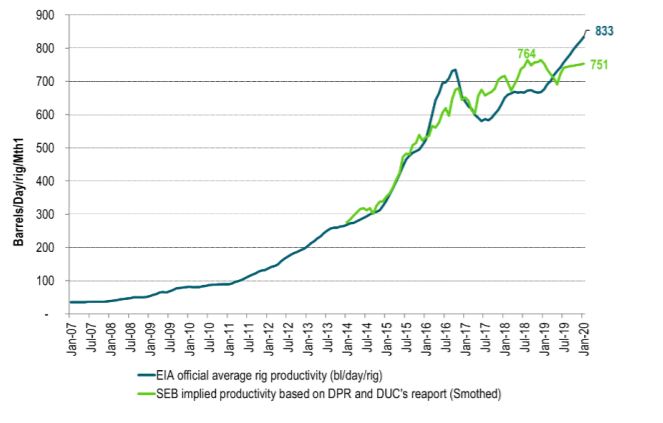
Losses in existing production is still on the rise while new monthly production is in decline as fewer wells are completed. US shale oil production is now projected to grow by only 30 k bl/d in January (360 k bl/d annualized rate) and it is rapidly moving towards zero growth. If the well completion rate falls another 50-100 wells, we’ll have zero production growth in US shale oil production. Last week the US EIA projected that US shale oil production will be in contraction at the end of 2020 but still hold out at a 50 k bl/d production growth rate MoM through the first five months of 2020. Yesterday’s drilling and productivity data is probably indicating that these assumptions are too high, and that production is slowing down even faster than projected just one week ago. Our view is still that the US EIA is estimating drilling productivity at too high a level because the DUC inventory is being drawn down and thus crates an image of high production per drilling rig in operation.
In a nutshell the number of drilled wells went down by 79 wells, completed wells went down by 155, the DUC inventory declined by 131 wells, production growth fell in 5 out of 7 regions with only one region slightly higher and one unchanged. Non-Permian production will decline by 18 k bl/d MoM in January (216 k bl/d annualized decline rate) and total US shale oil production will only grow by 30 k bl/d in January (360 k bl/d annualized rate).
Across the raw material space, the mantra today is “profit, not volume”, so also in shale oil. It is lack of profitability which is driving down the activity in US shale oil production. It is not lack of ability to produce.
Yesterday’s data and reports from the US EIA is truly great reading for OPEC+. It makes the task of controlling the supply/demand balance in the global oil market next year so much easier. Rather than US shale oil flooding into the market at an increasing rate it is now instead rapidly moving towards zero growth. That makes it much more controllable for OPEC+.
The great thing about US shale oil seen in the eyes of OPEC is the sharp underlying decline rate. OPEC can at any time get back its lost market share probably within a year or so. All it needs to do is to let the oil price drop down deep for 6-12 months. US shale oil production would crash, demand would boom on low prices and voila OPEC’s market share would be back to normal.
So, in terms of market share OPEC has nothing to worry about. It can easily and quickly get it back again anytime it wants to. This would not have been the case if the new oil supply in the US had been more like classic oil which typically never goes away before 10 years or more have passed. A lower price would of course be the price to pay for getting back the lost market share. But time of getting it back would be quick.
Ch1: The number of completed shale oil wells in the US fell off a cliff in November. Much sooner than expected.
Ch2: If US shale oil producers reduce the number of completed wells by another 58 wells then US shale oil production will have zero growth in January rather than a projected growth rate of 30 k bl/d MoM as projected by the US EIA yesterday
Ch3: The US EIA is over-estimating the drilling productivity due to the DUC inventory draw
Ch4: The US shale oil DUC inventory is drawing down. We had expected that the draw down rate should accelerate with the DUC inventory then bottoming out at around 5,500 where it bottomed out last time. But the draw down slowed in November. Lack of good wells in the DUC inventory?
Ch5: SEB well productivity estimate
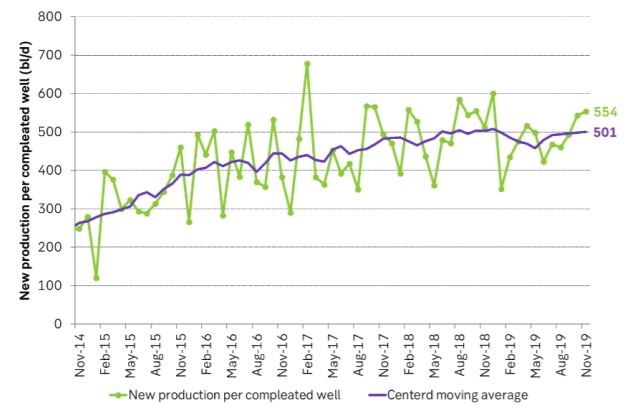
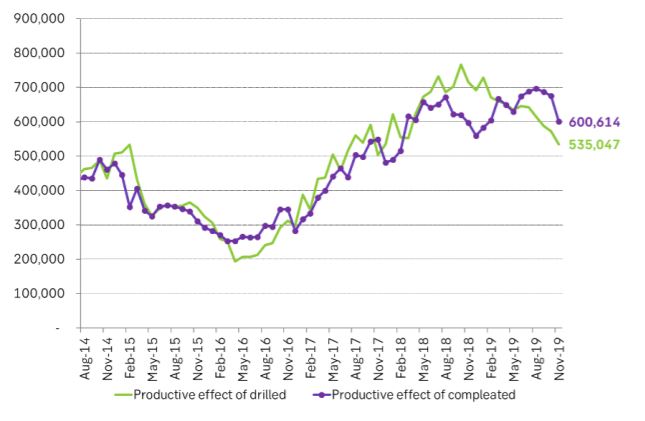
Ch6: The productive value of drilled wells has fallen for a long time as the number of drilled wells per month has declined along with a lower drilling rig count. New in November was that the completion rate also declined sharply. It was bound to happen sooner or later but now it happened sooner.
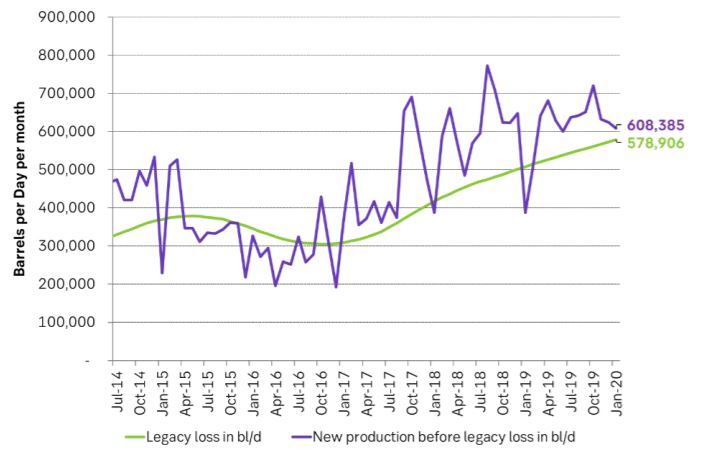
Ch7: Losses in existing production continued to rise while new production is declining. When they meet overall production growth will be zero and then rapidly decline as new production goes below losses in existing production. It’s like breaking off a stick in terms of production. That’s what we saw back in early 2015.
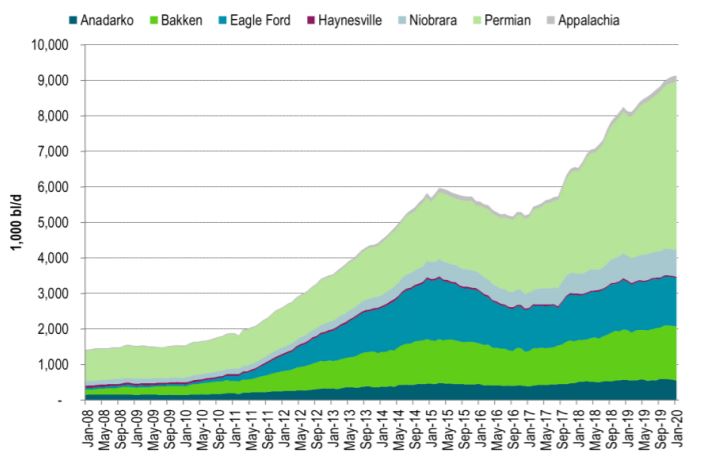
Ch8: US production growth is slowing down. Non-Permian shale oil production is now in decline by a marginal, annualized rate of 216 k bl/d/yr.
Brent crude has climbed roughly USD 1.5-2 per barrel since Friday, yet falling USD 0.3 per barrel this mornig and currently trading near USD 67.25/bbl after yesterday’s climb. While the rally reflects short-term geopolitical tension, price action has been choppy, and crude remains locked in a broader range – caught between supply-side pressure and spot resilience.

Prices have been supported by renewed Ukrainian drone strikes targeting Russian infrastructure. Over the weekend, falling debris triggered a fire at the 20mtpa Kirishi refinery, following last week’s attack on the key Primorsk terminal.
Argus estimates that these attacks have halted ish 300 kbl/d of Russian refining capacity in August and September. While the market impact is limited for now, the action signals Kyiv’s growing willingness to disrupt oil flows – supporting a soft geopolitical floor under prices.
The political environment is shifting: the EU is reportedly considering sanctions on Indian and Chinese firms facilitating Russian crude flows, while the U.S. has so far held back – despite Bessent warning that any action from Washington depends on broader European participation. Senator Graham has also publicly criticized NATO members like Slovakia and Hungary for continuing Russian oil imports.
It’s worth noting that China and India remain the two largest buyers of Russian barrels since the invasion of Ukraine. While New Delhi has been hit with 50% secondary tariffs, Beijing has been spared so far.
Still, the broader supply/demand balance leans bearish. Futures markets reflect this: Brent’s prompt spread (gauge of near-term tightness) has narrowed to the current USD 0.42/bl, down from USD 0.96/bl two months ago, pointing to weakening backwardation.
This aligns with expectations for a record surplus in 2026, largely driven by the faster-than-anticipated return of OPEC+ barrels to market. OPEC+ is gathering in Vienna this week to begin revising member production capacity estimates – setting the stage for new output baselines from 2027. The group aims to agree on how to define “maximum sustainable capacity,” with a proposal expected by year-end.
While the IEA pegs OPEC+ capacity at 47.9 million barrels per day, actual output in August was only 42.4 million barrels per day. Disagreements over data and quota fairness (especially from Iraq and Nigeria) have already delayed this process. Angola even quit the group last year after being assigned a lower target than expected. It also remains unclear whether Russia and Iraq can regain earlier output levels due to infrastructure constraints.
Also, macro remains another key driver this week. A 25bp Fed rate cut is widely expected tomorrow (Wednesday), and commodities in general could benefit a potential cut.
Summing up: Brent crude continues to drift sideways, finding near-term support from geopolitics and refining strength. But with surplus building and market structure softening, the upside may remain capped.
Brent crude is essentially flat on the week, but after a volatile ride. Prices started Monday near USD 65.5/bl, climbed steadily to a mid-week high of USD 67.8/bl on Wednesday evening, before falling sharply – losing about USD 2/bl during Thursday’s session.
Brent is currently trading around USD 65.8/bl, right back where it began. The volatility reflects the market’s ongoing struggle to balance growing surplus risks against persistent geopolitical uncertainty and resilient refined product margins. Thursday’s slide snapped a three-day rally and came largely in response to a string of bearish signals, most notably from the IEA’s updated short-term outlook.
The IEA now projects record global oversupply in 2026, reinforcing concerns flagged earlier by the U.S. EIA, which already sees inventories building this quarter. The forecast comes just days after OPEC+ confirmed it will continue returning idle barrels to the market in October – albeit at a slower pace of +137,000 bl/d. While modest, the move underscores a steady push to reclaim market share and adds to supply-side pressure into year-end.
Thursday’s price drop also followed geopolitical incidences: Israeli airstrikes reportedly targeted Hamas leadership in Doha, while Russian drones crossed into Polish airspace – events that initially sent crude higher as traders covered short positions.
Yet, sentiment remains broadly cautious. Strong refining margins and low inventories at key pricing hubs like Europe continue to support the downside. Chinese stockpiling of discounted Russian barrels and tightness in refined product markets – especially diesel – are also lending support.
On the demand side, the IEA revised up its 2025 global demand growth forecast by 60,000 bl/d to 740,000 bl/d YoY, while leaving 2026 unchanged at 698,000 bl/d. Interestingly, the agency also signaled that its next long-term report could show global oil demand rising through 2050.
Meanwhile, OPEC offered a contrasting view in its latest Monthly Oil Market Report, maintaining expectations for a supply deficit both this year and next, even as its members raise output. The group kept its demand growth estimates for 2025 and 2026 unchanged at 1.29 million bl/d and 1.38 million bl/d, respectively.
We continue to watch whether the bearish supply outlook will outweigh geopolitical risk, and if Brent can continue to find support above USD 65/bl – a level increasingly seen as a soft floor for OPEC+ policy.
Brent crude makes some gains as Israel’s attack on Hamas in Qatar rattles markets. Brent crude spiked to a high of USD 67.38/b yesterday as Israel made a strike on Hamas in Qatar. But it wasn’t able to hold on to that level and only closed up 0.6% in the end at USD 66.39/b. This morning it is starting on the up with a gain of 0.9% at USD 67/b. Still rattled by Israel’s attack on Hamas in Qatar yesterday. Brent is getting some help on the margin this morning with Asian equities higher and copper gaining half a percent. But the dark cloud of surplus ahead is nonetheless hanging over the market with Brent trading two dollar lower than last Tuesday.

Geopolitical risk premiums in oil rarely lasts long unless actual supply disruption kicks in. While Israel’s attack on Hamas in Qatar is shocking, the geopolitical risk lifting crude oil yesterday and this morning is unlikely to last very long as such geopolitical risk premiums usually do not last long unless real disruption kicks in.
US API data yesterday indicated a US crude and product stock build last week of 3.1 mb. The US API last evening released partial US oil inventory data indicating that US crude stocks rose 1.3 mb and middle distillates rose 1.5 mb while gasoline rose 0.3 mb. In total a bit more than 3 mb increase. US crude and product stocks usually rise around 1 mb per week this time of year. So US commercial crude and product stock rose 2 mb over the past week adjusted for the seasonal norm. Official and complete data are due today at 16:30.
A 2 mb/week seasonally adj. US stock build implies a 1 – 1.4 mb/d global surplus if it is persistent. Assume that if the global oil market is running a surplus then some 20% to 30% of that surplus ends up in US commercial inventories. A 2 mb seasonally adjusted inventory build equals 286 kb/d. Divide by 0.2 to 0.3 and we get an implied global surplus of 950 kb/d to 1430 kb/d. A 2 mb/week seasonally adjusted build in US oil inventories is close to noise unless it is a persistent pattern every week.
US IEA STEO oil report: Robust surplus ahead and Brent averaging USD 51/b in 2026. The US EIA yesterday released its monthly STEO oil report. It projected a large and persistent surplus ahead. It estimates a global surplus of 2.2 m/d from September to December this year. A 2.4 mb/d surplus in Q1-26 and an average surplus for 2026 of 1.6 mb/d resulting in an average Brent crude oil price of USD 51/b next year. And that includes an assumption where OPEC crude oil production only averages 27.8 mb/d in 2026 versus 27.0 mb/d in 2024 and 28.6 mb/d in August.
Brent will feel the bear-pressure once US/OECD stocks starts visible build. In the meanwhile the oil market sits waiting for this projected surplus to materialize in US and OECD inventories. Once they visibly starts to build on a consistent basis, then Brent crude will likely quickly lose altitude. And unless some unforeseen supply disruption kicks in, it is bound to happen.
US IEA STEO September report. In total not much different than it was in January

US IEA STEO September report. US crude oil production contracting in 2026, but NGLs still growing. Close to zero net liquids growth in total.


Tyskland har så höga elpriser att företag inte har råd att använda elektricitet
Brent crude ticks higher on tension, but market structure stays soft

Kinas elproduktion slog nytt rekord i augusti, vilket även kolkraft gjorde

Det stigande guldpriset en utmaning för smyckesköpare

Aktier i guldbolag laggar priset på guld

Mahvie Minerals är verksamt i guldrikt område i Finland
Increasing risk that OPEC+ will unwind the last 1.65 mb/d of cuts when they meet on 7 September

Eurobattery Minerals satsar på kritiska metaller för Europas självförsörjning

Neil Atkinson spår att priset på olja kommer att stiga till 70 USD
OPEC+ in a process of retaking market share
-
 Nyheter4 veckor sedan
Mahvie Minerals är verksamt i guldrikt område i Finland
-
Analys4 veckor sedan
Increasing risk that OPEC+ will unwind the last 1.65 mb/d of cuts when they meet on 7 September
-
 Nyheter2 veckor sedan
Eurobattery Minerals satsar på kritiska metaller för Europas självförsörjning
-
 Nyheter4 veckor sedan
Neil Atkinson spår att priset på olja kommer att stiga till 70 USD
-
Analys3 veckor sedan
OPEC+ in a process of retaking market share
-

 Nyheter2 veckor sedan
Guldpriset kan närma sig 5000 USD om centralbankens oberoende skadas
-

 Nyheter1 vecka sedan
Mahvie Minerals i en guldtrend
-

 Nyheter3 veckor sedan
Nytt produktionsrekord av olja i USA, högsta efterfrågan på 20 år