

Analys
US oil fundamentals deteriorating much more than global


US equities gained 1% yesterday and the USD index pulled back 0.2% but neither commodities in general nor oil prices specifically got any tailwind from that. Brent crude pulled back 1% ydy to $58.74/bl and the whole forward curve moved down more or less comparably much. This morning Brent crude is recovering some of its losses gaining 0.4% to $59/bl.
Despite the ongoing overarching bearish oil sentiment the Brent crude front month has continued to bounce off at around $57.5/bl more or less every time a flurry of sell-off has hit the contract. It is clear that the spike in oil prices and the strong increase in front-end backwardation from those spikes have fallen back since the attacks on Saudi Arabia some weeks ago.

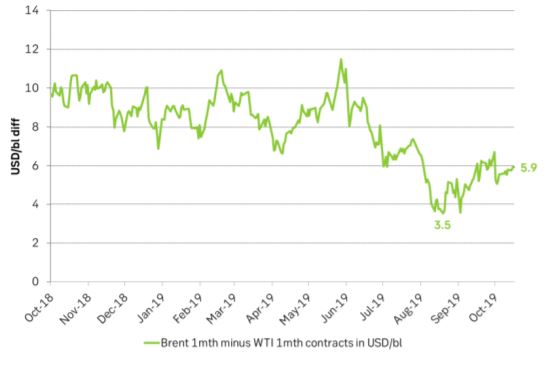
Deteriorating US crude fundamentals places increasing bearish pressure on WTI. Permian pipes to USGC are not enough. USGC ship-out capacity is needed as well. This leaves more control to Saudi Arabia and more bullishness to Brent crude. An important detail here is that the WTI crude curve structure has weakened much more than the Brent structure and that the front month spread between Brent and WTI has widened out from a low of $3.5/bl in mid-Aug to now $5.9/bl. I.e. it is not enough to get a large increase in the pipeline capacity feeding oil out of the Permian basin. One needs to load it onto ships and send it out of the US Gulf as well.
Obviously there is a bottleneck here getting oil out of the US leading to increasingly bearish local fundamentals in the US geography. US crude stocks are rising as a result and especially so because US refinery activity now is at a low seasonal level as well. US data on this tomorrow at 17:00 CET.
The Brent – WTI spread has widened out and the WTI crude curve structure has weakened much more than the Brent structure which basically has stabilized. With a large part of the speculative oil market being WTI-centric this has a very important impact on the overall oil market sentiment. “US oil fundamentals are weakening” = “global oil fundamentals are weakening” is a typical market conclusion. I.e. the bearish US crude sentiment rubs off on the global oil sentiment.
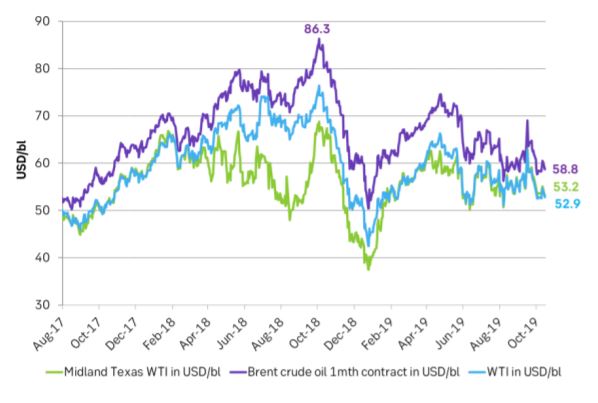
The widening Brent – WTI front end price spread helps to depress US WTI as well as Permian crude prices with the Permian local crude oil price currently pricing at $53.2/bl. This will help to depress drilling activity going forward.
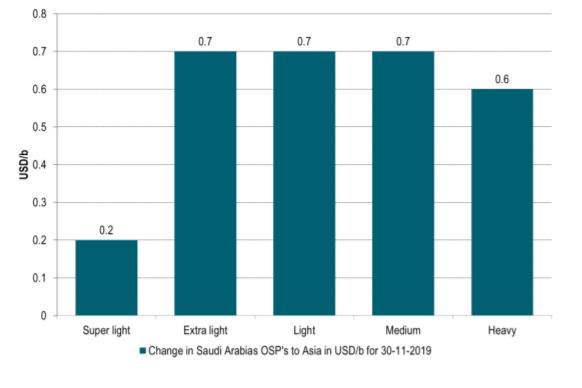
Saudi Arabia Official Selling Prices higher for all grades to Asia for November. The Brent crude oil curve is still in clear backwardation signalling a globally tight physical market. The front end price has so far defied much price action below the $57.5/bl. On interesting fact is that Saudi Arabia’s lifted all its latest OSP’s (Official Selling Prices) for November crude deliveries to Asia by $0.2-0.7/bl with all OSPs now above the 10 year average values.
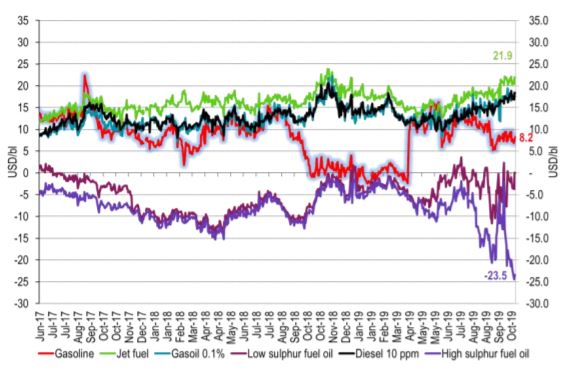
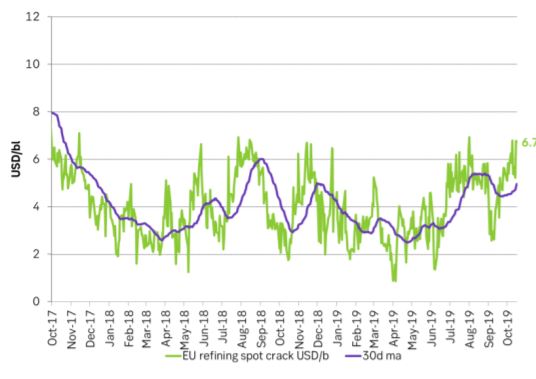
EU refining margins close to two year peaks. HFO 3.5% fuel drops like a rock and shipping consumes much more fuel. European refining margins are close to peak levels versus the peaks over the past 2 years. Middle distillate stocks are well below the 5-year average as we run into the northern hemisphere winter and the IMO-2020 is now kicking in harder and harder. What we see in the charts is that the high sulphur bunker oil spot price continues to fall like a rock versus Brent crude and is now trading at only $35.5/bl in the ARA region. The interpretation of this is that there is a surplus of this oil product in the market because it can soon no longer be legally used in the transportation sector. This product is being kicked out of the market and some other product needs to take its place instead. This is a tightening of the global liquids market which can be used for transportation uses. The skyrocketing tanker freight rates also means another thing: much higher shipping fuel consumption. The higher the rates, the faster the ships go and the more they consume. Much more.
Ch1: The Brent to WTI price spread was close to $10/bl and then deteriorated all the way down to $3.5/bl in early August as new US pipelines from the Permian to the USGC came online. Lack of shipping capacity has however blown the two grades apart again to now close to $6/bl. I.e. US crude is again locked in leading to increasing localized US bearish and WTI bearish pressure.
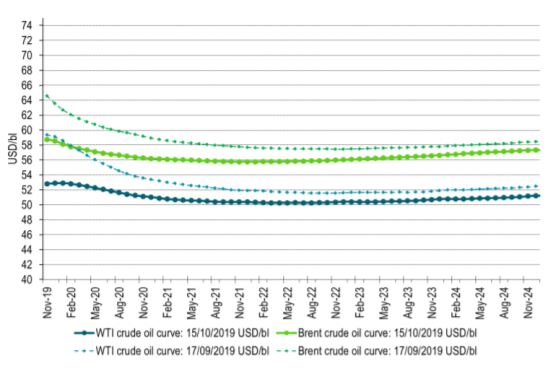
Ch2: Brent and WTI forward crude curves. Structures have weakened but WTI much more than Brent
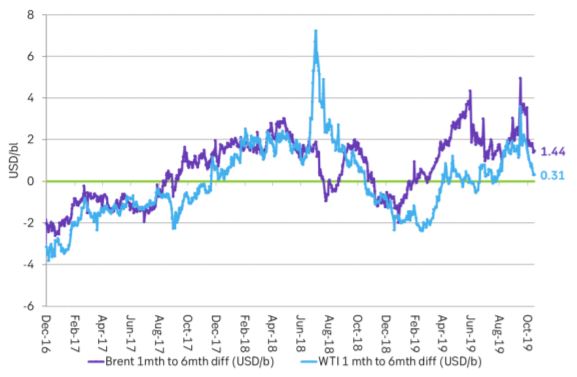
Ch3: The 1-6 month backwardation for Brent and WTI. For WTI now close to zero. For Brent down to $1.4/bl
Ch4: All crude grades are lower. But the increaseing spreads helps to push Permian basin below average levels for this year
Ch5: Saudi Arabia lifted OSPs for all grades to Asia for November
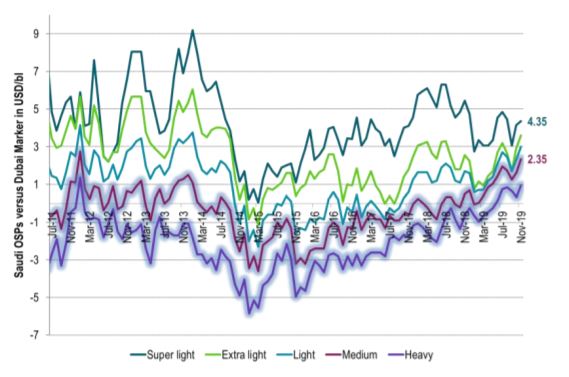
Ch6: Saudi Arabia’s OSPs to Asia ticking higher
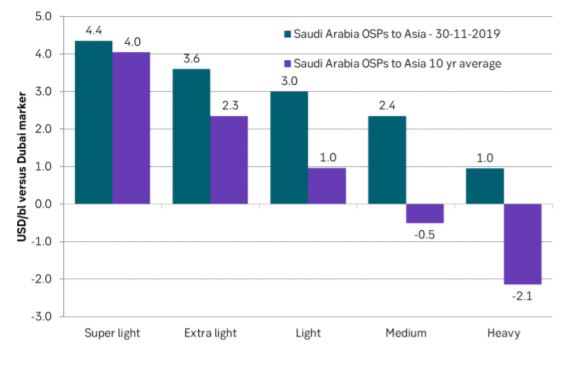
Ch7: Saudi Arabia’s OSPs are above the 10yr average for all grades to Asia
Ch8: The price of High Sulphur bunker oil (HFO 3.5%) continues to drop like a rock versus Brent crude in ARA. Mid-dist cracks continues to tick higher and we think it is just a matter of time before they jump higher.
Ch9: European spot refining margins are close to two year peaks
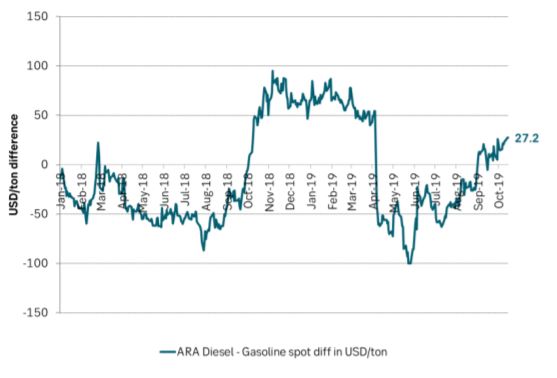
Ch10: ARA Diesel versus Gasoline. Diesel prices are getting relatively stronger and stronger but gasoline prices have not yet crashed to zero.
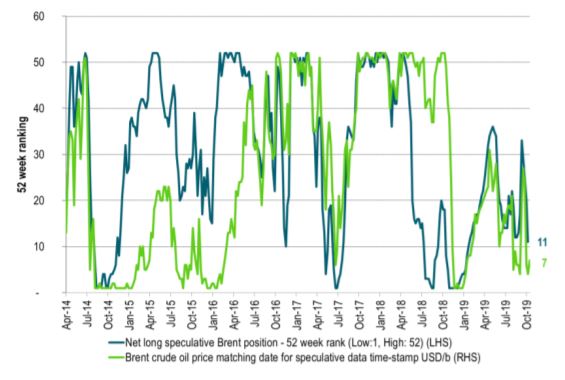
Ch11: Ranking versus 52 past weeks of Brent crude price and the net long speculative positions in Brent crude. Both are getting close to 52 weeks lows but not quite there yet.
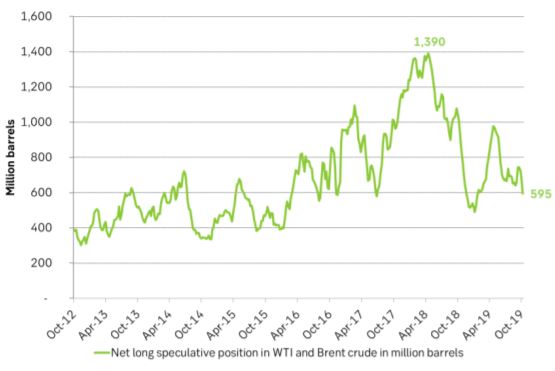
Ch12: Net long Brent and WTI speculative positions at fairly low levels but not yet all the way to the very lows.
Some rebound but not much. Brent crude rebounded 1.5% yesterday to $65.47/b. This morning it is inching 0.2% up to $65.6/b. The lowest close last week was on Thursday at $64.11/b.

The curve structure is almost as week as it was before the weekend. The rebound we now have gotten post the message from OPEC+ over the weekend is to a large degree a rebound along the curve rather than much strengthening at the front-end of the curve. That part of the curve structure is almost as weak as it was last Thursday.
We are still on a weakening path. The message from OPEC+ over the weekend was we are still on a weakening path with rising supply from the group. It is just not as rapidly weakening as was feared ahead of the weekend when a quota hike of 500 kb/d/mth for November was discussed.
The Brent curve is on its way to full contango with Brent dipping into the $50ies/b. Thus the ongoing weakening we have had in the crude curve since the start of the year, and especially since early June, will continue until the Brent crude oil forward curve is in full contango along with visibly rising US and OECD oil inventories. The front-month Brent contract will then flip down towards the $60/b-line and below into the $50ies/b.
At what point will OPEC+ turn to cuts? The big question then becomes: When will OPEC+ turn around to make some cuts? At what (price) point will they choose to stabilize the market? Because for sure they will. Higher oil inventories, some more shedding of drilling rigs in US shale and Brent into the 50ies somewhere is probably where the group will step in.
There is nothing we have seen from the group so far which indicates that they will close their eyes, let the world drown in oil and the oil price crash to $40/b or below.
The message from OPEC+ is also about balance and stability. The world won’t drown in oil in 2026. The message from the group as far as we manage to interpret it is twofold: 1) Taking back market share which requires a lower price for non-OPEC+ to back off a bit, and 2) Oil market stability and balance. It is not just about 1. Thus fretting about how we are all going to drown in oil in 2026 is totally off the mark by just focusing on point 1.
When to buy cal 2026? Before Christmas when Brent hits $55/b and before OPEC+ holds its last meeting of the year which is likely to be in early December.
Brent crude oil prices have rebounded a bit along the forward curve. Not much strengthening in the structure of the curve. The front-end backwardation is not much stronger today than on its weakest level so far this year which was on Thursday last week.

The front-end backwardation fell to its weakest level so far this year on Thursday last week. A slight pickup yesterday and today, but still very close to the weakest year to date. More oil from OPEC+ in the coming months and softer demand and rising inventories. We are heading for yet softer levels.

Down to the lowest since early May. Brent crude has fallen sharply the latest four days. It closed at USD 64.11/b yesterday which is the lowest since early May. It is staging a 1.3% rebound this morning along with gains in both equities and industrial metals with an added touch of support from a softer USD on top.
What stands out the most to us this week is the collapse in the Dubai one to three months time-spread.
Dubai is medium sour crude. OPEC+ is in general medium sour crude production. Asian refineries are predominantly designed to process medium sour crude. So Dubai is the real measure of the balance between OPEC+ holding back or not versus Asian oil demand for consumption and stock building.
A sharp weakening of the front-end of the Dubai curve. The front-end of the Dubai crude curve has been holding out very solidly throughout this summer while the front-end of the Brent and WTI curves have been steadily softening. But the strength in the Dubai curve in our view was carrying the crude oil market in general. A source of strength in the crude oil market. The core of the strength.
The now finally sharp decline of the front-end of the Dubai crude curve is thus a strong shift. Weakness in the Dubai crude marker is weakness in the core of the oil market. The core which has helped to hold the oil market elevated.
Facts supports the weakening. Add in facts of Iraq lifting production from Kurdistan through Turkey. Saudi Arabia lifting production to 10 mb/d in September (normal production level) and lifting exports as well as domestic demand for oil for power for air con is fading along with summer heat. Add also in counter seasonal rise in US crude and product stocks last week. US oil stocks usually decline by 1.3 mb/week this time of year. Last week they instead rose 6.4 mb/week (+7.2 mb if including SPR). Total US commercial oil stocks are now only 2.1 mb below the 2015-19 seasonal average. US oil stocks normally decline from now to Christmas. If they instead continue to rise, then it will be strongly counter seasonal rise and will create a very strong bearish pressure on oil prices.
Will OPEC+ lift its voluntary quotas by zero, 137 kb/d, 500 kb/d or 1.5 mb/d? On Sunday of course OPEC+ will decide on how much to unwind of the remaining 1.5 mb/d of voluntary quotas for November. Will it be 137 kb/d yet again as for October? Will it be 500 kb/d as was talked about earlier this week? Or will it be a full unwind in one go of 1.5 mb/d? We think most likely now it will be at least 500 kb/d and possibly a full unwind. We discussed this in a not earlier this week: ”500 kb/d of voluntary quotas in October. But a full unwind of 1.5 mb/d”
The strength in the front-end of the Dubai curve held out through summer while Brent and WTI curve structures weakened steadily. That core strength helped to keep flat crude oil prices elevated close to the 70-line. Now also the Dubai curve has given in.

Brent crude oil forward curves

Total US commercial stocks now close to normal. Counter seasonal rise last week. Rest of year?

Total US crude and product stocks on a steady trend higher.

Analys
OPEC+ will likely unwind 500 kb/d of voluntary quotas in October. But a full unwind of 1.5 mb/d in one go could be in the cards
Down to mid-60ies as Iraq lifts production while Saudi may be tired of voluntary cut frugality. The Brent December contract dropped 1.6% yesterday to USD 66.03/b. This morning it is down another 0.3% to USD 65.8/b. The drop in the price came on the back of the combined news that Iraq has resumed 190 kb/d of production in Kurdistan with exports through Turkey while OPEC+ delegates send signals that the group will unwind the remaining 1.65 mb/d (less the 137 kb/d in October) of voluntary cuts at a pace of 500 kb/d per month pace.
Signals of accelerated unwind and Iraqi increase may be connected. Russia, Kazakhstan and Iraq were main offenders versus the voluntary quotas they had agreed to follow. Russia had a production ’debt’ (cumulative overproduction versus quota) of close to 90 mb in March this year while Kazakhstan had a ’debt’ of about 60 mb and the same for Iraq. This apparently made Saudi Arabia angry this spring. Why should Saudi Arabia hold back if the other voluntary cutters were just freeriding? Thus the sudden rapid unwinding of voluntary cuts. That is at least one angle of explanations for the accelerated unwinding.
If the offenders with production debts then refrained from lifting production as the voluntary cuts were rapidly unwinded, then they could ’pay back’ their ’debts’ as they would under-produce versus the new and steadily higher quotas.
Forget about Kazakhstan. Its production was just too far above the quotas with no hope that the country would hold back production due to cross-ownership of oil assets by international oil companies. But Russia and Iraq should be able to do it.
Iraqi cumulative overproduction versus quotas could reach 85-90 mb in October. Iraq has however steadily continued to overproduce by 3-5 mb per month. In July its new and gradually higher quota came close to equal with a cumulative overproduction of only 0.6 mb that month. In August again however its production had an overshoot of 100 kb/d or 3.1 mb for the month. Its cumulative production debt had then risen to close to 80 mb. We don’t know for September yet. But looking at October we now know that its production will likely average close to 4.5 mb/d due to the revival of 190 kb/d of production in Kurdistan. Its quota however will only be 4.24 mb/d. Its overproduction in October will thus likely be around 250 kb/d above its quota with its production debt rising another 7-8 mb to a total of close to 90 mb.
Again, why should Saudi Arabia be frugal while Iraq is freeriding. Better to get rid of the voluntary quotas as quickly as possible and then start all over with clean sheets.
Unwinding the remaining 1.513 mb/d in one go in October? If OPEC+ unwinds the remaining 1.513 mb/d of voluntary cuts in one big go in October, then Iraq’s quota will be around 4.4 mb/d for October versus its likely production of close to 4.5 mb/d for the coming month..
OPEC+ should thus unwind the remaining 1.513 mb/d (1.65 – 0.137 mb/d) in one go for October in order for the quota of Iraq to be able to keep track with Iraq’s actual production increase.
October 5 will show how it plays out. But a quota unwind of at least 500 kb/d for Oct seems likely. An overall increase of at least 500 kb/d in the voluntary quota for October looks likely. But it could be the whole 1.513 mb/d in one go. If the increase in the quota is ’only’ 500 kb/d then Iraqi cumulative production will still rise by 5.7 mb to a total of 85 mb in October.
Iraqi production debt versus quotas will likely rise by 5.7 mb in October if OPEC+ only lifts the overall quota by 500 kb/d in October. Here assuming historical production debt did not rise in September. That Iraq lifts its production by 190 kb/d in October to 4.47 mb/d (August level + 190 kb/d) and that OPEC+ unwinds 500 kb/d of the remining quotas in October when they decide on this on 5 October.


Brookfield köper bränsleceller för 5 miljarder USD av Bloom Energy för att driva AI-datacenter

Teck Resources kan förse Nordamerika och kanske hela G7 med all germanium som behövs

Leading Edge Materials är på rätt plats i rätt tid

Oljepriset faller efter ny handelskonflikt mellan USA och Kina

Christian Kopfer kommenterar guld, koppar, olja och stål, samt några råvarubolag

Kinas elproduktion slog nytt rekord i augusti, vilket även kolkraft gjorde

Tyskland har så höga elpriser att företag inte har råd att använda elektricitet

Det stigande guldpriset en utmaning för smyckesköpare

OPEC+ missar produktionsmål, stöder oljepriserna

Ett samtal om guld, olja, fjärrvärme och förnybar energi
-
 Nyheter4 veckor sedan
Kinas elproduktion slog nytt rekord i augusti, vilket även kolkraft gjorde
-
Nyheter4 veckor sedan
Tyskland har så höga elpriser att företag inte har råd att använda elektricitet
-
 Nyheter4 veckor sedan
Det stigande guldpriset en utmaning för smyckesköpare
-
 Nyheter3 veckor sedan
OPEC+ missar produktionsmål, stöder oljepriserna
-
 Nyheter3 veckor sedan
Ett samtal om guld, olja, fjärrvärme och förnybar energi
-
Analys4 veckor sedan
Brent crude ticks higher on tension, but market structure stays soft
-
Analys3 veckor sedan
Are Ukraine’s attacks on Russian energy infrastructure working?
-

 Nyheter2 veckor sedan
Guld nära 4000 USD och silver 50 USD, därför kan de fortsätta stiga