

Analys
US inventories will likely rise less than normal in mths ahead and that is bullish

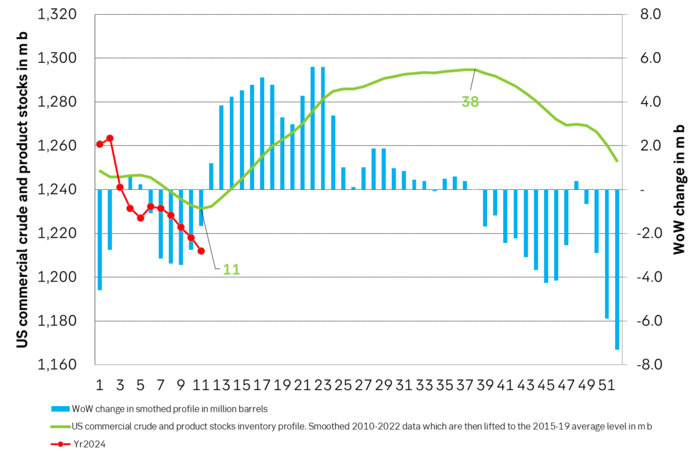
US commercial crude and product stocks will now most likely start to rise on a weekly basis and not really start to decline again before in week 38. We do however expect US inventories to rise less than normal in reflection of a global oil market in a slight deficit. This will likely hand support to the Brent crude oil price going forward.

Shedding some value along with bearish metals and China/HK equity losses. Brent crude has trailed lower since it jumped to an intraday high of USD 87.7/b on 19. March spurred by Ukrainian drone attacks on Russian refineries. Ydy if fell back 0.6% and today it is pulling back another 1% to USD 85.4/b. But the decline today is accompanied by declines in industrial metals together with a 1.3% decline in Chinese and Hong Kong equities. Thus more broad based forces are helping to pull the oil price lower.
US API indicated a 5.4 m b rise in US oil stocks last week. But rising stocks are normal now onwards. The US API ydy indicated that US crude stocks rose 9.3 m b last week while gasoline stocks declined 4.4 m b while distillates rose 0.5 m b. I.e. a total rise in crude and products of 5.4 m b (actual EIA data today at 15:30 CET). That may have helped to push Brent crude lower this morning. It is however very important to be aware that US inventories seasonally tend to rise from week 12 to week 38. And from week 12 to 24 the average weekly rise is 4.1 m b per week. The increase indicated by the US API ydy is thus not at all way out of line with what is normally taking place in the months to come. What really matters is how US commercial inventories do versus what is normal at the time of year.
US commercial stocks have fallen 17 m b more than normal since end of 2023. So far this year we have seen a draw of 39 m b vs the last week of 2023. The normal draw over this period is only -22 m b. I.e. US commercial inventories have drawn down 17 m b more than normal over this period. This has been the gradual, bullish nudge on oil prices. US commercial stocks should normally rise 63.5 m b from week 12 to week 38. What matters to oil prices is thus whether US inventories rise more or less than that over this period.
Drone attacks on Russian refineries was a catalyst to release Brent to higher levels. Brent crude broke out to the upside on 13 March along with the Ukrainian drone attacks on Russian refineries. Some 800 k b/d of refining capacity was hurt and probably went off line. But in the global scheme of things this is a mere 1% or so of total global refining capacity. And if we assume that it is off line for say 3 months, then it equates to maybe 0.25% impact on global refining activity in 2024 which is easy to adapt to. Refining margins have not moved much at all. ARA spot diesel cracks are now USD 2.25/b lower than it was in 12 March 2024. Thus no crisis for refined products at all.
We’ll probably not return to pre-drone attack price level of USD 82/b any time soon. Though a dip to that price level is of course not at all out of the question. The oil market may send the oil price lower in the short term since very little material impact in the global scope of things seems to follow from the drone attacks on Russian refineries. Our view is however that the attacks were more like a catalyst to release the oil price to the upside following a steady and stronger than normal decline in US commercial inventories. I.e. the latest price gains in our view is not so much about an added risk premium in the oil price but more about oil price finally adjusting higher according to the fundamentals which have played out since the start of the year with stronger than normal declines in US commercial inventories. We thus see no immediate return to pre-drone-attack price level of USD 82/b. Rather we expect to see continued support to the upside through steady, gradual inventory erosion versus normal like we have seen so far this year.
Voluntary cuts by Russia in Q2-24 could be bullish if delivered as promised. Earlier in March we saw Russia’n willingness to cut back supply in Q2-24 in a mix of production restraints and export restraints. Saudi Arabia and Russia are equal partners in OPEC+ with equal magnitudes of production. In a reflection of this they set equal baselines in May 2020 of 11.0 m b/d. Saudi Arabia produced 9.0 m b/d in February while Russia produced 9.4 m b/d. This is probably why Russia in early March stated that they were willing to cut back in Q2-24. To align more with what Saudi Arabia is producing. It has been of huge importance that Saudi Arabia last year cut its production down to 9.0 m b/d and thus below Russian production. This reactivated Russia as a dynamic, proactive participant in OPEC+. The actual effect of proclaimed production/export cuts by Russia in Q2-24 remains to be seen, but calls for USD 100/b as a consequence of such cuts have surfaced.
So far we haven’t lost a single drop of oil due to Houthie attacks in the Red Sea. We have lost some up-time in Russia refining due to Ukrainian drone strikes lately. But nothing more than can be compensated elsewhere in the world. Temporarily reduced volumes of refined hydrocarbons from Russian will instead lead to higher exports of unrefined molecules (crude oil).
For now OPEC+ is comfortably controlling the oil market and the market will likely be running a slight deficit as a result with inventories getting a continued gradual widening, negative difference versus normal levels thus nudging the oil price yet higher. SEB’s forecast for Brent crude average 2024 is USD 85/b. This means that we’ll likely see both USD 90/b and maybe also USD 100/b some times during the year. But do make sure to evaluate changes in US oil inventories versus what is normal at the time of year. Rising inventories are bullish if they rise less than what is normal from now to week 38.
US commercial crude and product stocks will likely rise going forward. But since the global oil market is likely going to be in slight deficit we’ll likely see slower than normal rise in US inventories with an increasing negative difference to normal inventory levels.
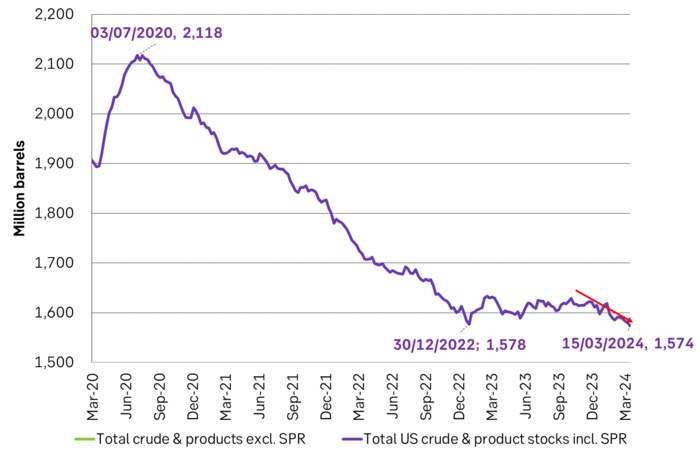
Total US crude and product stocks incl. SPR are now 4 m b below the low-point from December 2022
Brent crude has climbed roughly USD 1.5-2 per barrel since Friday, yet falling USD 0.3 per barrel this mornig and currently trading near USD 67.25/bbl after yesterday’s climb. While the rally reflects short-term geopolitical tension, price action has been choppy, and crude remains locked in a broader range – caught between supply-side pressure and spot resilience.

Prices have been supported by renewed Ukrainian drone strikes targeting Russian infrastructure. Over the weekend, falling debris triggered a fire at the 20mtpa Kirishi refinery, following last week’s attack on the key Primorsk terminal.
Argus estimates that these attacks have halted ish 300 kbl/d of Russian refining capacity in August and September. While the market impact is limited for now, the action signals Kyiv’s growing willingness to disrupt oil flows – supporting a soft geopolitical floor under prices.
The political environment is shifting: the EU is reportedly considering sanctions on Indian and Chinese firms facilitating Russian crude flows, while the U.S. has so far held back – despite Bessent warning that any action from Washington depends on broader European participation. Senator Graham has also publicly criticized NATO members like Slovakia and Hungary for continuing Russian oil imports.
It’s worth noting that China and India remain the two largest buyers of Russian barrels since the invasion of Ukraine. While New Delhi has been hit with 50% secondary tariffs, Beijing has been spared so far.
Still, the broader supply/demand balance leans bearish. Futures markets reflect this: Brent’s prompt spread (gauge of near-term tightness) has narrowed to the current USD 0.42/bl, down from USD 0.96/bl two months ago, pointing to weakening backwardation.
This aligns with expectations for a record surplus in 2026, largely driven by the faster-than-anticipated return of OPEC+ barrels to market. OPEC+ is gathering in Vienna this week to begin revising member production capacity estimates – setting the stage for new output baselines from 2027. The group aims to agree on how to define “maximum sustainable capacity,” with a proposal expected by year-end.
While the IEA pegs OPEC+ capacity at 47.9 million barrels per day, actual output in August was only 42.4 million barrels per day. Disagreements over data and quota fairness (especially from Iraq and Nigeria) have already delayed this process. Angola even quit the group last year after being assigned a lower target than expected. It also remains unclear whether Russia and Iraq can regain earlier output levels due to infrastructure constraints.
Also, macro remains another key driver this week. A 25bp Fed rate cut is widely expected tomorrow (Wednesday), and commodities in general could benefit a potential cut.
Summing up: Brent crude continues to drift sideways, finding near-term support from geopolitics and refining strength. But with surplus building and market structure softening, the upside may remain capped.
Brent crude is essentially flat on the week, but after a volatile ride. Prices started Monday near USD 65.5/bl, climbed steadily to a mid-week high of USD 67.8/bl on Wednesday evening, before falling sharply – losing about USD 2/bl during Thursday’s session.
Brent is currently trading around USD 65.8/bl, right back where it began. The volatility reflects the market’s ongoing struggle to balance growing surplus risks against persistent geopolitical uncertainty and resilient refined product margins. Thursday’s slide snapped a three-day rally and came largely in response to a string of bearish signals, most notably from the IEA’s updated short-term outlook.
The IEA now projects record global oversupply in 2026, reinforcing concerns flagged earlier by the U.S. EIA, which already sees inventories building this quarter. The forecast comes just days after OPEC+ confirmed it will continue returning idle barrels to the market in October – albeit at a slower pace of +137,000 bl/d. While modest, the move underscores a steady push to reclaim market share and adds to supply-side pressure into year-end.
Thursday’s price drop also followed geopolitical incidences: Israeli airstrikes reportedly targeted Hamas leadership in Doha, while Russian drones crossed into Polish airspace – events that initially sent crude higher as traders covered short positions.
Yet, sentiment remains broadly cautious. Strong refining margins and low inventories at key pricing hubs like Europe continue to support the downside. Chinese stockpiling of discounted Russian barrels and tightness in refined product markets – especially diesel – are also lending support.
On the demand side, the IEA revised up its 2025 global demand growth forecast by 60,000 bl/d to 740,000 bl/d YoY, while leaving 2026 unchanged at 698,000 bl/d. Interestingly, the agency also signaled that its next long-term report could show global oil demand rising through 2050.
Meanwhile, OPEC offered a contrasting view in its latest Monthly Oil Market Report, maintaining expectations for a supply deficit both this year and next, even as its members raise output. The group kept its demand growth estimates for 2025 and 2026 unchanged at 1.29 million bl/d and 1.38 million bl/d, respectively.
We continue to watch whether the bearish supply outlook will outweigh geopolitical risk, and if Brent can continue to find support above USD 65/bl – a level increasingly seen as a soft floor for OPEC+ policy.
Brent crude makes some gains as Israel’s attack on Hamas in Qatar rattles markets. Brent crude spiked to a high of USD 67.38/b yesterday as Israel made a strike on Hamas in Qatar. But it wasn’t able to hold on to that level and only closed up 0.6% in the end at USD 66.39/b. This morning it is starting on the up with a gain of 0.9% at USD 67/b. Still rattled by Israel’s attack on Hamas in Qatar yesterday. Brent is getting some help on the margin this morning with Asian equities higher and copper gaining half a percent. But the dark cloud of surplus ahead is nonetheless hanging over the market with Brent trading two dollar lower than last Tuesday.

Geopolitical risk premiums in oil rarely lasts long unless actual supply disruption kicks in. While Israel’s attack on Hamas in Qatar is shocking, the geopolitical risk lifting crude oil yesterday and this morning is unlikely to last very long as such geopolitical risk premiums usually do not last long unless real disruption kicks in.
US API data yesterday indicated a US crude and product stock build last week of 3.1 mb. The US API last evening released partial US oil inventory data indicating that US crude stocks rose 1.3 mb and middle distillates rose 1.5 mb while gasoline rose 0.3 mb. In total a bit more than 3 mb increase. US crude and product stocks usually rise around 1 mb per week this time of year. So US commercial crude and product stock rose 2 mb over the past week adjusted for the seasonal norm. Official and complete data are due today at 16:30.
A 2 mb/week seasonally adj. US stock build implies a 1 – 1.4 mb/d global surplus if it is persistent. Assume that if the global oil market is running a surplus then some 20% to 30% of that surplus ends up in US commercial inventories. A 2 mb seasonally adjusted inventory build equals 286 kb/d. Divide by 0.2 to 0.3 and we get an implied global surplus of 950 kb/d to 1430 kb/d. A 2 mb/week seasonally adjusted build in US oil inventories is close to noise unless it is a persistent pattern every week.
US IEA STEO oil report: Robust surplus ahead and Brent averaging USD 51/b in 2026. The US EIA yesterday released its monthly STEO oil report. It projected a large and persistent surplus ahead. It estimates a global surplus of 2.2 m/d from September to December this year. A 2.4 mb/d surplus in Q1-26 and an average surplus for 2026 of 1.6 mb/d resulting in an average Brent crude oil price of USD 51/b next year. And that includes an assumption where OPEC crude oil production only averages 27.8 mb/d in 2026 versus 27.0 mb/d in 2024 and 28.6 mb/d in August.
Brent will feel the bear-pressure once US/OECD stocks starts visible build. In the meanwhile the oil market sits waiting for this projected surplus to materialize in US and OECD inventories. Once they visibly starts to build on a consistent basis, then Brent crude will likely quickly lose altitude. And unless some unforeseen supply disruption kicks in, it is bound to happen.
US IEA STEO September report. In total not much different than it was in January

US IEA STEO September report. US crude oil production contracting in 2026, but NGLs still growing. Close to zero net liquids growth in total.


Tyskland har så höga elpriser att företag inte har råd att använda elektricitet
Brent crude ticks higher on tension, but market structure stays soft

Kinas elproduktion slog nytt rekord i augusti, vilket även kolkraft gjorde

Det stigande guldpriset en utmaning för smyckesköpare

Aktier i guldbolag laggar priset på guld

Meta bygger ett AI-datacenter på 5 GW och 2,25 GW gaskraftverk
Aker BP gör ett av Norges största oljefynd på ett decennium, stärker resurserna i Yggdrasilområdet
Brent sideways on sanctions and peace talks

Ett samtal om koppar, kaffe och spannmål
Sommarens torka kan ge högre elpriser i höst
-
 Nyheter4 veckor sedan
Meta bygger ett AI-datacenter på 5 GW och 2,25 GW gaskraftverk
-
 Nyheter4 veckor sedan
Aker BP gör ett av Norges största oljefynd på ett decennium, stärker resurserna i Yggdrasilområdet
-
Analys4 veckor sedan
Brent sideways on sanctions and peace talks
-
 Nyheter4 veckor sedan
Ett samtal om koppar, kaffe och spannmål
-
 Nyheter4 veckor sedan
Sommarens torka kan ge högre elpriser i höst
-
Analys4 veckor sedan
Brent edges higher as India–Russia oil trade draws U.S. ire and Powell takes the stage at Jackson Hole
-

 Nyheter3 veckor sedan
Mahvie Minerals är verksamt i guldrikt område i Finland
-
Analys3 veckor sedan
Increasing risk that OPEC+ will unwind the last 1.65 mb/d of cuts when they meet on 7 September