

Analys
From surge to slump for natural gas: Navigating the new normal in Europe

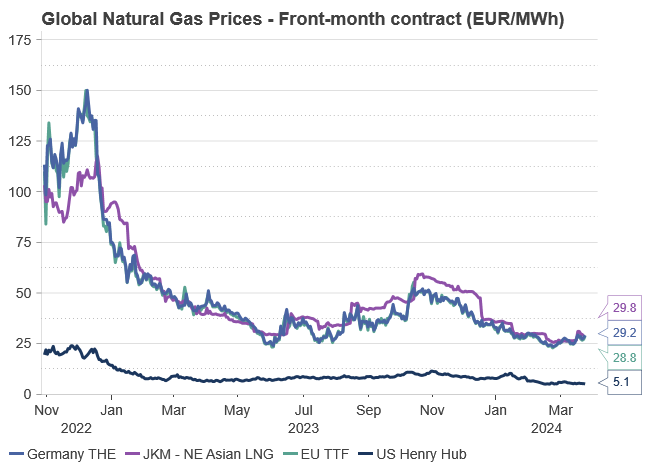
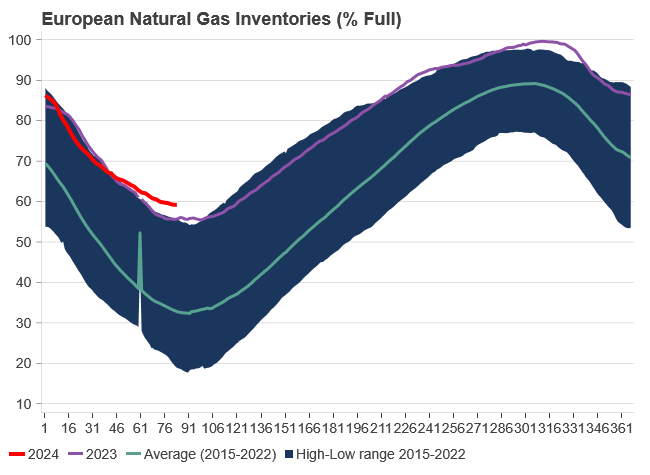
Over the past 4-5 months, EU natural gas prices, indicated by the TTF benchmark, have plummeted by 50% from an October high of EUR 56/MWh to the current EUR 28/MWh for the front-month contract, defying expectations of seasonal price increases. This downturn can be attributed to robust EU inventories at 59% capacity and persistently subdued natural gas demand, down by 11% compared to historical norms. Mild weather in Northwest Europe and a prolonged industrial recession have suppressed consumption, resulting in a significant gas surplus despite nearing the end of the winter heating season (90% complete). These factors collectively exert downward pressure on prices.

The correlation between Brent and TTF prices remains from times partly “fluid”. In our December 2023 natural gas price update, we predicted a constrained global natural gas market, anticipating a swift resurgence in demand following a decline in gas prices. Our projections were underpinned by a robust Brent Crude price outlook, set at USD 85/bl, USD 87.5/bl, and USD 90/bl for 2024, 2025, and 2026 respectively, with a Crude-to-gas rate of 80%. However, this scenario has yet to materialize as the anticipated demand recovery has been notably delayed, requiring even lower prices than initially predicted for its realization—a phenomenon unique in recent memory.
Achieving a global natural gas price convergence towards levels more aligned with Brent Crude appears plausible, signaling a return to a measure of normalcy. The absence of a winter premium during the 2023/24 winter season suggests a healthier outlook for Q2-24, mitigating the risk of substantial short-term price spikes in European gas markets. The sporadic spikes witnessed in 2022 and partially in 2023 are now a thing of the past, indicating a change from the volatility experienced in recent years.
Short-term EU gas prices hinge heavily on immediate weather patterns and industrial gas demand, both exerting considerable influence on inventory levels, which serve as a critical gauge of supply and demand dynamics. Looking further ahead, the trajectory of prices is linked with the global LNG balance, particularly contingent upon factors such as projected US natural gas production and the capacity of US LNG exports to the global market.
Moreover, the declining influence of Russia on the European gas market is notable, with sporadic gas export halts from the former energy powerhouse carrying reduced impact. Global market recalibrations indicate a sustained elevation in price levels, with EUR 30/MWh emerging as a feasible benchmark for the foreseeable future. We also call “the end of the energy crisis”, as the worst is history. Reflecting on the current year, EU TTF prices hit the lowest point in late February, with expectations of a potential slide/climb from current prices at EUR 28/MWh.
In essence, our current natural gas price forecast hinges on a delicate equilibrium among three pivotal factors. Firstly, the TTF price must strike a balance, remaining sufficiently low to stimulate a resurgence in demand. For context, the historical average real price hovers around EUR 27/MWh, with EUR 30/MWh anticipated to gradually encourage demand recovery, thereby mitigating the effects of demand destruction. Secondly, the TTF price should maintain a relatively ”normal” relationship with Crude prices, as historical trends indicate a natural correlation between the two. A notably low rate would invariably attract heightened interest from Asian markets, as LNG emerges as a cost-effective alternative to oil in terms of energy content. Lastly, the TTF price must also exhibit a level of elevation to cover the expenses associated with producing and transporting US natural gas to the European market. This entails factoring in costs related to Henry Hub, tolling fees, liquefaction, transportation, and regasification, among other associated expenses. Achieving a delicate equilibrium among these factors is vital for ensuring the stability and sustainability of natural gas pricing dynamics in the European market.
Consequently, our current stance reflects a delicate balancing act among these three critical factors. Settling on EUR 30/MWh, we predict that prices lower than this threshold would catalyze a swifter demand resurgence, while simultaneously enhancing the appeal of natural gas against oil as the spread widens. Moreover, importation from the USA would encounter mounting challenges as prices decline, particularly approaching the EUR 25/MWh mark when landed in ARA.
The TTF market has been complexly interlinked with the global LNG market at the margins since 2015, many years before the energy crisis. While the proportion of LNG consumed in Europe has surged significantly, the concept of LNG prices influencing TTF prices at the margin is not new. However, in terms of volume, the current situation declares us notably more vulnerable than in previous years.
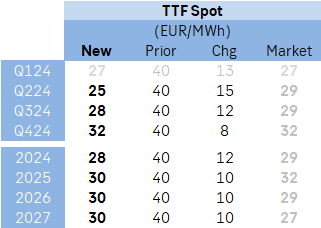
In our updated projections, we have revised our price forecasts downward, particularly notable at the front end, encompassing Q2-24, Q3-24, and the Full-year (FY) 2024. Other adjustments, though marginally smaller, remain for FY 2025, 2026, and 2027. Despite these reductions, we anticipate a trajectory of increasing European natural gas prices from their current levels. Notably, Q1-24 is now expected to average EUR 27/MWh, followed by predictions of EUR 25/MWh, EUR 28/MWh, and EUR 32/MWh for Q2-24, Q3-24, and Q4-24 respectively. Consequently, the average for FY 2024 is forecasted at EUR 28/MWh, marking a notable decline from the previous estimate of EUR 40/MWh.
In our outlook for longer-term pricing, we anticipate an average of EUR 30/MWh for the years 2025, 2026, and 2027—a reduction of EUR 10/MWh compared to our previous update in December 2023, which projected EUR 40/MWh. This long-term forecast only sits marginally higher, by EUR 3-4/MWh, than the historical average real price of approximately EUR 27/MWh. Such pricing aligns intending to stimulate further demand recovery and maintain consumer affordability within the European economy. Reflecting on historical trends, previous price levels in the European market might be seen as reliant on potentially risky agreements with Russia. Consequently, the era of exceptionally low-cost energy is drawing to a close, indicating a new paradigm where European gas and power are priced slightly higher, establishing a ”new normal” for the foreseeable future.
PRICE ACTION
The absence of a winter premium for global natural gas is notable. Our longer-term natural gas price projection, set at EUR 30/MWh, demonstrates resilience compared to historical market norms. Last quarter (Q4-23) closed at EUR 43/MWh for the front-month contract, a figure approximately EUR 10/MWh lower than our recent expectations. Noteworthy market adjustments have transpired not only within the European gas market but also on a global scale. This ongoing adaptation is expected to continue influencing the gas market into 2024, resulting in fewer severe price spikes and a return to more normal price differentials.
Maintaining our gas price forecast at EUR 30/MWh for 2025 suggests an expectation for European natural gas prices to stabilize at current market rates. This projection extends to 2026 and 2027, which stand roughly 30% higher than historical norms – a contrast to the previous era of favorable deals with Russia flooding European consumers with low-cost piped natural gas.
Considerable attention is drawn to the relationship between gas and oil prices. With our oil market outlook projecting USD 85/bl, USD 87.5/bl, and USD 90/bl for 2024, 2025, and 2026 respectively, the convergence of gas prices to more normal circumstances implies a corresponding alignment with oil prices. Historically, EU natural gas prices have traded at 0.55-0.6 times Brent crude prices, a figure that is expected to converge closer to historical norms. However, our forecasts for 2024, 2025, and 2026 slightly exceed historical norms, at 0.62 x Brent, 0.65 x Brent, and 0.62 x Brent respectively, reflecting a tighter natural gas balance in the coming years.
The transformation of global LNG trade, from roughly 5% spot and short-term LNG trade in 2000 to roughly 30% in 2023, underscores a higher degree of flexibility in negotiating spot and short-term LNG contracts. This evolution suggests a shift towards contracts potentially decoupled from Brent indexations, challenging the conventional reliance on oil prices as a benchmarking tool for global natural gas prices.
US LNG
A significant surge in global liquefaction (export) capacity is anticipated from the US and Qatar starting in 2026 and beyond. These large-scale liquefaction projects typically entail long-term contracts with predefined off-takers or demand centers, primarily serving power plants or industrial applications. The transportation of substantial LNG volumes from the US to Europe underscores strategic economic and energy considerations. The US, propelled by abundant shale gas resources and extensive LNG liquefaction infrastructure, has emerged as a major LNG exporter. Europe, seeking to diversify energy sources and reduce dependence on Russia, offers an attractive market for American LNG. Additionally, LNG’s flexibility as a cleaner-burning fuel aligns with Europe’s environmental sustainability objectives and transition away from coal.
The transatlantic LNG trade between the US and Europe capitalizes on arbitrage opportunities driven by regional gas price variations and demand-supply imbalances. This flow not only enhances energy security for European nations but also aids NE Asia in meeting environmental obligations.
The US-Europe netback for LNG cargo depends on various economic factors, including global natural gas prices, US regional supply and demand dynamics, and fluctuations in shipping costs.
The competitiveness of US LNG in the European market is influenced by several factors, including the US benchmark price for domestic natural gas (Henry Hub), source gas costs, voyage costs, shipping costs, and regasification costs at the destination.
In more detail the competitiveness of US LNG in the European market is influenced by factors such as the US benchmark price for domestic natural gas (Henry Hub); Source gas cost (Henry Hub + Tolling fee and liquefaction fee); voyage cost (Insurance, port, canal, boil-off, and fuel cost); shipping cost at day rate; and regasification cost in the other end.
A simplified calculation demonstrates the US-EU arbitrage opportunity. At current market figures, the total cost of delivering LNG from the US to Europe is roughly USD 7.05/MMBtu or approximately EUR 22/MWh. Comparatively, the EU TTF front-month contract trades at EUR 28/MWh, indicating an average EUR 6/MWh arbitrage opportunity and an equal profit margin for traders. However, with state-of-the-art LNG vessels, the total cost could decrease significantly, resulting in a substantial profit margin for traders.
The calculation (with current market figures all in USD per MMBtu as a standard unit):
Front-month Henry Hub (1.65) + 15% tolling fee (0.25) and liquefaction fee for conventional LNG ships (2.5) + Insurance, port, and canal (on average 0.33) + boil-off and fuel cost (on average 1.2) + regasification (0.5) + shipping cost at current day rate (0.62).
i.e., for total cost from the US to Europe we get 1.65 + 0.25 + 2.5 + 0.33 + 1.2 + 0.5 + 0.62 = USD 7.05/MMBtu – or roughly EUR 22/MWh. At the time of writing, the EU TTF front-month contract is trading at EUR 28/MWh. Hence, in the current spot market, the US-EU arbitrage is at roughly on average EUR 6/MWh and equally EUR 6/MWh profit to trader. However, this is a conservative estimate. In a situation with a state-of-the-art MEGI / X-DF LNG vessel, we would have a lower liquefaction fee and per unit insurance, boil-off, and fuel cost, which would imply a total cost of USD 6.0/MMBtu (EUR 18.5/MWh) – consequently, a massive EUR 9.5/MWh profit to the trader. Understating the massive economic argument in shipping LNG from the US to the EU (at current market rates).
But even though a substantial arrival of LNG export capacity in the US is approaching, it is not like the US has unlimited natural gas production, or unlimited LNG capacity to feed the global thirst for LNG. Hence, it is not like the EU TTF will plunge to levels comparable to the US Henry Hub + all associated costs for delivering to the EU.
A substantial surge in LNG export capacity is imminent, fueled by significant investments totaling USD 235 billion directed towards upcoming super-chilled fuel projects since 2019. The majority of these projects are slated to come online from the second half of 2025 onward, with an additional USD 55 billion investment expected by 2025, driving a remarkable 45% surge in LNG liquefaction capacity by the end of the decade.
Currently, the global LNG export market boasts a total capacity of approximately 420 million tonnes, projected to expand significantly to 610 million tonnes by 2030. The bulk of this expansion will stem from Qatar, Russia, and the US, with capacities increasing by roughly 23, 26, and 117 million tonnes respectively from 2024 to 2030.
However, it’s worth noting that on January 26, 2024, the Biden Administration paused LNG exports to non-FTA countries, awaiting updated analyses by the DOE. This affects 4 major projects and risks WTO challenges. The DOE cites outdated assessments, signaling a policy shift and raising market uncertainties.
This pause could have significant geopolitical and trade implications, as it also becomes an election issue. Stakeholders, including exporters and developers, now face uncertainties and must review agreements. Overall, the pause prompts a broader review of LNG export policies, impacting domestic and international markets. However, it’s too early to fully assess its impact, so the aforementioned capacity forecast remains firm for now.
The industry’s confidence is underpinned by the anticipation of rising LNG demand, driven by Europe’s efforts to reduce reliance on Russian gas and Asia’s shift away from coal, particularly in China. Yet, this expansion is not merely speculative; it represents a long-term commitment between suppliers and off-takers. These projects typically entail long-term contracts of 20+ years, often supplying power plants or industrial applications. Consequently, the new LNG export capacity is expected to match a similar scale of demand.
The significant export ventures from the United States to Qatar will further cement LNG’s role in the global energy landscape, with contracts extending well into the 2050s, even surpassing some carbon-neutral targets.
Moreover, there remains ample room for natural gas in the long run. The COP28 acknowledged that transitional fuels like LNG can facilitate the energy transition, signaling implicit support for LNG over dirtier fossil fuels.
Critics argue that natural gas isn’t the most environmentally friendly fossil fuel due to potential methane leakage along the supply chain. However, such concerns arise belatedly as the wave of new facilities is already underway. With oil demand reaching its peak and coal declining gradually, gas is expected to maintain its prominence in the energy mix.
SUPPLY & DEMAND
In the short term, the winter wildcard/premium is gone, pointing to a healthier Q2 2024. We have, a while back, pinpointed that the European natural gas market is in a limbo state between supply uncertainties and demand uncertainties. With a consequence of a winter wildcard largely being balanced by the short/medium-term weather and withdrawal rate of European natural gas inventories.
Recent weather forecasts predict slightly colder temperatures in early April across Northwest Europe, but the preceding winter months saw normal to milder conditions, resulting in lower-than-expected inventory drawdowns and weak price trends.
Looking ahead, forecasts for April to June 2024 suggest above-normal temperatures in Northwest Europe, reducing heating and power demand and maintaining subdued gas consumption. Prices in Q2-24 are forecasted to average around EUR 25/MWh.
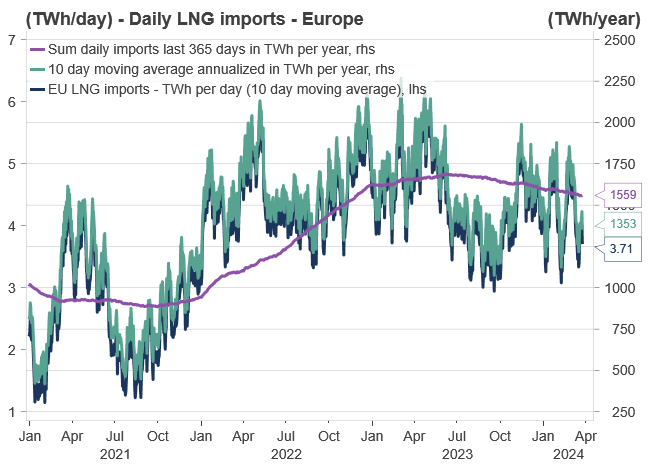
Furthermore, it is easy to think of the faded energy crisis as a European crisis. But the adaptation for global gas markets has been equally/more important. Very high global gas prices have resulted in adaption in all corners of the globe, consequently, easing the global natural gas balance and freeing more gas volumes to the highest bidder at more “reasonable” prices. During the peak of the crisis, the highest bidder was naturally Europe which was sucking up all excess global LNG volumes. However, at the current price levels, the “three importing giants”, namely China, South Korea, and Japan have finally woken up, and are no longer “re-routing” their LNG cargos, while also actively participating in the short-term/spot market.
Russia’s grip over the EU is expected to weaken in the spring/summer of 2024. Since February/March 2022, President Putin sought to balance revenue generation and geopolitical pressure by controlling the energy supply to the EU. This strategy faced challenges: reducing exports to zero would jeopardize revenue, while high exports would alleviate the EU’s energy crisis, as seen in winter 2022/23. Despite efforts, Putin’s goal of using natural gas as a strategic tool faltered in winter 2023/24.
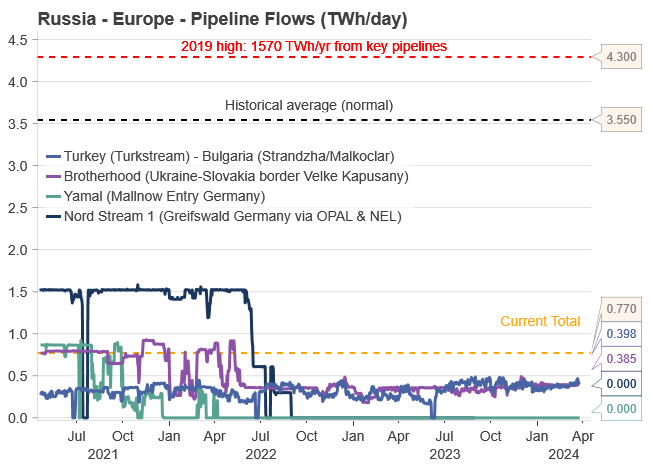
Market adaptation ensued. Since December 2022, Russian piped gas supply to Europe has fluctuated between 10-25% of historical averages, currently nearing 20%. To intensify geopolitical pressure, Russia may need to further reduce flows, possibly to around 10% in winter 2024/25. Despite the distant outlook, the market has already factored in potential price increases for next winter.
Two main pipelines deliver Russian gas to Europe: ”Turkstream,” to Turkey, and the ”Brotherhood,” through Ukraine to Slovakia. These pipelines each contribute roughly 50% of the 0.75 TWh per day flow. The pipeline via Ukraine faces physical risks, and a supply halt is likely next winter as the transit agreement between Gazprom and Naftogaz expires in December 2024, with little chance of renewal.
EU INVENTORIES
The trajectory of EU natural gas inventories for the upcoming summer is primarily influenced by both the global LNG market and European natural gas demand. In Q2-23 (one year ago), inventories commenced the injection season at an all-time high, leading to the current record-high inventory status. These comfortable inventories suggest the EU has the situation under control as it emerges from the winter season. Currently, inventories stand at 59%, a substantial 25% above the 2015-2022 average.
Despite missing out on over 1,000 TWh of natural gas imports from Russia compared to historical levels, the mild winter of 2022/23, reduced demand due to high prices, and increased LNG imports compensated with an additional 1,400 TWh. This over-compensation of 400 TWh in Q1-23 facilitated an unprecedented injection rate into European inventories during Q1 and Q2 2023. As a result, European inventories shifted from a deficit of 180 TWh in January 2022 to a surplus of 259 TWh in April 2023, leading to the current record-high levels.
However, if NE Asia, predominantly led by China, continues to outbid the EU for LNG cargo and industrial gas demand increases due to favorable long-term hedging levels, current comfortable inventory levels will gradually return to normal. This suggests EU TTF prices will slowly climb towards over EUR 30/MWh by the next heating season, a trend partly factored into current pricing.
While the crisis urgency has faded, market adjustments now activate at lower price thresholds. Nonetheless, we anticipate slightly higher long-term price levels (EUR 30/MWh) due to increasing LNG bids from China (+NE Asia), a rebound in EU demand, and reduced LNG imports influenced by lower prices. This will result in a slower inventory build during Q2-24 and Q3-24 compared to last year. Despite diminishing supply from Russia, the EU remains focused on maintaining preparedness for future winters, leading to a new normal in natural gas inventory levels throughout the year.
The European energy crisis has significantly eased during 2023 and Q1-24. Softened front-end prices influence longer-dated prices, with the winter premium/seasonality fully washed out during the ongoing heating season. Healthy EU natural gas inventories, currently at 59% capacity (675 TWh) and surpassing the European Commission’s target of reaching 90% storage fullness by 1 November, contribute to this subsiding crisis. Continued subdued European consumption (11% below historical averages) and robust LNG imports set a ceiling on short-term prices, although increased EU demand could quickly alter this scenario, as EU demand has proven stickier than anticipated.
DEMAND RECOVERY
Reduced uncertainty and lower prices are expected to lead to more long-term hedging. Since the start of Q1 2024 (year-to-date), the TTF spot has averaged EUR 27/MWh, approximately USD 50/boe, only marginally below the ’historical norm’ when adjusted for inflation. Despite these price levels, a resurgence in European industrial gas consumption during the winter is not straightforward.
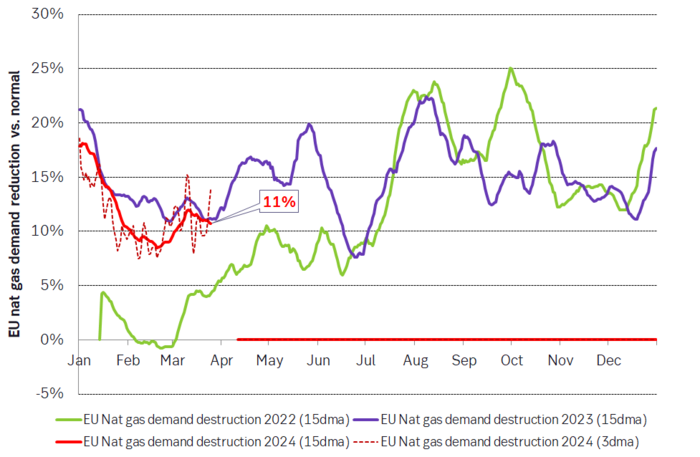
Industrial gas demand remains subdued, sitting 11% below historical averages. While this marks an improvement from the 25-30% drop experienced in mid-summer 2022 – a period characterized as the ”peak of the crisis” – when spot prices consistently traded at EUR 150/MWh (USD 255/boe).
The slower-than-expected recovery is largely attributed to industries hesitating to commit to longer-term prices. For example, during Q4 2023, despite tumbling spot prices, futures prices remained strong. In mid-October, gas for delivery in January 2024 was priced at EUR 55/MWh (USD 103/boe). Thus, during Q4 2023, peak-winter prices maintained a considerable premium over spot prices to a large extent.
However, the current landscape has changed. The winter premium has diminished as we exit the heating season, and weak spot prices predominantly drive forward. This reflects a market that is more certain and willing to forecast futures during a less turbulent phase. The convergence and narrowing gap between spot and long-term prices signify that ”peak natural gas has passed.” Major consumers in Europe are expected to adopt more long-term hedging for longer-term prices, ideally hedging these futures close to current spot prices. This suggests that current market prices will likely trigger increased consumption compared to Q3 and Q4 2023, although a full-scale comeback will take time.
As previously noted, substantial demand destruction occurred not only in Europe but also globally, particularly in Asia. Over the last couple of years, demand destruction amounted to approximately 800 TWh per year, while the normal growth rate in the global LNG market is 200 TWh per annum. This indicates that most of the demand will eventually return, although the timing remains uncertain.
NE ASIAN LNG
EUR 25/MWh presents a favorable ”buy opportunity,” and prices are expected to either slide or climb from this point. The decline in prices can be attributed to sustained low demand and high inventories. We anticipate prices to either slide or increase from here, with minimal downside, as prices are likely to find support around EUR 25/MWh.
Forward prices for both JKM and TTF indicate that the NE Asian LNG market will remain a preferred destination for marginal LNG cargo in the near term. While the EU previously heavily relied on NE Asia, the European market can no longer solely depend on the economic vulnerabilities of NE Asia or China.
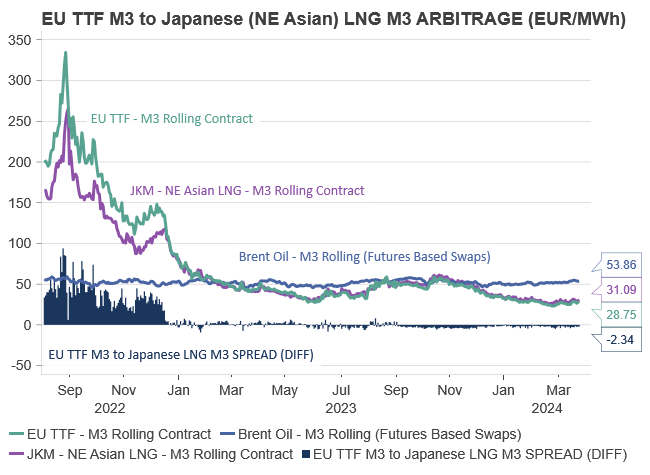
A long-awaited pent-up demand for energy in China would lead to increased demand for goods and services, consequently boosting energy consumption, particularly natural gas, primarily in the form of LNG. In such a scenario, the JKM may command a larger premium over the TTF than the existing EUR 2.5/MWh (3-month rolling contract). This would divert LNG spot cargoes away from Europe, further reducing the EU’s natural gas surplus. Thus, the ongoing recovery in China’s economy is likely to stimulate Asia’s demand for natural gas, potentially resulting in EU LNG purchasers paying a premium to secure essential LNG imports in the future.
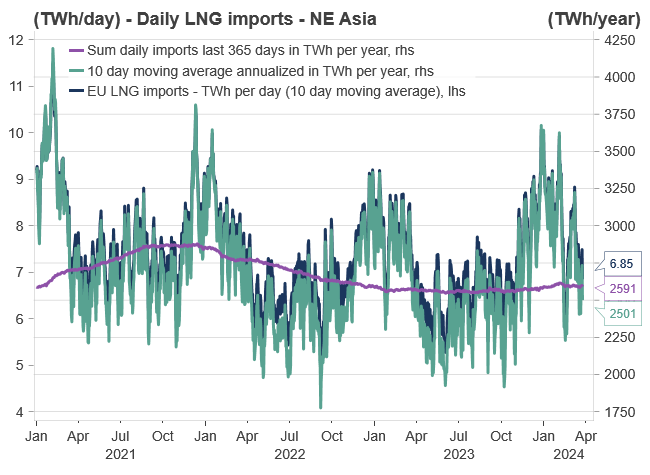
With current prices, we anticipate an increase in EU demand coupled with a decrease in EU LNG imports. This trend may persist until we observe a slight shortfall in compensation relative to the natural gas deficit from Russia, which could drive prices upward during the summer.
KEY TAKEAWAYS
The ongoing transition from coal to natural gas signifies a significant shift in the global energy landscape. Natural gas emerges as a crucial bridging technology, offering a cleaner alternative to coal and facilitating the transition toward widespread adoption of renewable energy sources. This transition underscores the environmental benefits of natural gas, positioning it as a pivotal component in mitigating climate change and reducing greenhouse gas emissions.
Despite challenges such as the reduction in Russian gas supply, the natural gas market is adapting rapidly. Europe, in particular, faces competition for global LNG volumes, primarily sourced from the US and Qatar. The market’s ability to swiftly adjust reflects its adaptability and resilience on a global scale, highlighting the importance of diversifying energy sources and supply routes.
Our current natural gas price forecast relies on achieving a delicate equilibrium among key factors. This includes stimulating demand, maintaining a correlation with crude prices, and ensuring cost coverage for US natural gas transportation. Striking this balance is essential for maintaining stability and sustainability in European gas pricing dynamics, ensuring energy security.
In response to changing market conditions, we have revised our price outlook downward for the short term, notably for Q2-24, Q3-24, and FY 2024. Specifically, Q1-24 is forecasted to average EUR 27/MWh, followed by predictions of EUR 25/MWh for Q2-24, EUR 28/MWh for Q3-24, and EUR 32/MWh for Q4-24. However, prices are expected to gradually increase over the longer term, with an average forecast of EUR 30/MWh for the years 2025, 2026, and 2027, slightly higher than historical averages.
This revised outlook reflects the evolving nature of the natural gas market and the need for flexibility in response to changing geopolitical landscapes and supply dynamics. Looking ahead, natural gas remains a crucial bridge over coal, facilitating the transition towards cleaner energy sources.
Selling down on a ”deal”. Brent crude fell 6.2% last week with accelerated weakness towards the end of the week. Close of the week at $87.33/b and low of the week (and on Friday) of $85.8/b. Brent is falling another 4% this morning to $83.7/b on confirmation by Iran that a MoU text has been reached and that it will be signed on Friday this week.

So what is this ”deal” worth? Talk on the desk here this morning is that it is much like ”putting lipstick on a pig” where Trump has to sell this at home as a victory where ”the SoH has reopened”, the nuclear issue will be ironed out over the coming 60 days (or maybe 600 days?) and US consumers are getting a lower gasoline price and maybe US republicans survives the midterm elections.
The importance for Iran is that it emerges as the defacto winner of this war in the eyes of the non-US public world. That Iran now onwards is the ”ruler of the SoH” (combo of geography and new weapons systems like drones) or more softer: ”the guarantor of safe passage through the SoH”.
Iran doesn’t need nuclear weapons any more. Nuclear deterrence doesn’t work any more. Ukraine has made many attacks deep into Russia without being nuked in return. Plenty of Iranian ballistic rockets blasts over Israel but Iran wasn’t nuked in return.
There is no trust between the US and Iran. We don’t know all the details yet of the MoU. But what we do know is that there is no trust between the US and Iran what so ever. This is probably more like a descriptive text on how they can cooperate in a way where both sides keeps tactical leverage. Neither side makes irreversible concessions. Violations can be punished quickly. Cooperation produces immediate benefits.
This is a fragile structure. It can easily break down. There may be details which cannot be overcome. To be seen on Friday. The US has to show that it is willing put enough force behind managing and restraining Israel versus Hezbollah in Lebanon. We have seen that Netanyahu hasn’t listened all that much to Trump’s directives and wishes. This could be a major obstacle.
A gradual reopening is tactically preferable for Iran. A tactical leverage for Iran right now is that global oil stocks have been drawn down towards painful and increasingly dangerous levels with increasing risks for oil price spikes in mid-July to August. This together with US midterm elections on 3 November gives tactical leverage to Iran. Iran probably doesn’t want to fully give up on that leverage. A rapid, full reopening where global stocks are able to refill over the coming 60 days will significantly erode that leverage. If Iran reinstates a closure of the SoH after 60 days (if talks break down again), then the effect won’t be that impactful in terms of prices and the US midterm elections.
So a gradual and partial reopening where global markets gets the oil they need while they are unable to rebuild stocks could be a practical middle way for both parties. Trump can sell it as ”the SoH has reopened” and get affordable gasoline for US consumers. Iran can sell it as ”the SoH has fully reopened, but there is some friction” so flow is only 60-80% of normal.
Not much real demand destruction below $100/b. What we do know is that there is not much real price pain demand destruction for oil globally at an oil price below $100/b. A lot of demand-shock destruction. Fear. But demand should now come roaring back towards normal with fear for exceptionally high prices now is rapidly receding.
Sudden China demand destruction due to EVs? Bullocks. EV share of total Chinese carpool now around 13%. Share of new sales of EVs has reached 50%. This is a very gradual process. It doesn’t make oil demand fall like a rock over night. When EV new sales share reaches 100%, then the gasoline car pool will contract by some 5-10% per year. But that is only gasoline. Sudden reduction in Chinese oil demand is more about shock and risk.
Chinese crude oil imports will come roaring back. At what price? Today’s ”neutral” oil price is $70/b. That is the five year price which has steadily traded around the $70/b mark over the past 3-4 years. With still a risky picture one would think that China and the rest of the world will be big buyers of oil in the range of $70-85/b.
Global demand will likely snap back towards normal, forecasted demand and growth at such prices.
Physical reopening is a gradual process. The physical and practical reopening of the SoH will likely be gradual rather than sudden. And that probably suites Iran tactically as well.
Brent M1 price versus the Brent 5-yr (today’s ”normal” price)

Market is starting to take US/Iran headlines with a pinch of salt. Brent crude rose $2.8/b yesterday to an official close of $112.1/b. But after that it traded as low as $108.05/b before ending late night at around $109.7/b. Through the day it traded in a range of $106.87 – 112.72/b amid a flurry of news or rumors from Iran and the US. ”US temporary sanctions during negotiations” (falls alarm). ”We will bomb Iran” (not anyhow),… etc. While the market is still fluctuating to this kind of news flow, it is starting to take such headlines with a pinch of salt.
We’ll see. Maybe, maybe not. The Brent M1 contract is trading at $110.2/b this morning which very close to the average ticks through yesterday of $110.4/b.
Trump with bearish, verbal intervention whenever Brent trades above $110/b it seems. What seems to be a pattern is that Trump states something like ”very good negotiations going on with Iran”, ”New leaders in Iran are great,..”, ”Great progress in negotiations,…”, ”Deal in sight,..” etc whenever the Brent M1 contract trades above $110/b. An effort to cool the market. These hot air verbal interventions from Trump used to have a heavy bearish impact on prices, but they now seems to have less and less effect unless they are backed by reality.
As far as we can see there has been no real progress in the negotiations between the US and Iran with both sides still standing by their previous demands.
Iran is getting stronger while the cease fire lasts making a return to war for Trump yet harder. Iran is naturally in constant preparation for a return to war given Trump’s steady threats of bombing Iran again. Iran is naturally doing what ever is possible to prepare for a return to war. And every day the cease fire lasts it is better prepared. This naturally makes it more and more difficult and dangerous for the US to return to warring activity versus Iran as the consequences for energy infrastructure in the Persian Gulf will be more and more severe the longer the cease fire lasts. Israel seems to see it this way as well. That the war is not won and that current frozen state of a cease fire gives Iran opportunity to rebuild military and politically.
Global inventories are drawing down day by day. How much? In the meantime the Strait of Hormuz stays closed. There is varying measures and estimates of how much global inventories are drawing down. Our rough estimate, back of the envelope, is that global inventories are drawing down by at least some 10 mb/d or about 300 mb/d in a balance between loss of supply versus demand destruction. Other estimates we see are a monthly draw of 250-270 mb/d. The IEA only ’measured’ a draw in global observable stocks of 117 mb in April with oil on water rising 53 mb while on shore stocks fell 170 mb. But global stocks are hard to measure with large invisible, unmeasured stocks. As such a back of the envelope approach may be better.
Oil products is what the world is consuming. Oil product prices likely to rise while product stocks fall. Strategic Petroleum Reserves (SPR) are predominantly crude oil. Discharging oil from OECD SPR stocks, a sharp reduction in Chinese crude imports and a reduction in global refinery throughput of 6-7 mb/d has helped to keep crude oil markets satisfactorily supplied. But global inventories are drawing down none the less. And oil products is really what the world is consuming. So if global refinery throughput stays subdued, then demand will eventually have to match the supply of oil products. The likely path forward this summer is a steady draw down in jet fuel, diesel and gasoline. Higher prices for these. Then, if possible, higher refinery throughput and higher usage of crude in response to very profitable refinery margins. And lastly sharper draw in crude stocks and higher prices for these. But some 6 mb/d of oil products used to be exported through the Strait of Hormuz. And it may not be so easy to ramp up refinery activity across the world to compensate. Especially as Ukraine continues to damage Russian refineries as well as Russian crude production and export facilities.
Watch oil product stocks and prices as well as Brent calendar 2027. What to watch for this summer is thus oil product inventories falling and oil product premiums to crude rising. Another measure to watch is the Brent crude 2027 contract as it rises steadily day by day as the Strait of Hormuz stays closed and global oil inventories decline. The latter is close to the highest level since the start of the war and keeps rising.
The Brent M1 contract and the Brent 2027 prices and current price of jet fuel in Europe (ARA). All in USD/b

Our back of the envelope calculation of the global shortage created by the closure of the Strait of Hormuz. Note that 3.5 mb/d of discharge from SPR is also a draw. Note also that ’Forced demand loss’ of 2.5 mb/d is probably temporary and will fall back towards zero as logistics are sorted out leaving ’Price demand loss’ to do the job of balancing the market. Thus a shortfall of at least 9 mb/d created by the closure. More if SPR discharge is included and more if Forced demand loss recedes.

Brent is climbing higher. Front-month is at USD 106.3/bl this morning, close to a weekly high and a USD 9/bl jump from Mondays open. This is the move we flagged as a risk earlier in the week: the market shifting from ”a deal is around the corner” to ”this is going to take longer than we thought”.
Analyst Commodities, SEB
During April, rest-of-year Brent remained remarkably stable around USD 90/bl. A stability which rested on one single assumption: the SoH reopens around 1 May. That assumption is now slowly falling apart.
As we highlighted yesterday: every week of delay beyond 1 May adds (theoretically) ish USD 5/bl to the rest-of-year average, as global inventories draw 100 million barrels per week. i.e., a mid-May reopening implies rest-of-year Brent closer to USD 100/bl, and anything pushing into June or July takes us meaningfully higher.
What’s changed in the last 48 hours:
#1: The US military has formally warned that clearing suspected sea mines from SoH could take up to six months. That is a completely different timescale from what the financial market is pricing. Even a political deal tomorrow does not immediately reopen the strait.
#2: Trump has shifted his tone from urgency to ”strategic patience”. In yesterday’s press conference: ”Don’t rush me… I want a great deal.” The market is reading this as a president no longer feeling pressured by timelines, with the naval blockade running in the background.
#3: So far, the military activity is escalating, not de-escalating. Axios reports Iran is laying more mines in SoH. The US 3rd carrier strike group (USS George H.W. Bush) is arriving with two countermine vessels. Trump yesterday ordered the US Navy to destroy any Iranian boats caught laying mines. While CNN reports that the Pentagon is actively drawing up plans to strike Iranian SoH capabilities and individual Iranian military leaders if the ceasefire collapses. i.e., NOT a attitude consistent with an imminent deal!
Spot crude and product prices eased off the early-April highs on a combination of system rerouting and deal optimism. Both now weakening. Goldman estimates April Gulf output is reduced by 14.5 mbl/d, or 57% of pre-war supply, a number that keeps getting worse the longer this drags on.
Demand-side adaptation is ongoing: S. Korea has cut its Middle East crude dependence from 69% to 56% by pulling more from the Americas and Africa, and Japan is kicking off a second round of SPR releases from 1 May. But SPRs are finite.
Ref. to the negotiations, we should not bet on speed. The current Iranian leadership is dominated by genuine hardliners willing to absorb economic pain and run the clock to extract concessions. That is not a setup for a rapid resolution. US/Israeli media briefings keep framing the delay as ”internal Iranian divisions”, the reality is more complicated and points toward weeks and months, not days.
Our point is that the complexity is large, and higher prices have only just started (given a scenario where the negotiations drag out in time). The market spent April leaning on the USD 90/bl rest-of-year assumption; that case is diminishing by the hour. If ”early May reopening” is replaced by ”June, July or later” over the next week or two, both crude and products have meaningful room to reprice higher from here. There is a high risk being short energy and betting on any immediate political resolution(!).


Vattenfalls och Industrikrafts kärnkraftsbolag Videberg Kraft har valt Rolls-Royce SMR
Selling down on a ”deal”

Sommarväder skapar prisrally på elbörsen
Oil product price pain is set to rise as the Strait of Hormuz stays closed into summer

Solkraften pressar elpriserna dagtid
Oil product price pain is set to rise as the Strait of Hormuz stays closed into summer
Sommarväder skapar prisrally på elbörsen
Vattenfalls och Industrikrafts kärnkraftsbolag Videberg Kraft har valt Rolls-Royce SMR
Selling down on a ”deal”
-
Analys4 veckor sedan
Oil product price pain is set to rise as the Strait of Hormuz stays closed into summer
-
Nyheter2 veckor sedan
Sommarväder skapar prisrally på elbörsen
-
 Nyheter2 dagar sedan
Vattenfalls och Industrikrafts kärnkraftsbolag Videberg Kraft har valt Rolls-Royce SMR
-
Analys2 dagar sedan
Selling down on a ”deal”