

Analys
US crude oil production, only a lower price can slow it down

 Price action – Long positions taking a hit – Pain trade to the down side
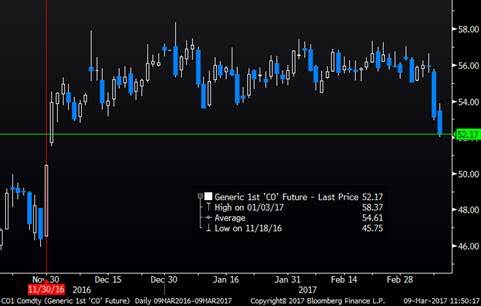
The front month Brent crude contract sold off 5% yesterday with a clos at $53.11/b. This was the lowest close for front month Brent since early December 2016 and clearly a break out of the close, sideways trend around $55/b which has been in place since OPEC decided to cut production in late November. Technically the Brent crude May 17 contract broke the important support level of $54.64/b. The next support level for the contract is $52.86/b and that has already been broken in today’s trading with Brent crude now trading at $52.3/b. Net long speculative positions are close to record high so if the bearish sentiment continues then oil prices are naturally and clearly vulnerable to the downside. That is where the pain-trade is.
It is worth mentioning that in a week on week perspective there has been a broad based sell-off in commodities in general with all sub-indices selling off between 2.6% and 4.4% and the total commodity index down 3.5%. In a week on week perspective Brent sold off 5.8% so a little more than the total energy index which sold off 3.9%. Still, oil was not alone in the sell-off. I.e. It was not just oil specific reasons for why oil sold off over the last week even though the sell-off came yesterday. In the background for all assets is the market concern for higher US interest rates which is hurting bonds, equities as well as commodities. Gold which is definitely sensitive to higher interest rates sold off 3.3% over the past week. The bullish US employment statistics yesterday probably helped to underpin the expectation for higher US rates.
Longer dated crude oil contracts also sold off yesterday with the Brent crude December 2020 contract closing yesterday at $53.74/b which is a new fresh low since April 2016. As stated earlier we expect this contract to trade yet lower down towards the $50/b mark in a pure neccessity to lower the implied shale oil profitability offered US shale oil players on a forward crude oil price curve. More than anything it is the one to three year forward contracts which needs to move lower in order to stemm the current strong rise in shale oil rigs and shale oil investments. Since OPEC decided to cut production in late November 2017 US shale oil players have been offered a nice profitable lunch on in the forward market basis.
Crude oil comment – US crude oil production, only a lower price can slow it down
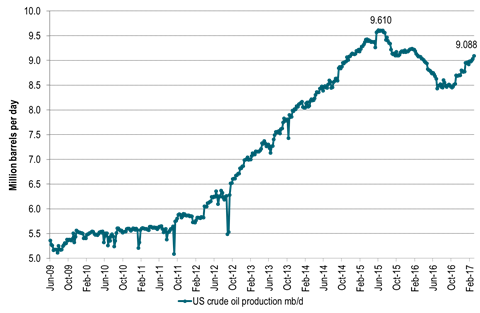
The consequence of the increase in US oil rigs since the mid-May last year has now become alarmingly visible in US crude oil production. US crude oil production is growing. And it is growing strongly. That was one of the key bearish statistics in the US EIA’s data release yesterday. US crude oil production rose by 56 kb/d w/w to 9.088 mb/d. Sounds like little in the big picture but multiply by 52 weeks (if it is a steady trend rather than weekly noise) and you get a marginal, annualized US crude oil production growth rate of 2.9 mb/d. Since the start of 2017 the average US crude oil production growth has been +35 kb/d w/w. That equates to a marginal, annualized growth rate of 1.8 mb/d. We are in general very bullish US shale oil production growth. However, we had not expecte to see this level of growth rate before in September 2017.
There is only one way to slow down the US crude oil production growth and that is a lower oil price. Thus beside an overall bearish sell-off in commodities in general, the oil price is pushing lower. A marginal, annualized US crude oil production growth rate of 1.8 mb/d which we now have seen since the start of the year is too much, too early. The shale oil veteran Harrold Hamm this week said at the Cera Week in Houston that the current investment binge in US shale oil production will kill the oil market unless it is tempered. Pioneer’s Scott Sheffield was out earlier in the week stating that US Permian crude oil production could rise to 8-10 mb/d in 10 years time and thus surpas Saudi Arabia’s Ghawar field (biggest in the world today). He also said that the WTI crude oil price would fall to $40/b if OPEC doesn’t carry over its production cuts into H2-17. On top of this the US EIA revised its US crude oil production projections significantly higher yet again. We still think they are way behind the curve when they predict US crude oil production at 9.73 mb/d on average in 2018 versus our projection of 10.76 mb/d for that year. We thus think that the US EIA will revise higher its projections for US crude oil 2018 production projection again and again in 2017.
If US crude oil production continues to grow at the pace we have seen since the start of the year, then it will pass its past peak of 9.61 mb/d (which was reached in June 2015) by mid-June 2017. That is not our projection, just a pure mathematical extrapolation.
Shale oil service costs, labour costs and material costs are tellingly definitely on the rise. This could definitely slow down weekly rig count additions if the cost side starts to bit significantly. In that case the oil price would not need to move all that much lower in order to slow down rig count additions. However, we have not seen that effect yet. Normally there is a time lag of 6-8 weeks from the oil price moves to when we see a reduction or increase in the weekly US shale oil rig count numbers. As such even if the oil price now continues yet lower we are likely to see that the US shale oil rig count increases by 9-10 rigs every week the next 6-8 weeks.
We still think that oil inventories will fall in Q2-17 and as such give support to prices. Our expectations is to see the highest Brent crude oil price to be printed in Q2-17. However, US crude oil prodution is now growing so strongly that market focus is shifting away from OPEC cuts and over to US production growth. We had not expected this to happen before in late Q2-17.
Then we are left with the question – What will OPEC do in the face of strongly rising US crude oil production? The can decide to cut also in H2-17, but does it make sense? We think not. US shale oil production response is too fast and too flexible.
Ch1: Brent crude front month contract – Breaking the sideways trend. Back to pre-OPEC-cut-decission?
Ch2: US crude oil production rising strongly – too strongly. Now just 0.5 mb/d below prior peak
If it continues at this pace then US crude production will pass the 9.6 mb/d mark in June 2017
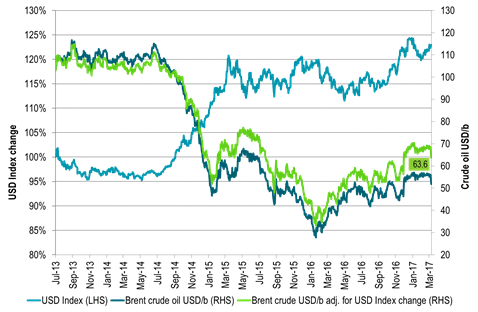
Ch3: Brent crude oil 1mth contract adjusted for US dollar strength since July 2013.
For all those longing for a Brent crude oil price of $60/b it is worth remembering that
if we adjust for the 23% stronger USD since July 2013 a Brent price today of only $51/b actually equals $63.6/b in 2013 USD terms.
In that perspective we are already “back above $60/b”. Acutally we were close to $70/b in 2013 dollar terms when Brent averaged $55/b so far this year.
Kind regards
Bjarne Schieldrop
Chief analyst, Commodities
SEB Markets
Merchant Banking
When it starts to move lower it moves rather quickly. Gaza, China, IEA. Brent crude is down 2.1% today to $62/b after having traded as high as $66.58/b last Thursday and above $70/b in late September. The sell-off follows the truce/peace in Gaze, a flareup in US-China trade and yet another bearish oil outlook from the IEA.

A lasting peace in Gaze could drive crude oil at sea to onshore stocks. A lasting peace in Gaza would probably calm down the Houthis and thus allow more normal shipments of crude oil to sail through the Suez Canal, the Red Sea and out through the Bab-el-Mandeb Strait. Crude oil at sea has risen from 48 mb in April to now 91 mb versus a pre-Covid normal of about 50-60 mb. The rise to 91 mb is probably the result of crude sailing around Africa to be shot to pieces by the Houthis. If sailings were to normalize through the Suez Canal, then it could free up some 40 mb in transit at sea moving onshore into stocks.
The US-China trade conflict is of course bearish for demand if it continues.
Bearish IEA yet again. Getting closer to 2026. Credibility rises. We expect OPEC to cut end of 2025. The bearish monthly report from the IEA is what it is, but the closer we get to 2026, the more likely the IEA is of being ball-park right in its outlook. In its monthly report today the IEA estimates that the need for crude oil from OPEC in 2026 will be 25.4 mb/d versus production by the group in September of 29.1 mb/d. The group thus needs to do some serious cutting at the end of 2025 if it wants to keep the market balanced and avoid inventories from skyrocketing. Given that IEA is correct that is. We do however expect OPEC to implement cuts to avoid a large increase in inventories in Q1-26. The group will probably revert to cuts either at its early December meeting when they discuss production for January or in early January when they discuss production for February. The oil price will likely head yet lower until the group reverts to cuts.
Dubai: The Mid-East anchor dragging crude oil lower. Surplus emerging in Mid-East pricing. Crude oil prices held surprisingly strong all through the summer. A sign and a key source of that strength came from the strength in the front-end backwardation of the Dubai crude oil curve. It held out strong from mid-June and all until late September with an average 1-3mth time-spread premium of $1.8/b from mid-June to end of September. The 1-3mth time-spreads for Brent and WTI however were in steady deterioration from late June while their flat prices probably were held up by the strength coming from the Persian Gulf. Then in late September the strength in the Dubai curve suddenly collapsed. Since the start of October it has been weaker than both the Brent and the WTI curves. The Dubai 1-3mth time-spread now only stands at $0.25/b. The Middle East is now exporting more as it is producing more and also consuming less following elevated summer crude burn for power (Aircon) etc.
The only bear-element missing is a sudden and solid rise in OECD stocks. The only thing that is missing for the bear-case everyone have been waiting for is a solid, visible rise in OECD stocks in general and US oil stocks specifically. So watch out for US API indications tomorrow and official US oil inventories on Thursday.
No sign of any kind of fire-sale of oil from Saudi Arabia yet. To what we can see, Saudi Arabia is not at all struggling to sell its oil. It only lowered its Official Selling Prices (OSPs) to Asia marginally for November. A surplus market + Saudi determination to sell its oil to the market would normally lead to a sharp lowering of Saudi OSPs to Asia. Not yet at least and not for November.
The 5yr contract close to fixed at $68/b. Of importance with respect to how far down oil can/will go. When the oil market moves into a surplus then the spot price starts to trade in a large discount to the 5yr contract. Typically $10-15/b below the 5yr contract on average in bear-years (2009, 2015, 2016, 2020). But the 5yr contract is usually pulled lower as well thus making this approach a moving target. But the 5yr contract price has now been rock solidly been pegged to $68/b since 2022. And in the 2022 bull-year (Brent spot average $99/b), the 5yr contract only went to $72/b on average. If we assume that the same goes for the downside and that 2026 is a bear-year then the 5yr goes to $64/b while the spot is trading at a $10-15/b discount to that. That would imply an average spot price next year of $49-54/b. But that is if OPEC doesn’t revert to cuts and instead keeps production flowing. We think OPEC(+) will trim/cut production as needed into 2026 to prevent a huge build-up in global oil stocks and a crash in prices. But for now we are still heading lower. Into the $50ies/b.
Some rebound but not much. Brent crude rebounded 1.5% yesterday to $65.47/b. This morning it is inching 0.2% up to $65.6/b. The lowest close last week was on Thursday at $64.11/b.
The curve structure is almost as week as it was before the weekend. The rebound we now have gotten post the message from OPEC+ over the weekend is to a large degree a rebound along the curve rather than much strengthening at the front-end of the curve. That part of the curve structure is almost as weak as it was last Thursday.
We are still on a weakening path. The message from OPEC+ over the weekend was we are still on a weakening path with rising supply from the group. It is just not as rapidly weakening as was feared ahead of the weekend when a quota hike of 500 kb/d/mth for November was discussed.
The Brent curve is on its way to full contango with Brent dipping into the $50ies/b. Thus the ongoing weakening we have had in the crude curve since the start of the year, and especially since early June, will continue until the Brent crude oil forward curve is in full contango along with visibly rising US and OECD oil inventories. The front-month Brent contract will then flip down towards the $60/b-line and below into the $50ies/b.
At what point will OPEC+ turn to cuts? The big question then becomes: When will OPEC+ turn around to make some cuts? At what (price) point will they choose to stabilize the market? Because for sure they will. Higher oil inventories, some more shedding of drilling rigs in US shale and Brent into the 50ies somewhere is probably where the group will step in.
There is nothing we have seen from the group so far which indicates that they will close their eyes, let the world drown in oil and the oil price crash to $40/b or below.
The message from OPEC+ is also about balance and stability. The world won’t drown in oil in 2026. The message from the group as far as we manage to interpret it is twofold: 1) Taking back market share which requires a lower price for non-OPEC+ to back off a bit, and 2) Oil market stability and balance. It is not just about 1. Thus fretting about how we are all going to drown in oil in 2026 is totally off the mark by just focusing on point 1.
When to buy cal 2026? Before Christmas when Brent hits $55/b and before OPEC+ holds its last meeting of the year which is likely to be in early December.
Brent crude oil prices have rebounded a bit along the forward curve. Not much strengthening in the structure of the curve. The front-end backwardation is not much stronger today than on its weakest level so far this year which was on Thursday last week.

The front-end backwardation fell to its weakest level so far this year on Thursday last week. A slight pickup yesterday and today, but still very close to the weakest year to date. More oil from OPEC+ in the coming months and softer demand and rising inventories. We are heading for yet softer levels.

Down to the lowest since early May. Brent crude has fallen sharply the latest four days. It closed at USD 64.11/b yesterday which is the lowest since early May. It is staging a 1.3% rebound this morning along with gains in both equities and industrial metals with an added touch of support from a softer USD on top.
What stands out the most to us this week is the collapse in the Dubai one to three months time-spread.
Dubai is medium sour crude. OPEC+ is in general medium sour crude production. Asian refineries are predominantly designed to process medium sour crude. So Dubai is the real measure of the balance between OPEC+ holding back or not versus Asian oil demand for consumption and stock building.
A sharp weakening of the front-end of the Dubai curve. The front-end of the Dubai crude curve has been holding out very solidly throughout this summer while the front-end of the Brent and WTI curves have been steadily softening. But the strength in the Dubai curve in our view was carrying the crude oil market in general. A source of strength in the crude oil market. The core of the strength.
The now finally sharp decline of the front-end of the Dubai crude curve is thus a strong shift. Weakness in the Dubai crude marker is weakness in the core of the oil market. The core which has helped to hold the oil market elevated.
Facts supports the weakening. Add in facts of Iraq lifting production from Kurdistan through Turkey. Saudi Arabia lifting production to 10 mb/d in September (normal production level) and lifting exports as well as domestic demand for oil for power for air con is fading along with summer heat. Add also in counter seasonal rise in US crude and product stocks last week. US oil stocks usually decline by 1.3 mb/week this time of year. Last week they instead rose 6.4 mb/week (+7.2 mb if including SPR). Total US commercial oil stocks are now only 2.1 mb below the 2015-19 seasonal average. US oil stocks normally decline from now to Christmas. If they instead continue to rise, then it will be strongly counter seasonal rise and will create a very strong bearish pressure on oil prices.
Will OPEC+ lift its voluntary quotas by zero, 137 kb/d, 500 kb/d or 1.5 mb/d? On Sunday of course OPEC+ will decide on how much to unwind of the remaining 1.5 mb/d of voluntary quotas for November. Will it be 137 kb/d yet again as for October? Will it be 500 kb/d as was talked about earlier this week? Or will it be a full unwind in one go of 1.5 mb/d? We think most likely now it will be at least 500 kb/d and possibly a full unwind. We discussed this in a not earlier this week: ”500 kb/d of voluntary quotas in October. But a full unwind of 1.5 mb/d”
The strength in the front-end of the Dubai curve held out through summer while Brent and WTI curve structures weakened steadily. That core strength helped to keep flat crude oil prices elevated close to the 70-line. Now also the Dubai curve has given in.

Brent crude oil forward curves

Total US commercial stocks now close to normal. Counter seasonal rise last week. Rest of year?

Total US crude and product stocks on a steady trend higher.


Guld och silver stiger hela tiden mot nya höjder
The Mid-East anchor dragging crude oil lower

Samtal om sällsynta jordartsmetaller, guld och silver

Brookfield köper bränsleceller för 5 miljarder USD av Bloom Energy för att driva AI-datacenter

Teck Resources kan förse Nordamerika och kanske hela G7 med all germanium som behövs

OPEC+ missar produktionsmål, stöder oljepriserna

Ett samtal om guld, olja, fjärrvärme och förnybar energi

Guld nära 4000 USD och silver 50 USD, därför kan de fortsätta stiga
Are Ukraine’s attacks on Russian energy infrastructure working?

Goldman Sachs höjer prognosen för guld, tror priset når 4900 USD
-
 Nyheter3 veckor sedan
OPEC+ missar produktionsmål, stöder oljepriserna
-
 Nyheter3 veckor sedan
Ett samtal om guld, olja, fjärrvärme och förnybar energi
-
 Nyheter2 veckor sedan
Guld nära 4000 USD och silver 50 USD, därför kan de fortsätta stiga
-
Analys3 veckor sedan
Are Ukraine’s attacks on Russian energy infrastructure working?
-
 Nyheter1 vecka sedan
Goldman Sachs höjer prognosen för guld, tror priset når 4900 USD
-

 Nyheter2 veckor sedan
Blykalla och amerikanska Oklo inleder ett samarbete
-

 Nyheter3 veckor sedan
Guldpriset uppe på nya höjder, nu 3750 USD
-
Nyheter2 veckor sedan
Ett samtal om guld, olja, koppar och stål