

Analys
US crude oil 2018 production forecast by EIA still too low

 Price action – Higher on Nigeria strike, Fortis pipeline outage, lower oil rig count, softer USD and positive equities
Brent crude is gaining 0.9% this morning as it climbs to $63.8/b along with a 0.2% softer USD index and positive equity gains. A part of the positive oil price drive today is the Nigerian oil union declaring a strike as they protest against unfair labour practices thus posing a risk to Nigeria’s production of 1.7 mb/d. The Fortis pipeline carrying xxx kb/d is still off-line with the operator declares force majeure as it expects repairs of the hairline will take some 2-4 weeks. The key concern is that there might be a wider problem stretching along the whole pipeline. If the reason for the current crack is the higher sulphur content in the Buzzard crude flowing in the Fortis crude stream and sulphide corrosion as a consequence of this then the outage of the pipe could be much, much longer. The pipe carries some 450 kb/d and thus a major share of the physical supply into the Brent spot market. A decline of 2 US oil rigs last week adds some support on the margin.
Crude oil comment – US crude oil 2018 production forecast by EIA still too low
Later today we’ll have the monthly update from the US EIA on shale oil drilling productivity in the US. We expect the EIA to revise its productivity as well as its production higher. Their last productivity report had data points to Dec 2017. We expect the EIA to show that the strong production growth of on average 91 kb/d/mth from July to December this year stays intact at around 90 kb/d/mth also in January and also that well completions continued to rise also in November as they have done every month since January this year.
We do not think that the EIA update later today will necessarily hit the Brent crude oil price bearishly. More likely we expect the Brent to WTI price spread to widen further on the back of such news.
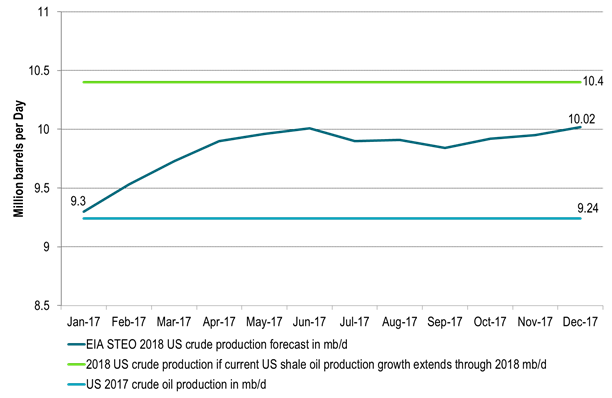
The US EIA last Tuesday adjusted its 2018 forecast for US crude oil production upwards from 9.95 mb/d to an average of 10.02 mb/d thus growing 0.78 mb/d y/y to 2018. The increase in forecast of 70 kb/d was the third upwards revision in three months. We still think that the US EIA is significantly behind the curve in terms of its projections for US crude oil production for 2018. As such we expect the US EIA to continue to revise its projection for 2018 higher in the months to come until it reaches at least an average crude oil production of around 10.4 mb/d for 2018.
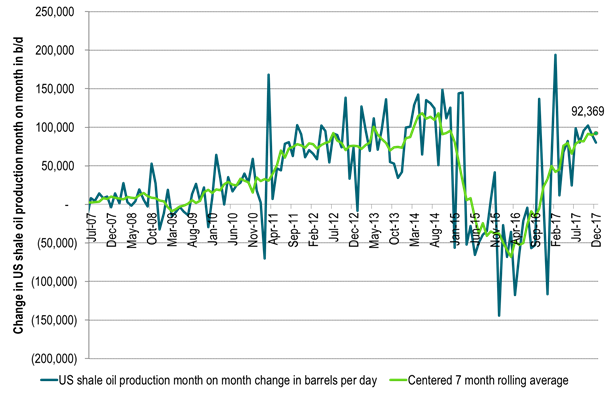
US shale oil production growth is currently running at some 90 kb/d/mth. That is the exit shale oil growth rate for 2017 while the average growth rate from July to December has been 91 kb/d/mth. The implied marginal, annualized production growth rate is thus currently running at 1.1 mb/d/yr. The US EIA is however assuming that US shale oil production will only grow by some 37 kb/d/mth in 2018. That is 40% lower than the current growth rate in shale oil production. From Dec-17 to Dec-18 the EIA projects that US lower 48 (ex GoM) will grow by only 440 kb/d. If we instead apply the current 90 kb/d/mth growth rate through 2018 then L48 ex GoM would grow by 1.1 mb/d from Dec-17 to Dec-18.
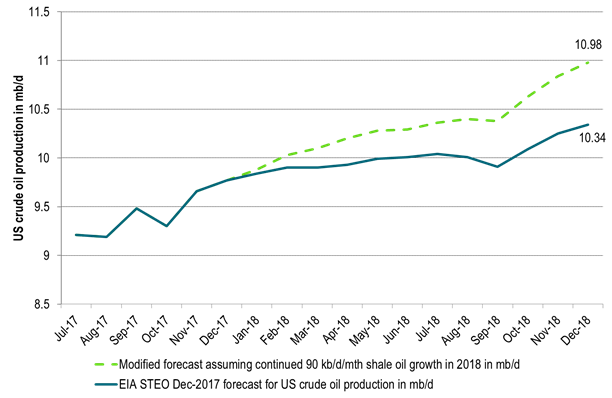
If we extrapolate the current shale oil production growth rate through 2018 it would lead US crude oil production to exit 2018 at 11 mb/d versus EIA’s forecast of 10.34 mb/d. If we include NGLs, Bio-fuels and refinery gains it would lift total US liquids production to close to 18 mb/d in December 2018 and drive total US liquids production growth to 1.7 mb/d y/y Dec-17 to Dec-18.
US shale oil well completions is still rising (+35 wells m/m in October), the drilled but uncompleted numbers of wells is still rising and oil prices have been on a constant trend upwards since mid-June . So if anything the current trend is for stronger US shale oil production growth month/month in the months ahead and not at all the sudden drop-off in shale oil production growth which the EIA predicts for 1Q18 where they expect a monthly average growth rate of only 23 kb/d/mth.
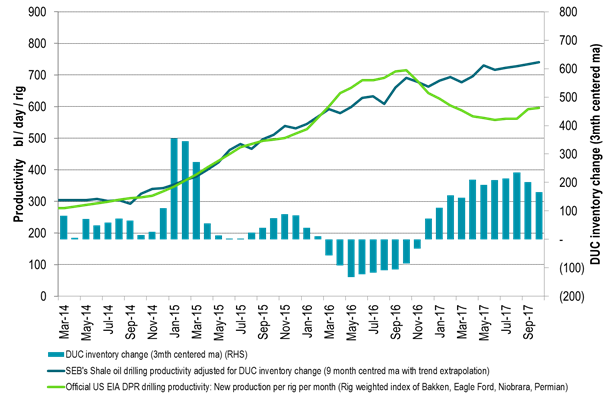
We think that one of the key reasons for why the US EIA has a too low production growth target for 2018 is due to the build-up in the DUC (Drilled but uncompleted wells) inventory which gives an impression of declining shale oil volume productivity. This decline in volume productivity is in our view not real. In our calculations we see US shale oil volume drilling productivity has continued to tick higher even though now mostly sideways. But at least we do not see productivity in decline as the official headline numbers indicate.
There is a lot of focus on a shift in investor focus from rewarding production growth and now instead demanding profits. This could possibly change shale oil producer behaviour and as such lead to softer US shale oil production growth than indicated above.
In our view such a shift should primarily hit drilling rather than completions as the shale oil companies have a huge stack of uncompleted wells which they can convert to oil and money in 2018. They can ease back on the drilling and continue to ramp up completions. Completions have been trailing drilling for a full year now. If shale oil companies pull back on investments then this should switch around in 2018 to a situation where drilling is lower than completions while spending on completions continues at a high level and drilling at a lower. Completions in 2018 could run some 20% above the Jan to Oct average completion level of 2017.
In terms of capex spending we had news last week that Keane Group, one of the largest pure-play providers of US shale completion services yesterday announced that they will order three new frac fleets on top of their existing 26. The order is a response to robust 2018 US shale oil investments announced latest weeks. Completions are the thing for 2018 which means more shale oil production.
Ch1: US shale oil production growth is exiting 2017 at a rate of about 90 kb/d/mth (1.1 mb/d on a marginal annualized rate)
It is now growing as strongly as it did through 2012 and 2013
Ch2: If US shale oil production grows in 2018 as it exits 2017 (~90 kb/d/mth) then total US crude production will grow by 1.1 mb/d y/y to 10.4 mb/d y/y
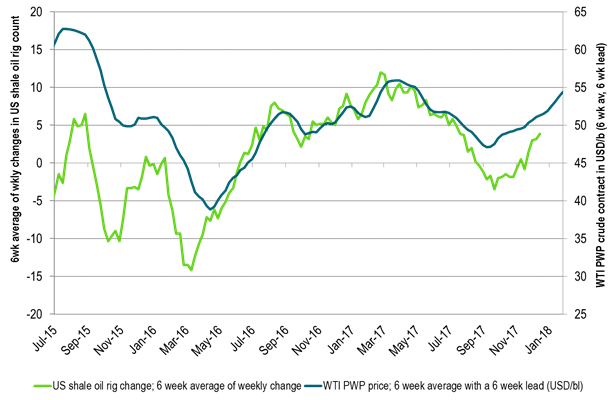
Ch3: The Production Weighting Price (PWP) of a new shale oil well with a 6 week lead has moved higher since Sep
If history is anything to go by then US shale oil action will increase in response. Drilling and or completions
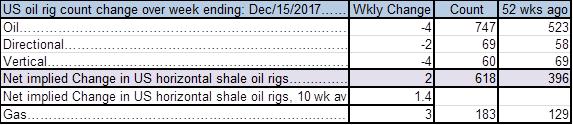
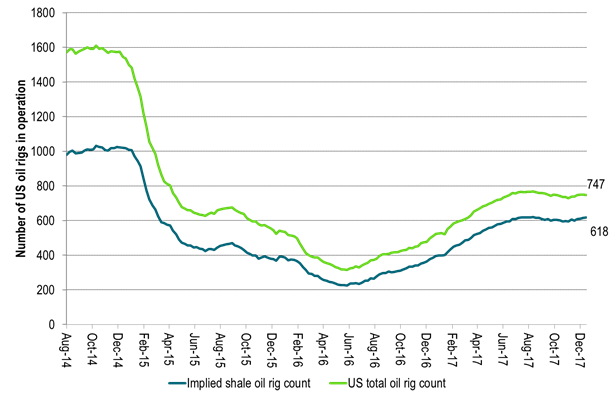
Ch4: US oil rig count moved down 4 last week but implied shale oil rigs increased by 2
US oil rig count is up by 22 over the last 5 weeks which is 17 rigs shy of the level in August
Ch5: The mirage of declining shale oil productivity created from the large build-up in DUCs (uncompleted wells)
The official US shale oil productivity was running higher than our estimate during the DUC draw down in 2016.
It is running way below our productivity estimate in 2017 during a huge build up in the DUC inventory during 2017.
As the DUC inventory eventually draws down the official productivity will again be running above our estimate
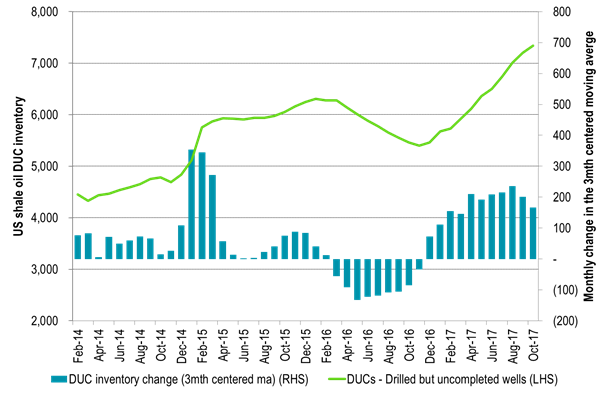
Ch6: A lot of uncompleted wells to complete in 2018!!
The DUC inventory was still BUILDING in October (the last data point)
So drilling new wells can decline a lot in 2018 while completions can increase some 20% y/y
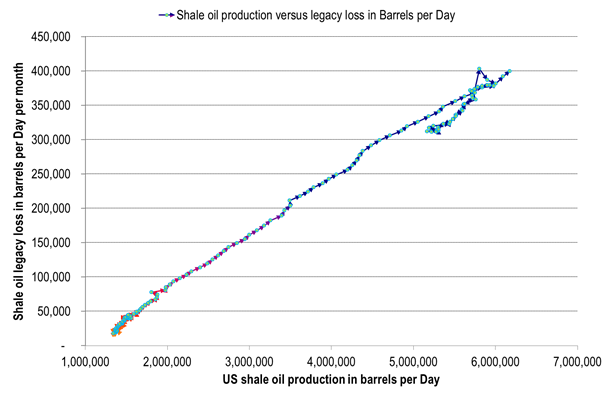
Ch7: No top-down sign that US shale oil resources are deteriorating as losses in existing production stays on scale to production level
No top-down sign as of yet of run-away losses in existing production versus production level
Ch8: US EIA crude oil production forecast likely to be lifted further up towards 10.4 mb/d
EIA lifting it forecast 3 mths in a row
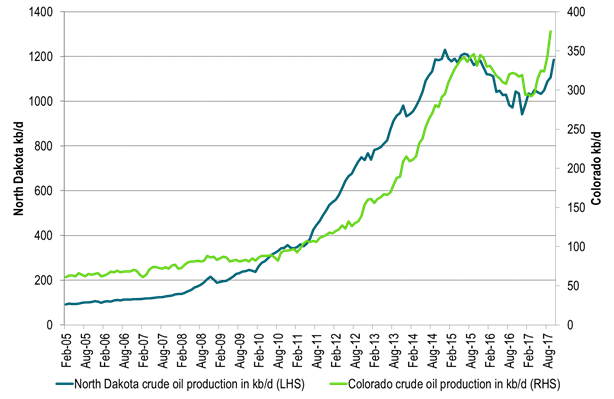
Ch9: Volume wise there are good shale oil days in both Colorado and Bakken North Dakota these days
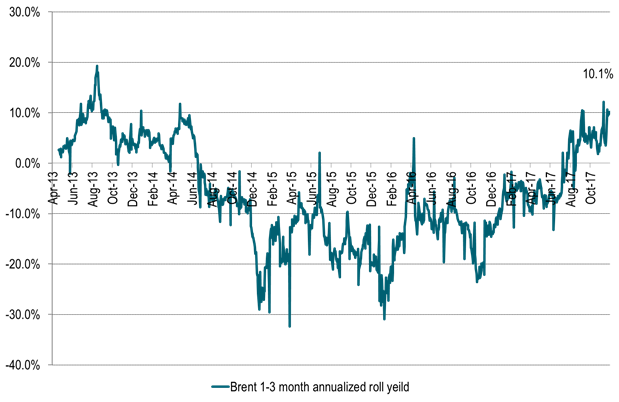
Ch10: Annualized 1-3 mth Brent backwardation fully funded roll-yield of 10% pa
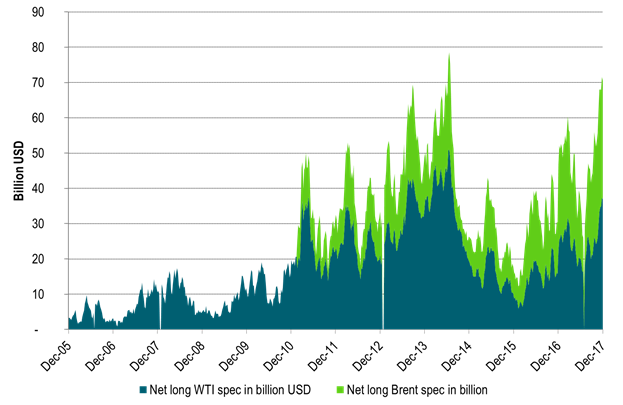
Ch11: The positive roll-yield in Brent continues to suck in more long spec into both Brent and WTI front end crude’
Kind regards
Bjarne Schieldrop
Chief analyst, Commodities
SEB Markets
Merchant Banking
Brent crude has climbed roughly USD 1.5-2 per barrel since Friday, yet falling USD 0.3 per barrel this mornig and currently trading near USD 67.25/bbl after yesterday’s climb. While the rally reflects short-term geopolitical tension, price action has been choppy, and crude remains locked in a broader range – caught between supply-side pressure and spot resilience.

Prices have been supported by renewed Ukrainian drone strikes targeting Russian infrastructure. Over the weekend, falling debris triggered a fire at the 20mtpa Kirishi refinery, following last week’s attack on the key Primorsk terminal.
Argus estimates that these attacks have halted ish 300 kbl/d of Russian refining capacity in August and September. While the market impact is limited for now, the action signals Kyiv’s growing willingness to disrupt oil flows – supporting a soft geopolitical floor under prices.
The political environment is shifting: the EU is reportedly considering sanctions on Indian and Chinese firms facilitating Russian crude flows, while the U.S. has so far held back – despite Bessent warning that any action from Washington depends on broader European participation. Senator Graham has also publicly criticized NATO members like Slovakia and Hungary for continuing Russian oil imports.
It’s worth noting that China and India remain the two largest buyers of Russian barrels since the invasion of Ukraine. While New Delhi has been hit with 50% secondary tariffs, Beijing has been spared so far.
Still, the broader supply/demand balance leans bearish. Futures markets reflect this: Brent’s prompt spread (gauge of near-term tightness) has narrowed to the current USD 0.42/bl, down from USD 0.96/bl two months ago, pointing to weakening backwardation.
This aligns with expectations for a record surplus in 2026, largely driven by the faster-than-anticipated return of OPEC+ barrels to market. OPEC+ is gathering in Vienna this week to begin revising member production capacity estimates – setting the stage for new output baselines from 2027. The group aims to agree on how to define “maximum sustainable capacity,” with a proposal expected by year-end.
While the IEA pegs OPEC+ capacity at 47.9 million barrels per day, actual output in August was only 42.4 million barrels per day. Disagreements over data and quota fairness (especially from Iraq and Nigeria) have already delayed this process. Angola even quit the group last year after being assigned a lower target than expected. It also remains unclear whether Russia and Iraq can regain earlier output levels due to infrastructure constraints.
Also, macro remains another key driver this week. A 25bp Fed rate cut is widely expected tomorrow (Wednesday), and commodities in general could benefit a potential cut.
Summing up: Brent crude continues to drift sideways, finding near-term support from geopolitics and refining strength. But with surplus building and market structure softening, the upside may remain capped.
Brent crude is essentially flat on the week, but after a volatile ride. Prices started Monday near USD 65.5/bl, climbed steadily to a mid-week high of USD 67.8/bl on Wednesday evening, before falling sharply – losing about USD 2/bl during Thursday’s session.
Brent is currently trading around USD 65.8/bl, right back where it began. The volatility reflects the market’s ongoing struggle to balance growing surplus risks against persistent geopolitical uncertainty and resilient refined product margins. Thursday’s slide snapped a three-day rally and came largely in response to a string of bearish signals, most notably from the IEA’s updated short-term outlook.
The IEA now projects record global oversupply in 2026, reinforcing concerns flagged earlier by the U.S. EIA, which already sees inventories building this quarter. The forecast comes just days after OPEC+ confirmed it will continue returning idle barrels to the market in October – albeit at a slower pace of +137,000 bl/d. While modest, the move underscores a steady push to reclaim market share and adds to supply-side pressure into year-end.
Thursday’s price drop also followed geopolitical incidences: Israeli airstrikes reportedly targeted Hamas leadership in Doha, while Russian drones crossed into Polish airspace – events that initially sent crude higher as traders covered short positions.
Yet, sentiment remains broadly cautious. Strong refining margins and low inventories at key pricing hubs like Europe continue to support the downside. Chinese stockpiling of discounted Russian barrels and tightness in refined product markets – especially diesel – are also lending support.
On the demand side, the IEA revised up its 2025 global demand growth forecast by 60,000 bl/d to 740,000 bl/d YoY, while leaving 2026 unchanged at 698,000 bl/d. Interestingly, the agency also signaled that its next long-term report could show global oil demand rising through 2050.
Meanwhile, OPEC offered a contrasting view in its latest Monthly Oil Market Report, maintaining expectations for a supply deficit both this year and next, even as its members raise output. The group kept its demand growth estimates for 2025 and 2026 unchanged at 1.29 million bl/d and 1.38 million bl/d, respectively.
We continue to watch whether the bearish supply outlook will outweigh geopolitical risk, and if Brent can continue to find support above USD 65/bl – a level increasingly seen as a soft floor for OPEC+ policy.
Brent crude makes some gains as Israel’s attack on Hamas in Qatar rattles markets. Brent crude spiked to a high of USD 67.38/b yesterday as Israel made a strike on Hamas in Qatar. But it wasn’t able to hold on to that level and only closed up 0.6% in the end at USD 66.39/b. This morning it is starting on the up with a gain of 0.9% at USD 67/b. Still rattled by Israel’s attack on Hamas in Qatar yesterday. Brent is getting some help on the margin this morning with Asian equities higher and copper gaining half a percent. But the dark cloud of surplus ahead is nonetheless hanging over the market with Brent trading two dollar lower than last Tuesday.

Geopolitical risk premiums in oil rarely lasts long unless actual supply disruption kicks in. While Israel’s attack on Hamas in Qatar is shocking, the geopolitical risk lifting crude oil yesterday and this morning is unlikely to last very long as such geopolitical risk premiums usually do not last long unless real disruption kicks in.
US API data yesterday indicated a US crude and product stock build last week of 3.1 mb. The US API last evening released partial US oil inventory data indicating that US crude stocks rose 1.3 mb and middle distillates rose 1.5 mb while gasoline rose 0.3 mb. In total a bit more than 3 mb increase. US crude and product stocks usually rise around 1 mb per week this time of year. So US commercial crude and product stock rose 2 mb over the past week adjusted for the seasonal norm. Official and complete data are due today at 16:30.
A 2 mb/week seasonally adj. US stock build implies a 1 – 1.4 mb/d global surplus if it is persistent. Assume that if the global oil market is running a surplus then some 20% to 30% of that surplus ends up in US commercial inventories. A 2 mb seasonally adjusted inventory build equals 286 kb/d. Divide by 0.2 to 0.3 and we get an implied global surplus of 950 kb/d to 1430 kb/d. A 2 mb/week seasonally adjusted build in US oil inventories is close to noise unless it is a persistent pattern every week.
US IEA STEO oil report: Robust surplus ahead and Brent averaging USD 51/b in 2026. The US EIA yesterday released its monthly STEO oil report. It projected a large and persistent surplus ahead. It estimates a global surplus of 2.2 m/d from September to December this year. A 2.4 mb/d surplus in Q1-26 and an average surplus for 2026 of 1.6 mb/d resulting in an average Brent crude oil price of USD 51/b next year. And that includes an assumption where OPEC crude oil production only averages 27.8 mb/d in 2026 versus 27.0 mb/d in 2024 and 28.6 mb/d in August.
Brent will feel the bear-pressure once US/OECD stocks starts visible build. In the meanwhile the oil market sits waiting for this projected surplus to materialize in US and OECD inventories. Once they visibly starts to build on a consistent basis, then Brent crude will likely quickly lose altitude. And unless some unforeseen supply disruption kicks in, it is bound to happen.
US IEA STEO September report. In total not much different than it was in January

US IEA STEO September report. US crude oil production contracting in 2026, but NGLs still growing. Close to zero net liquids growth in total.


Tyskland har så höga elpriser att företag inte har råd att använda elektricitet
Brent crude ticks higher on tension, but market structure stays soft

Kinas elproduktion slog nytt rekord i augusti, vilket även kolkraft gjorde

Det stigande guldpriset en utmaning för smyckesköpare

Aktier i guldbolag laggar priset på guld

Meta bygger ett AI-datacenter på 5 GW och 2,25 GW gaskraftverk
Aker BP gör ett av Norges största oljefynd på ett decennium, stärker resurserna i Yggdrasilområdet
Brent sideways on sanctions and peace talks

Ett samtal om koppar, kaffe och spannmål
Sommarens torka kan ge högre elpriser i höst
-
 Nyheter4 veckor sedan
Meta bygger ett AI-datacenter på 5 GW och 2,25 GW gaskraftverk
-
 Nyheter4 veckor sedan
Aker BP gör ett av Norges största oljefynd på ett decennium, stärker resurserna i Yggdrasilområdet
-
Analys4 veckor sedan
Brent sideways on sanctions and peace talks
-
 Nyheter4 veckor sedan
Ett samtal om koppar, kaffe och spannmål
-
 Nyheter4 veckor sedan
Sommarens torka kan ge högre elpriser i höst
-
Analys4 veckor sedan
Brent edges higher as India–Russia oil trade draws U.S. ire and Powell takes the stage at Jackson Hole
-

 Nyheter3 veckor sedan
Mahvie Minerals är verksamt i guldrikt område i Finland
-
Analys3 veckor sedan
Increasing risk that OPEC+ will unwind the last 1.65 mb/d of cuts when they meet on 7 September