

Analys
The value of an EUA spot contract is at least EUR 80/ton

A fight between short-term C-t-G differentials at EUR 40-60/ton and longer term values of EUR 100/ton already in 2026. The value of an EUA today is thus at least EUR 80/ton.

Low emissions, falling nat gas and C-t-G differentials and EUA prices falling along with that is all the range in current market dynamics. But it won’t last as the MSR will quickly remove surpluses and the steep decline in supply of EUAs from 2026 onward will quickly drive the EUA price back up and above C-t-G differentials. The EUA price will then stop relating to power market dynamics as C-t-G switching is maxed out.
The EUA market is currently driven by front-end and front-year Coal-to-Gas dynamics and differentials with the EUA price in the balance between the two. At the very front-end (1-2-3 mths) the C-t-G differentials implies an EUA price close to EUR 40/ton while the front-year 2025 has a C-t-G differential of a little over EUR 60/ton. Thus the front-year is probably a better and stronger guide right now.
But C-t-G differentials holds wide ranges of values and are very sensitive to changes in coal and nat gas prices. So the simple rule of trading approach is probably: ”Sell EUAs if the nat gas price falls”.
The total capacity to switch between coal and gas and thus flex the total amount of emissions is quite limited with a capacity of maybe only 100 mt reduction potential. Thus as the number of allowances declines in the coming years the C-t-G differentials will stop to matter as the switch will max out. Implied by modeling (Blbrg) and also by market pricing of calendar 2026 and 2027 this looks set to happen over the coming 2-3 years. The consequence will be EUA prices which will be above C-t-G differential values and disjoint from power market dynamics.
The EU ETS market probably experienced an emission reduction shock in 2023 where total German emissions are estimated to have fallen by 73 mt YoY to 2023 or some 10%. If we assume that this also is true for the whole EU ETS sector and run Bloomberg’s Carbon Price Model we see that the consequence of this emission reduction shock is washed out by 2026 with the EUA price then back at EUR 100/ton and above. The reason for this is probably due to the Market Stability Reserve dynamics which quickly removes any surplus EUAs in the market and brings the TNAC quickly down below the 833 mt upper trigger level again.
The model runs tells us that no matter what happens to gas prices and EUA prices and emissions in 2023/24, it will all wash out withing three years with the EUA price back at EUR 100/ton in 2026. If we assume a cost of carry of 7% it implies that the value of an EUA today is minimum EUR 80/ton due to bankability (buy today and hold to 2026 and then sell).
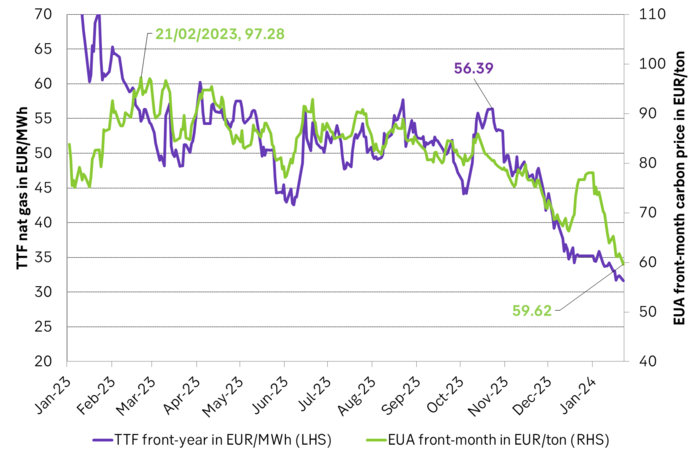
The sell-off in natural gas prices has been the guiding light for the sell-off in EUAs. Accelerated decline in natural gas prices seems to be the guiding light for the EUA price. The decline in the front-year TTF nat gas price accelerated from late October 2023 and continues to trade lower and lower. The front-year 2025 yesterday closed at EUR 32/MWh (-1.1% on the day) while the year 2027 traded down 0.9% to EUR 27.1/MWh. In comparison the average nominal TTF nat gas price from 2010 to 2019 was EUR 20/MWh while the inflation adjusted price was EUR 26/MWh. The 2027 TTF nat gas contract is thus now trading very close to the historical inflation adjusted average.
The falling nat gas price is in part a fundamental driver and in part an associated driver for the EUA price. The fundamental dynamics of the EU ETS market are highly complex because there are so many different participants with different strategies and abatement cost curves. As such it is hard to base trading of EUAs on a complex fundamental bottom up model. The more robust and simple thinking which we think traders may follow is: ”Natural gas is a low CO2 emitting fossil fuel. If the price of nat gas falls then it gets cheaper to switch to a lower emitting fossil fuel. I.e. it gets cheaper to be semi-green.” The trading rule then becomes: ”Sell EUAs if the price of nat gas falls”. With little further in-depth analysis. It’s an associated trading strategy and we think this strategy has been hard at work sine October/November 2023.
The front-year TTF nat gas contract versus the front-month EUA price since Jan 2023. Accelerated selling from Oct/Nov last year.
The good old Coal-to-Gas abatement dynamics is the cornerstone to ”sell EUAs if gas prices fall”. Almost half of emissions in the EU ETS system stems from the power sector running on a mix of coal, gas and other non-emitting sources of power. There is an assumed flex between coal and gas power production and this flex is driven by relative prices in coal, gas and CO2. So if the nat gas price falls, the power sector will burn more gas because it is cheaper, emit less CO2 so the EUA price falls.
If the EU ETS market is massively oversupplied as it was from 2008 to 2019 it hands no constraints at all on the emitters. The result is no dynamical price interaction between the EUA price and Coal-to-Gas differentials. But if the EU ETS market is nicely balanced then C-t-G dynamics kicks in and the EUA price will start to trade on the balance ”Coal+CO2 = Nat gas + CO2” where nat gas of course has a much lower carbon emitting intensity.
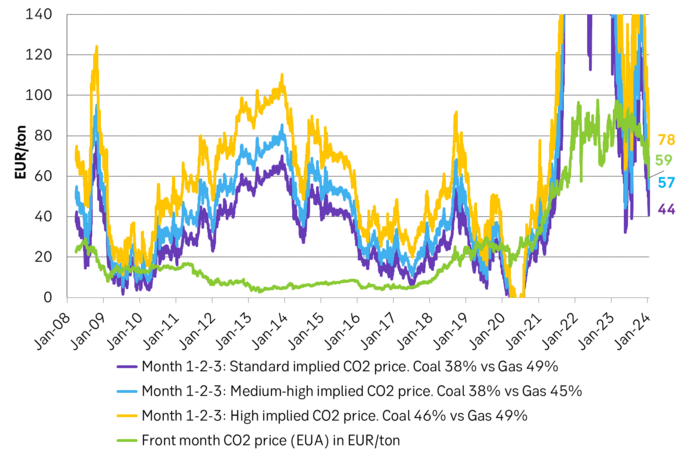
But there is not one switching balance as there are many coal and gas plants with different efficiencies. If we choose three different sets of coal and nat gas power plant efficiency combinations and graph them back in time with focus on front-end power market dynamics we typically get the following.
Coal-to-Gas switching price bands given by front-end power market dynamics are basically saying: ”What should the CO2 price have been for coal and nat gas power plants to be equally competitive.” Here compared with the actual front-month EUA price.
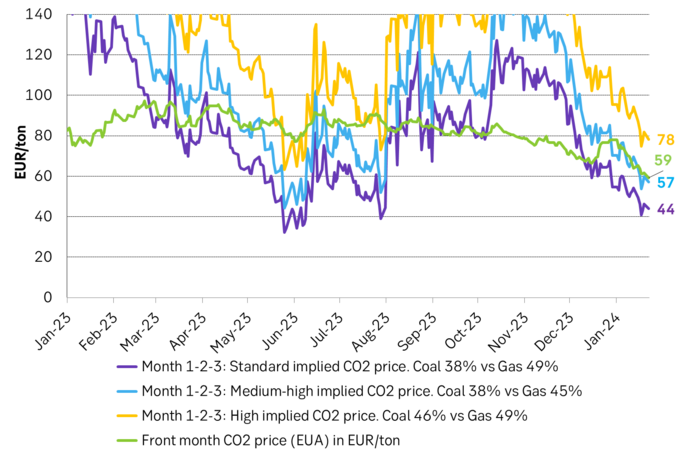
The same graph but starting in 2023. These implied Coal-to-Gas switching bands are highly sensitive to changes in coal and nat gas prices. This probably makes them partially difficult to trade on on a daily basis. Thus trading strategies typically end up with a simpler rule: ”Sell EUAs if the nat gas price falls”.
Coal-to-Gas switching price bands given by front-end power market dynamics are basically saying: ”What should the CO2 price have been for coal and nat gas power plants to be equally competitive.” Here compared with the actual front-month EUA price.
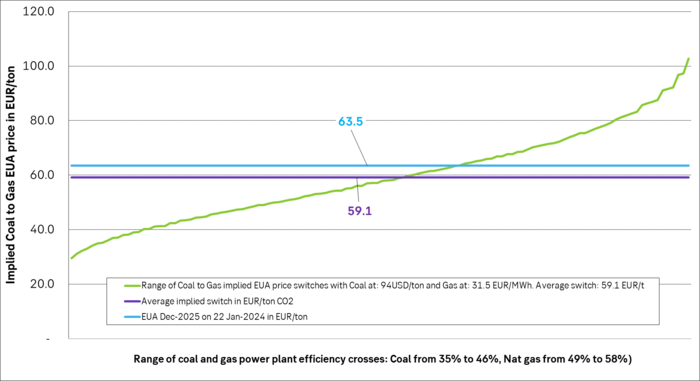
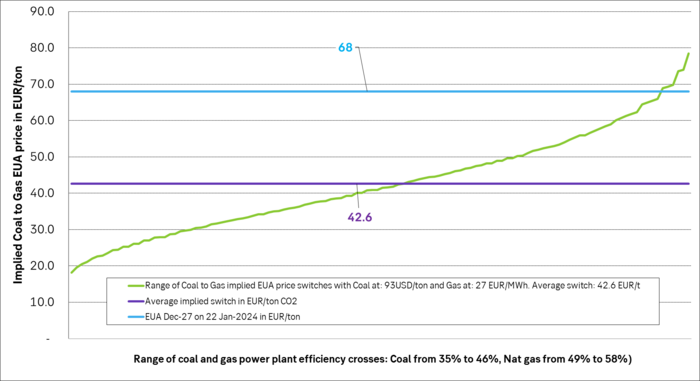
But the possible combination of efficiencies between coal and nat gas is much wider. Coal power plant efficiencies in Europe are assumed to have a range of 35% to 46% while nat gas power plants have an assumed range of 49% to 58%. The following graph has made all the combinatoric crosses in 1% incremental steps. All for the same given set of coal and gas price which here was chosen as the front-year ARA coal price of USD 94/ton versus the front-year (2025) nat gas price of EUR 31.5/MWh. Then all these outcomes are sorted from low to high.
What this distribution shows is that if the ”fair” EUA price stemming from C-t-G differentials can be very wide depending on how loose or tight the EUA market is. If it is quite loose, but just tight enough for C-t-G differentials to matter then the fair EUA price for this given set of coal and gas prices could be as low as EUR 30/ton. Conversely, if the EUA market is so tight that C-t-G differentials are on the verge to not matter any more, then the fair price could be as high as EUR 100/ton.
But the average of all these cross-combinations is EUR 59.1/ton which is quite close to where the front-year EUA is trading today.
Distribution of front-year implied EUA prices given by C-t-G differentials based on front-year coal and nat gas prices
In the following graph we have done the same cross-calculations but for calendar 2027. What we see here is that the current EUA Dec-2027 is trading far up in the distribution of switches to the level where switching is maxed out completely to the point where C-t-G differentials do not matter any more
Distribution of calendar 2027 implied EUA prices given by C-t-G differentials based on Y2027 coal and nat gas prices and compared to the current Dec-27 EUA price. It may be random, but interpretation here is that by 2027, the power market dynamics will start to matter little for the EUA price as the capacity to switch to nat gas has maxed out completely.
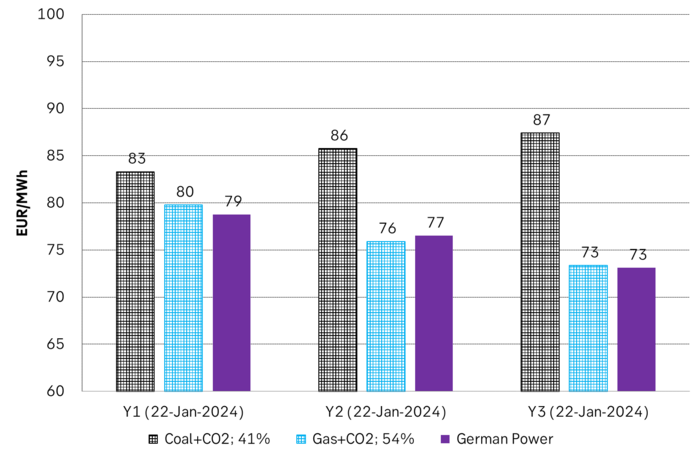
This is also visible when we calculate the cost of coal+CO2 and gas+CO2 for the nearest three years to 2027 and compare them to German power prices for these years. What we see is that coal power plants are completely price out of the stack and are no longer competitive. Unless of course they are located in a place where they cannot be out-competed by nat gas power plants due to grid restrictions. The result is high, local power prices instead.
The market price of German power for 2025/26/27 versus the cost of production by coal and gas with CO2 market prices included.
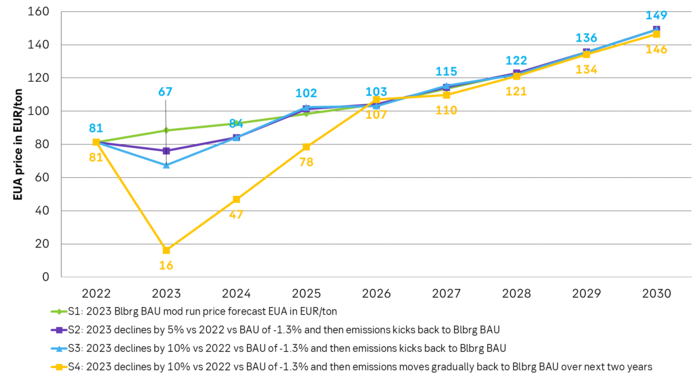
Sharp reduction in emissions due to the energy crisis has a maximum three year impact before the EUA price is back to EUR 100/ton. Early in January it was reported by Agora Energiewende and then further by Blbrg that German emissions dropped YoY by 73 mt to 70-year low in 2023. That is roughly a 10% YoY reduction in emissions. But it is for the whole economy and not just for the part of German emissions which are compliant under the EU ETS. Further it was stated that only 15% of the 73 mt YoY reduction was of permanent nature while 85% was deemed temporary. I.e. they will kick back over time.
We have used Blbrgs Carbon Price Model to run different scenarios with emission reduction shocks. We have assumed that what happened with emissions in Germany in 2023 is representative for the whole EU ETS to a lesser and larger degree. The model is of course a simplified, stylistic representation of the world so result must be treated with caution.
In the first set of scenarios we assume that the market ”only has 1-year forward vision” and then knows nothing about the future tightening. I.e. it is consistently front-end or front-year spot market balance and dynamics which dictates the prices. What these runs indicates is that the whole emission reduction shock from the recent energy crisis will by wiped away by 2026 with EUA prices then again trading back at EUR 100/ton. One likely reason for this is the MSR dynamic which quickly removes surplus EUAs from the market and brings TNAC (Total Number of Allowances in Circulation) back below the upper trigger level of 833 mt.
Since EUAs are bankable anyone can borrow money today and buy an EUA and carry it on an account for three years for three years to 2026 when the price will be back to EUR 100/b. Depending on what cost of carry you assume the implied value of an EUA today is thus at least EUR 80/ton.
The following model runs have only one year forward vision and as such cannot ”see” future coming tightness. As such the EUA price can crash for a single year as it is constantly the front-end fundamentals which dictates the price dynamics rather than longer-term fundamentals.
Scenarios on Blbrgs Carbon Price Model assuming emission reduction shock in 2023. All price paths are back to EUR 100/ton by 2026. This implies a value of an EUA spot today of at least EUR 80/ton
Selling down on a ”deal”. Brent crude fell 6.2% last week with accelerated weakness towards the end of the week. Close of the week at $87.33/b and low of the week (and on Friday) of $85.8/b. Brent is falling another 4% this morning to $83.7/b on confirmation by Iran that a MoU text has been reached and that it will be signed on Friday this week.

So what is this ”deal” worth? Talk on the desk here this morning is that it is much like ”putting lipstick on a pig” where Trump has to sell this at home as a victory where ”the SoH has reopened”, the nuclear issue will be ironed out over the coming 60 days (or maybe 600 days?) and US consumers are getting a lower gasoline price and maybe US republicans survives the midterm elections.
The importance for Iran is that it emerges as the defacto winner of this war in the eyes of the non-US public world. That Iran now onwards is the ”ruler of the SoH” (combo of geography and new weapons systems like drones) or more softer: ”the guarantor of safe passage through the SoH”.
Iran doesn’t need nuclear weapons any more. Nuclear deterrence doesn’t work any more. Ukraine has made many attacks deep into Russia without being nuked in return. Plenty of Iranian ballistic rockets blasts over Israel but Iran wasn’t nuked in return.
There is no trust between the US and Iran. We don’t know all the details yet of the MoU. But what we do know is that there is no trust between the US and Iran what so ever. This is probably more like a descriptive text on how they can cooperate in a way where both sides keeps tactical leverage. Neither side makes irreversible concessions. Violations can be punished quickly. Cooperation produces immediate benefits.
This is a fragile structure. It can easily break down. There may be details which cannot be overcome. To be seen on Friday. The US has to show that it is willing put enough force behind managing and restraining Israel versus Hezbollah in Lebanon. We have seen that Netanyahu hasn’t listened all that much to Trump’s directives and wishes. This could be a major obstacle.
A gradual reopening is tactically preferable for Iran. A tactical leverage for Iran right now is that global oil stocks have been drawn down towards painful and increasingly dangerous levels with increasing risks for oil price spikes in mid-July to August. This together with US midterm elections on 3 November gives tactical leverage to Iran. Iran probably doesn’t want to fully give up on that leverage. A rapid, full reopening where global stocks are able to refill over the coming 60 days will significantly erode that leverage. If Iran reinstates a closure of the SoH after 60 days (if talks break down again), then the effect won’t be that impactful in terms of prices and the US midterm elections.
So a gradual and partial reopening where global markets gets the oil they need while they are unable to rebuild stocks could be a practical middle way for both parties. Trump can sell it as ”the SoH has reopened” and get affordable gasoline for US consumers. Iran can sell it as ”the SoH has fully reopened, but there is some friction” so flow is only 60-80% of normal.
Not much real demand destruction below $100/b. What we do know is that there is not much real price pain demand destruction for oil globally at an oil price below $100/b. A lot of demand-shock destruction. Fear. But demand should now come roaring back towards normal with fear for exceptionally high prices now is rapidly receding.
Sudden China demand destruction due to EVs? Bullocks. EV share of total Chinese carpool now around 13%. Share of new sales of EVs has reached 50%. This is a very gradual process. It doesn’t make oil demand fall like a rock over night. When EV new sales share reaches 100%, then the gasoline car pool will contract by some 5-10% per year. But that is only gasoline. Sudden reduction in Chinese oil demand is more about shock and risk.
Chinese crude oil imports will come roaring back. At what price? Today’s ”neutral” oil price is $70/b. That is the five year price which has steadily traded around the $70/b mark over the past 3-4 years. With still a risky picture one would think that China and the rest of the world will be big buyers of oil in the range of $70-85/b.
Global demand will likely snap back towards normal, forecasted demand and growth at such prices.
Physical reopening is a gradual process. The physical and practical reopening of the SoH will likely be gradual rather than sudden. And that probably suites Iran tactically as well.
Brent M1 price versus the Brent 5-yr (today’s ”normal” price)

Market is starting to take US/Iran headlines with a pinch of salt. Brent crude rose $2.8/b yesterday to an official close of $112.1/b. But after that it traded as low as $108.05/b before ending late night at around $109.7/b. Through the day it traded in a range of $106.87 – 112.72/b amid a flurry of news or rumors from Iran and the US. ”US temporary sanctions during negotiations” (falls alarm). ”We will bomb Iran” (not anyhow),… etc. While the market is still fluctuating to this kind of news flow, it is starting to take such headlines with a pinch of salt.
We’ll see. Maybe, maybe not. The Brent M1 contract is trading at $110.2/b this morning which very close to the average ticks through yesterday of $110.4/b.
Trump with bearish, verbal intervention whenever Brent trades above $110/b it seems. What seems to be a pattern is that Trump states something like ”very good negotiations going on with Iran”, ”New leaders in Iran are great,..”, ”Great progress in negotiations,…”, ”Deal in sight,..” etc whenever the Brent M1 contract trades above $110/b. An effort to cool the market. These hot air verbal interventions from Trump used to have a heavy bearish impact on prices, but they now seems to have less and less effect unless they are backed by reality.
As far as we can see there has been no real progress in the negotiations between the US and Iran with both sides still standing by their previous demands.
Iran is getting stronger while the cease fire lasts making a return to war for Trump yet harder. Iran is naturally in constant preparation for a return to war given Trump’s steady threats of bombing Iran again. Iran is naturally doing what ever is possible to prepare for a return to war. And every day the cease fire lasts it is better prepared. This naturally makes it more and more difficult and dangerous for the US to return to warring activity versus Iran as the consequences for energy infrastructure in the Persian Gulf will be more and more severe the longer the cease fire lasts. Israel seems to see it this way as well. That the war is not won and that current frozen state of a cease fire gives Iran opportunity to rebuild military and politically.
Global inventories are drawing down day by day. How much? In the meantime the Strait of Hormuz stays closed. There is varying measures and estimates of how much global inventories are drawing down. Our rough estimate, back of the envelope, is that global inventories are drawing down by at least some 10 mb/d or about 300 mb/d in a balance between loss of supply versus demand destruction. Other estimates we see are a monthly draw of 250-270 mb/d. The IEA only ’measured’ a draw in global observable stocks of 117 mb in April with oil on water rising 53 mb while on shore stocks fell 170 mb. But global stocks are hard to measure with large invisible, unmeasured stocks. As such a back of the envelope approach may be better.
Oil products is what the world is consuming. Oil product prices likely to rise while product stocks fall. Strategic Petroleum Reserves (SPR) are predominantly crude oil. Discharging oil from OECD SPR stocks, a sharp reduction in Chinese crude imports and a reduction in global refinery throughput of 6-7 mb/d has helped to keep crude oil markets satisfactorily supplied. But global inventories are drawing down none the less. And oil products is really what the world is consuming. So if global refinery throughput stays subdued, then demand will eventually have to match the supply of oil products. The likely path forward this summer is a steady draw down in jet fuel, diesel and gasoline. Higher prices for these. Then, if possible, higher refinery throughput and higher usage of crude in response to very profitable refinery margins. And lastly sharper draw in crude stocks and higher prices for these. But some 6 mb/d of oil products used to be exported through the Strait of Hormuz. And it may not be so easy to ramp up refinery activity across the world to compensate. Especially as Ukraine continues to damage Russian refineries as well as Russian crude production and export facilities.
Watch oil product stocks and prices as well as Brent calendar 2027. What to watch for this summer is thus oil product inventories falling and oil product premiums to crude rising. Another measure to watch is the Brent crude 2027 contract as it rises steadily day by day as the Strait of Hormuz stays closed and global oil inventories decline. The latter is close to the highest level since the start of the war and keeps rising.
The Brent M1 contract and the Brent 2027 prices and current price of jet fuel in Europe (ARA). All in USD/b

Our back of the envelope calculation of the global shortage created by the closure of the Strait of Hormuz. Note that 3.5 mb/d of discharge from SPR is also a draw. Note also that ’Forced demand loss’ of 2.5 mb/d is probably temporary and will fall back towards zero as logistics are sorted out leaving ’Price demand loss’ to do the job of balancing the market. Thus a shortfall of at least 9 mb/d created by the closure. More if SPR discharge is included and more if Forced demand loss recedes.

Brent is climbing higher. Front-month is at USD 106.3/bl this morning, close to a weekly high and a USD 9/bl jump from Mondays open. This is the move we flagged as a risk earlier in the week: the market shifting from ”a deal is around the corner” to ”this is going to take longer than we thought”.

Analyst Commodities, SEB
During April, rest-of-year Brent remained remarkably stable around USD 90/bl. A stability which rested on one single assumption: the SoH reopens around 1 May. That assumption is now slowly falling apart.
As we highlighted yesterday: every week of delay beyond 1 May adds (theoretically) ish USD 5/bl to the rest-of-year average, as global inventories draw 100 million barrels per week. i.e., a mid-May reopening implies rest-of-year Brent closer to USD 100/bl, and anything pushing into June or July takes us meaningfully higher.
What’s changed in the last 48 hours:
#1: The US military has formally warned that clearing suspected sea mines from SoH could take up to six months. That is a completely different timescale from what the financial market is pricing. Even a political deal tomorrow does not immediately reopen the strait.
#2: Trump has shifted his tone from urgency to ”strategic patience”. In yesterday’s press conference: ”Don’t rush me… I want a great deal.” The market is reading this as a president no longer feeling pressured by timelines, with the naval blockade running in the background.
#3: So far, the military activity is escalating, not de-escalating. Axios reports Iran is laying more mines in SoH. The US 3rd carrier strike group (USS George H.W. Bush) is arriving with two countermine vessels. Trump yesterday ordered the US Navy to destroy any Iranian boats caught laying mines. While CNN reports that the Pentagon is actively drawing up plans to strike Iranian SoH capabilities and individual Iranian military leaders if the ceasefire collapses. i.e., NOT a attitude consistent with an imminent deal!
Spot crude and product prices eased off the early-April highs on a combination of system rerouting and deal optimism. Both now weakening. Goldman estimates April Gulf output is reduced by 14.5 mbl/d, or 57% of pre-war supply, a number that keeps getting worse the longer this drags on.
Demand-side adaptation is ongoing: S. Korea has cut its Middle East crude dependence from 69% to 56% by pulling more from the Americas and Africa, and Japan is kicking off a second round of SPR releases from 1 May. But SPRs are finite.
Ref. to the negotiations, we should not bet on speed. The current Iranian leadership is dominated by genuine hardliners willing to absorb economic pain and run the clock to extract concessions. That is not a setup for a rapid resolution. US/Israeli media briefings keep framing the delay as ”internal Iranian divisions”, the reality is more complicated and points toward weeks and months, not days.
Our point is that the complexity is large, and higher prices have only just started (given a scenario where the negotiations drag out in time). The market spent April leaning on the USD 90/bl rest-of-year assumption; that case is diminishing by the hour. If ”early May reopening” is replaced by ”June, July or later” over the next week or two, both crude and products have meaningful room to reprice higher from here. There is a high risk being short energy and betting on any immediate political resolution(!).


Vattenfalls och Industrikrafts kärnkraftsbolag Videberg Kraft har valt Rolls-Royce SMR
Selling down on a ”deal”

Sommarväder skapar prisrally på elbörsen
Oil product price pain is set to rise as the Strait of Hormuz stays closed into summer

Solkraften pressar elpriserna dagtid
Oil product price pain is set to rise as the Strait of Hormuz stays closed into summer
Sommarväder skapar prisrally på elbörsen
Vattenfalls och Industrikrafts kärnkraftsbolag Videberg Kraft har valt Rolls-Royce SMR
Selling down on a ”deal”
-
Analys4 veckor sedan
Oil product price pain is set to rise as the Strait of Hormuz stays closed into summer
-
Nyheter2 veckor sedan
Sommarväder skapar prisrally på elbörsen
-
 Nyheter3 dagar sedan
Vattenfalls och Industrikrafts kärnkraftsbolag Videberg Kraft har valt Rolls-Royce SMR
-
Analys3 dagar sedan
Selling down on a ”deal”