

Analys
The value of an EUA spot contract is at least EUR 80/ton

A fight between short-term C-t-G differentials at EUR 40-60/ton and longer term values of EUR 100/ton already in 2026. The value of an EUA today is thus at least EUR 80/ton.

Low emissions, falling nat gas and C-t-G differentials and EUA prices falling along with that is all the range in current market dynamics. But it won’t last as the MSR will quickly remove surpluses and the steep decline in supply of EUAs from 2026 onward will quickly drive the EUA price back up and above C-t-G differentials. The EUA price will then stop relating to power market dynamics as C-t-G switching is maxed out.
The EUA market is currently driven by front-end and front-year Coal-to-Gas dynamics and differentials with the EUA price in the balance between the two. At the very front-end (1-2-3 mths) the C-t-G differentials implies an EUA price close to EUR 40/ton while the front-year 2025 has a C-t-G differential of a little over EUR 60/ton. Thus the front-year is probably a better and stronger guide right now.
But C-t-G differentials holds wide ranges of values and are very sensitive to changes in coal and nat gas prices. So the simple rule of trading approach is probably: ”Sell EUAs if the nat gas price falls”.
The total capacity to switch between coal and gas and thus flex the total amount of emissions is quite limited with a capacity of maybe only 100 mt reduction potential. Thus as the number of allowances declines in the coming years the C-t-G differentials will stop to matter as the switch will max out. Implied by modeling (Blbrg) and also by market pricing of calendar 2026 and 2027 this looks set to happen over the coming 2-3 years. The consequence will be EUA prices which will be above C-t-G differential values and disjoint from power market dynamics.
The EU ETS market probably experienced an emission reduction shock in 2023 where total German emissions are estimated to have fallen by 73 mt YoY to 2023 or some 10%. If we assume that this also is true for the whole EU ETS sector and run Bloomberg’s Carbon Price Model we see that the consequence of this emission reduction shock is washed out by 2026 with the EUA price then back at EUR 100/ton and above. The reason for this is probably due to the Market Stability Reserve dynamics which quickly removes any surplus EUAs in the market and brings the TNAC quickly down below the 833 mt upper trigger level again.
The model runs tells us that no matter what happens to gas prices and EUA prices and emissions in 2023/24, it will all wash out withing three years with the EUA price back at EUR 100/ton in 2026. If we assume a cost of carry of 7% it implies that the value of an EUA today is minimum EUR 80/ton due to bankability (buy today and hold to 2026 and then sell).
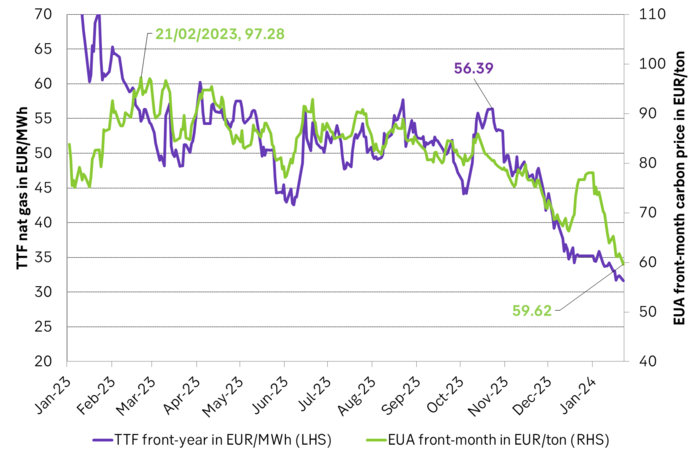
The sell-off in natural gas prices has been the guiding light for the sell-off in EUAs. Accelerated decline in natural gas prices seems to be the guiding light for the EUA price. The decline in the front-year TTF nat gas price accelerated from late October 2023 and continues to trade lower and lower. The front-year 2025 yesterday closed at EUR 32/MWh (-1.1% on the day) while the year 2027 traded down 0.9% to EUR 27.1/MWh. In comparison the average nominal TTF nat gas price from 2010 to 2019 was EUR 20/MWh while the inflation adjusted price was EUR 26/MWh. The 2027 TTF nat gas contract is thus now trading very close to the historical inflation adjusted average.
The falling nat gas price is in part a fundamental driver and in part an associated driver for the EUA price. The fundamental dynamics of the EU ETS market are highly complex because there are so many different participants with different strategies and abatement cost curves. As such it is hard to base trading of EUAs on a complex fundamental bottom up model. The more robust and simple thinking which we think traders may follow is: ”Natural gas is a low CO2 emitting fossil fuel. If the price of nat gas falls then it gets cheaper to switch to a lower emitting fossil fuel. I.e. it gets cheaper to be semi-green.” The trading rule then becomes: ”Sell EUAs if the price of nat gas falls”. With little further in-depth analysis. It’s an associated trading strategy and we think this strategy has been hard at work sine October/November 2023.
The front-year TTF nat gas contract versus the front-month EUA price since Jan 2023. Accelerated selling from Oct/Nov last year.
The good old Coal-to-Gas abatement dynamics is the cornerstone to ”sell EUAs if gas prices fall”. Almost half of emissions in the EU ETS system stems from the power sector running on a mix of coal, gas and other non-emitting sources of power. There is an assumed flex between coal and gas power production and this flex is driven by relative prices in coal, gas and CO2. So if the nat gas price falls, the power sector will burn more gas because it is cheaper, emit less CO2 so the EUA price falls.
If the EU ETS market is massively oversupplied as it was from 2008 to 2019 it hands no constraints at all on the emitters. The result is no dynamical price interaction between the EUA price and Coal-to-Gas differentials. But if the EU ETS market is nicely balanced then C-t-G dynamics kicks in and the EUA price will start to trade on the balance ”Coal+CO2 = Nat gas + CO2” where nat gas of course has a much lower carbon emitting intensity.
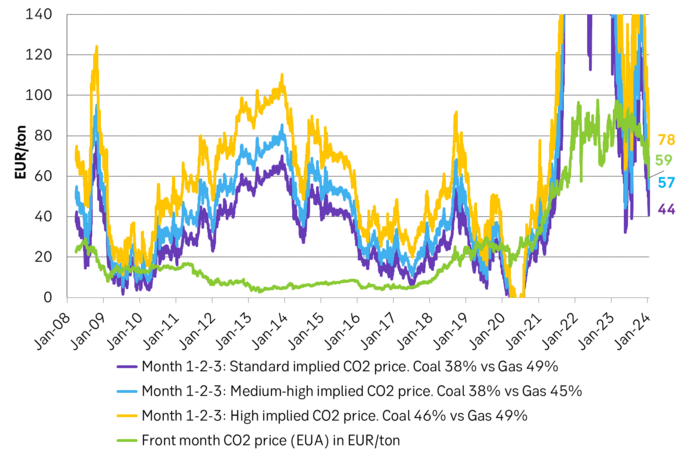
But there is not one switching balance as there are many coal and gas plants with different efficiencies. If we choose three different sets of coal and nat gas power plant efficiency combinations and graph them back in time with focus on front-end power market dynamics we typically get the following.
Coal-to-Gas switching price bands given by front-end power market dynamics are basically saying: ”What should the CO2 price have been for coal and nat gas power plants to be equally competitive.” Here compared with the actual front-month EUA price.
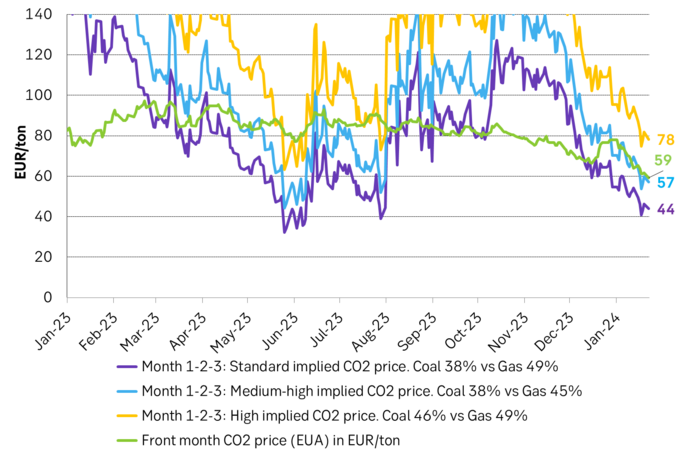
The same graph but starting in 2023. These implied Coal-to-Gas switching bands are highly sensitive to changes in coal and nat gas prices. This probably makes them partially difficult to trade on on a daily basis. Thus trading strategies typically end up with a simpler rule: ”Sell EUAs if the nat gas price falls”.
Coal-to-Gas switching price bands given by front-end power market dynamics are basically saying: ”What should the CO2 price have been for coal and nat gas power plants to be equally competitive.” Here compared with the actual front-month EUA price.
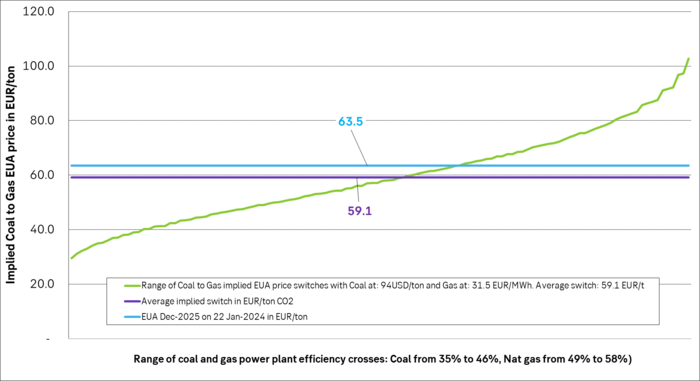
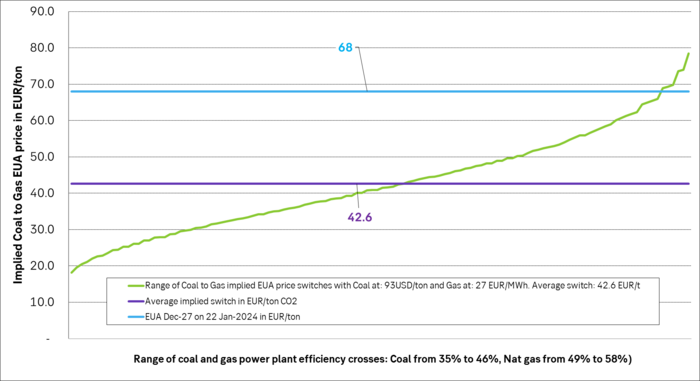
But the possible combination of efficiencies between coal and nat gas is much wider. Coal power plant efficiencies in Europe are assumed to have a range of 35% to 46% while nat gas power plants have an assumed range of 49% to 58%. The following graph has made all the combinatoric crosses in 1% incremental steps. All for the same given set of coal and gas price which here was chosen as the front-year ARA coal price of USD 94/ton versus the front-year (2025) nat gas price of EUR 31.5/MWh. Then all these outcomes are sorted from low to high.
What this distribution shows is that if the ”fair” EUA price stemming from C-t-G differentials can be very wide depending on how loose or tight the EUA market is. If it is quite loose, but just tight enough for C-t-G differentials to matter then the fair EUA price for this given set of coal and gas prices could be as low as EUR 30/ton. Conversely, if the EUA market is so tight that C-t-G differentials are on the verge to not matter any more, then the fair price could be as high as EUR 100/ton.
But the average of all these cross-combinations is EUR 59.1/ton which is quite close to where the front-year EUA is trading today.
Distribution of front-year implied EUA prices given by C-t-G differentials based on front-year coal and nat gas prices
In the following graph we have done the same cross-calculations but for calendar 2027. What we see here is that the current EUA Dec-2027 is trading far up in the distribution of switches to the level where switching is maxed out completely to the point where C-t-G differentials do not matter any more
Distribution of calendar 2027 implied EUA prices given by C-t-G differentials based on Y2027 coal and nat gas prices and compared to the current Dec-27 EUA price. It may be random, but interpretation here is that by 2027, the power market dynamics will start to matter little for the EUA price as the capacity to switch to nat gas has maxed out completely.
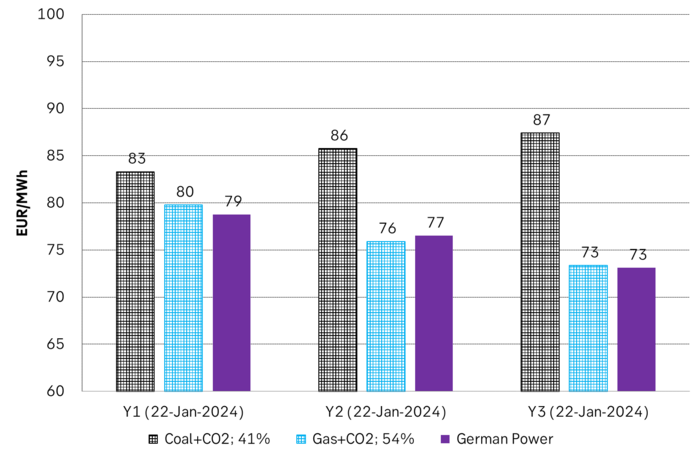
This is also visible when we calculate the cost of coal+CO2 and gas+CO2 for the nearest three years to 2027 and compare them to German power prices for these years. What we see is that coal power plants are completely price out of the stack and are no longer competitive. Unless of course they are located in a place where they cannot be out-competed by nat gas power plants due to grid restrictions. The result is high, local power prices instead.
The market price of German power for 2025/26/27 versus the cost of production by coal and gas with CO2 market prices included.
Sharp reduction in emissions due to the energy crisis has a maximum three year impact before the EUA price is back to EUR 100/ton. Early in January it was reported by Agora Energiewende and then further by Blbrg that German emissions dropped YoY by 73 mt to 70-year low in 2023. That is roughly a 10% YoY reduction in emissions. But it is for the whole economy and not just for the part of German emissions which are compliant under the EU ETS. Further it was stated that only 15% of the 73 mt YoY reduction was of permanent nature while 85% was deemed temporary. I.e. they will kick back over time.
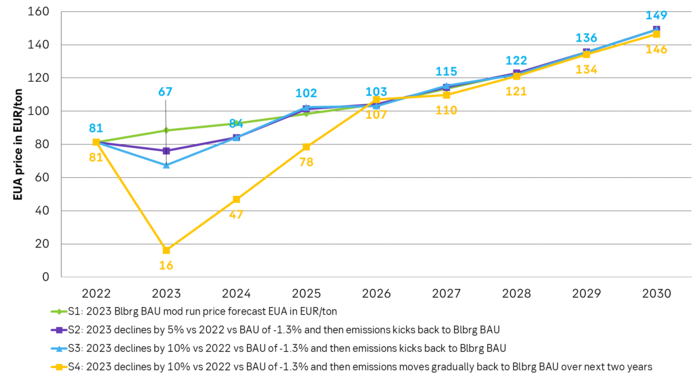
We have used Blbrgs Carbon Price Model to run different scenarios with emission reduction shocks. We have assumed that what happened with emissions in Germany in 2023 is representative for the whole EU ETS to a lesser and larger degree. The model is of course a simplified, stylistic representation of the world so result must be treated with caution.
In the first set of scenarios we assume that the market ”only has 1-year forward vision” and then knows nothing about the future tightening. I.e. it is consistently front-end or front-year spot market balance and dynamics which dictates the prices. What these runs indicates is that the whole emission reduction shock from the recent energy crisis will by wiped away by 2026 with EUA prices then again trading back at EUR 100/ton. One likely reason for this is the MSR dynamic which quickly removes surplus EUAs from the market and brings TNAC (Total Number of Allowances in Circulation) back below the upper trigger level of 833 mt.
Since EUAs are bankable anyone can borrow money today and buy an EUA and carry it on an account for three years for three years to 2026 when the price will be back to EUR 100/b. Depending on what cost of carry you assume the implied value of an EUA today is thus at least EUR 80/ton.
The following model runs have only one year forward vision and as such cannot ”see” future coming tightness. As such the EUA price can crash for a single year as it is constantly the front-end fundamentals which dictates the price dynamics rather than longer-term fundamentals.
Scenarios on Blbrgs Carbon Price Model assuming emission reduction shock in 2023. All price paths are back to EUR 100/ton by 2026. This implies a value of an EUA spot today of at least EUR 80/ton
When it starts to move lower it moves rather quickly. Gaza, China, IEA. Brent crude is down 2.1% today to $62/b after having traded as high as $66.58/b last Thursday and above $70/b in late September. The sell-off follows the truce/peace in Gaze, a flareup in US-China trade and yet another bearish oil outlook from the IEA.

A lasting peace in Gaze could drive crude oil at sea to onshore stocks. A lasting peace in Gaza would probably calm down the Houthis and thus allow more normal shipments of crude oil to sail through the Suez Canal, the Red Sea and out through the Bab-el-Mandeb Strait. Crude oil at sea has risen from 48 mb in April to now 91 mb versus a pre-Covid normal of about 50-60 mb. The rise to 91 mb is probably the result of crude sailing around Africa to be shot to pieces by the Houthis. If sailings were to normalize through the Suez Canal, then it could free up some 40 mb in transit at sea moving onshore into stocks.
The US-China trade conflict is of course bearish for demand if it continues.
Bearish IEA yet again. Getting closer to 2026. Credibility rises. We expect OPEC to cut end of 2025. The bearish monthly report from the IEA is what it is, but the closer we get to 2026, the more likely the IEA is of being ball-park right in its outlook. In its monthly report today the IEA estimates that the need for crude oil from OPEC in 2026 will be 25.4 mb/d versus production by the group in September of 29.1 mb/d. The group thus needs to do some serious cutting at the end of 2025 if it wants to keep the market balanced and avoid inventories from skyrocketing. Given that IEA is correct that is. We do however expect OPEC to implement cuts to avoid a large increase in inventories in Q1-26. The group will probably revert to cuts either at its early December meeting when they discuss production for January or in early January when they discuss production for February. The oil price will likely head yet lower until the group reverts to cuts.
Dubai: The Mid-East anchor dragging crude oil lower. Surplus emerging in Mid-East pricing. Crude oil prices held surprisingly strong all through the summer. A sign and a key source of that strength came from the strength in the front-end backwardation of the Dubai crude oil curve. It held out strong from mid-June and all until late September with an average 1-3mth time-spread premium of $1.8/b from mid-June to end of September. The 1-3mth time-spreads for Brent and WTI however were in steady deterioration from late June while their flat prices probably were held up by the strength coming from the Persian Gulf. Then in late September the strength in the Dubai curve suddenly collapsed. Since the start of October it has been weaker than both the Brent and the WTI curves. The Dubai 1-3mth time-spread now only stands at $0.25/b. The Middle East is now exporting more as it is producing more and also consuming less following elevated summer crude burn for power (Aircon) etc.
The only bear-element missing is a sudden and solid rise in OECD stocks. The only thing that is missing for the bear-case everyone have been waiting for is a solid, visible rise in OECD stocks in general and US oil stocks specifically. So watch out for US API indications tomorrow and official US oil inventories on Thursday.
No sign of any kind of fire-sale of oil from Saudi Arabia yet. To what we can see, Saudi Arabia is not at all struggling to sell its oil. It only lowered its Official Selling Prices (OSPs) to Asia marginally for November. A surplus market + Saudi determination to sell its oil to the market would normally lead to a sharp lowering of Saudi OSPs to Asia. Not yet at least and not for November.
The 5yr contract close to fixed at $68/b. Of importance with respect to how far down oil can/will go. When the oil market moves into a surplus then the spot price starts to trade in a large discount to the 5yr contract. Typically $10-15/b below the 5yr contract on average in bear-years (2009, 2015, 2016, 2020). But the 5yr contract is usually pulled lower as well thus making this approach a moving target. But the 5yr contract price has now been rock solidly been pegged to $68/b since 2022. And in the 2022 bull-year (Brent spot average $99/b), the 5yr contract only went to $72/b on average. If we assume that the same goes for the downside and that 2026 is a bear-year then the 5yr goes to $64/b while the spot is trading at a $10-15/b discount to that. That would imply an average spot price next year of $49-54/b. But that is if OPEC doesn’t revert to cuts and instead keeps production flowing. We think OPEC(+) will trim/cut production as needed into 2026 to prevent a huge build-up in global oil stocks and a crash in prices. But for now we are still heading lower. Into the $50ies/b.
Some rebound but not much. Brent crude rebounded 1.5% yesterday to $65.47/b. This morning it is inching 0.2% up to $65.6/b. The lowest close last week was on Thursday at $64.11/b.
The curve structure is almost as week as it was before the weekend. The rebound we now have gotten post the message from OPEC+ over the weekend is to a large degree a rebound along the curve rather than much strengthening at the front-end of the curve. That part of the curve structure is almost as weak as it was last Thursday.
We are still on a weakening path. The message from OPEC+ over the weekend was we are still on a weakening path with rising supply from the group. It is just not as rapidly weakening as was feared ahead of the weekend when a quota hike of 500 kb/d/mth for November was discussed.
The Brent curve is on its way to full contango with Brent dipping into the $50ies/b. Thus the ongoing weakening we have had in the crude curve since the start of the year, and especially since early June, will continue until the Brent crude oil forward curve is in full contango along with visibly rising US and OECD oil inventories. The front-month Brent contract will then flip down towards the $60/b-line and below into the $50ies/b.
At what point will OPEC+ turn to cuts? The big question then becomes: When will OPEC+ turn around to make some cuts? At what (price) point will they choose to stabilize the market? Because for sure they will. Higher oil inventories, some more shedding of drilling rigs in US shale and Brent into the 50ies somewhere is probably where the group will step in.
There is nothing we have seen from the group so far which indicates that they will close their eyes, let the world drown in oil and the oil price crash to $40/b or below.
The message from OPEC+ is also about balance and stability. The world won’t drown in oil in 2026. The message from the group as far as we manage to interpret it is twofold: 1) Taking back market share which requires a lower price for non-OPEC+ to back off a bit, and 2) Oil market stability and balance. It is not just about 1. Thus fretting about how we are all going to drown in oil in 2026 is totally off the mark by just focusing on point 1.
When to buy cal 2026? Before Christmas when Brent hits $55/b and before OPEC+ holds its last meeting of the year which is likely to be in early December.
Brent crude oil prices have rebounded a bit along the forward curve. Not much strengthening in the structure of the curve. The front-end backwardation is not much stronger today than on its weakest level so far this year which was on Thursday last week.

The front-end backwardation fell to its weakest level so far this year on Thursday last week. A slight pickup yesterday and today, but still very close to the weakest year to date. More oil from OPEC+ in the coming months and softer demand and rising inventories. We are heading for yet softer levels.

Down to the lowest since early May. Brent crude has fallen sharply the latest four days. It closed at USD 64.11/b yesterday which is the lowest since early May. It is staging a 1.3% rebound this morning along with gains in both equities and industrial metals with an added touch of support from a softer USD on top.
What stands out the most to us this week is the collapse in the Dubai one to three months time-spread.
Dubai is medium sour crude. OPEC+ is in general medium sour crude production. Asian refineries are predominantly designed to process medium sour crude. So Dubai is the real measure of the balance between OPEC+ holding back or not versus Asian oil demand for consumption and stock building.
A sharp weakening of the front-end of the Dubai curve. The front-end of the Dubai crude curve has been holding out very solidly throughout this summer while the front-end of the Brent and WTI curves have been steadily softening. But the strength in the Dubai curve in our view was carrying the crude oil market in general. A source of strength in the crude oil market. The core of the strength.
The now finally sharp decline of the front-end of the Dubai crude curve is thus a strong shift. Weakness in the Dubai crude marker is weakness in the core of the oil market. The core which has helped to hold the oil market elevated.
Facts supports the weakening. Add in facts of Iraq lifting production from Kurdistan through Turkey. Saudi Arabia lifting production to 10 mb/d in September (normal production level) and lifting exports as well as domestic demand for oil for power for air con is fading along with summer heat. Add also in counter seasonal rise in US crude and product stocks last week. US oil stocks usually decline by 1.3 mb/week this time of year. Last week they instead rose 6.4 mb/week (+7.2 mb if including SPR). Total US commercial oil stocks are now only 2.1 mb below the 2015-19 seasonal average. US oil stocks normally decline from now to Christmas. If they instead continue to rise, then it will be strongly counter seasonal rise and will create a very strong bearish pressure on oil prices.
Will OPEC+ lift its voluntary quotas by zero, 137 kb/d, 500 kb/d or 1.5 mb/d? On Sunday of course OPEC+ will decide on how much to unwind of the remaining 1.5 mb/d of voluntary quotas for November. Will it be 137 kb/d yet again as for October? Will it be 500 kb/d as was talked about earlier this week? Or will it be a full unwind in one go of 1.5 mb/d? We think most likely now it will be at least 500 kb/d and possibly a full unwind. We discussed this in a not earlier this week: ”500 kb/d of voluntary quotas in October. But a full unwind of 1.5 mb/d”
The strength in the front-end of the Dubai curve held out through summer while Brent and WTI curve structures weakened steadily. That core strength helped to keep flat crude oil prices elevated close to the 70-line. Now also the Dubai curve has given in.

Brent crude oil forward curves

Total US commercial stocks now close to normal. Counter seasonal rise last week. Rest of year?

Total US crude and product stocks on a steady trend higher.


Guld och silver stiger hela tiden mot nya höjder
The Mid-East anchor dragging crude oil lower

Samtal om sällsynta jordartsmetaller, guld och silver

Brookfield köper bränsleceller för 5 miljarder USD av Bloom Energy för att driva AI-datacenter

Teck Resources kan förse Nordamerika och kanske hela G7 med all germanium som behövs

Tyskland har så höga elpriser att företag inte har råd att använda elektricitet

OPEC+ missar produktionsmål, stöder oljepriserna

Ett samtal om guld, olja, fjärrvärme och förnybar energi
Brent crude ticks higher on tension, but market structure stays soft

Guld nära 4000 USD och silver 50 USD, därför kan de fortsätta stiga
-
Nyheter4 veckor sedan
Tyskland har så höga elpriser att företag inte har råd att använda elektricitet
-
 Nyheter3 veckor sedan
OPEC+ missar produktionsmål, stöder oljepriserna
-
 Nyheter3 veckor sedan
Ett samtal om guld, olja, fjärrvärme och förnybar energi
-
Analys4 veckor sedan
Brent crude ticks higher on tension, but market structure stays soft
-
 Nyheter2 veckor sedan
Guld nära 4000 USD och silver 50 USD, därför kan de fortsätta stiga
-
Analys3 veckor sedan
Are Ukraine’s attacks on Russian energy infrastructure working?
-

 Nyheter1 vecka sedan
Goldman Sachs höjer prognosen för guld, tror priset når 4900 USD
-

 Nyheter3 veckor sedan
Guldpriset uppe på nya höjder, nu 3750 USD