

Analys
The ”normal” oil price is USD 97/b

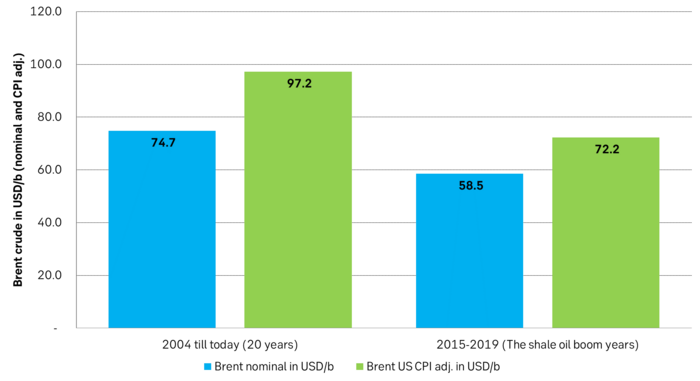
The Dated Brent crude oil price ydy closed at USD 96/b. Wow, that’s a high price! This sensation however depends on what you think is ”normal”. And normal in the eyes of most market participants today is USD 60/b. But this perception is probably largely based on the recent experience of the market. The average Brent crude oil price from 2015-2019 was USD 58.5/b. But that was a period of booming non-OPEC supply, mostly shale oil. But booming shale oil supply is now increasingly coming towards an end. Looking more broadly at the last 20 years the nominal average price was USD 75/b. But in inflation adjusted terms it was actually USD 97/b.

Saudi Arabia’s oil minister, Abdulaziz bin Salman, yesterday stated that its production cuts was not about driving the price up but instead it was preemptive versus the highly uncertain global economic development. In that respect it has a very good point. The US 2yr government bond rate has rallied to 5.06% which is the highest since 2006 and just a fraction away of being the highest since December 2000. The Chinese property market is struggling and global PMIs have been downhill since mid-2021 with many countries now at contractive, sub-50 level. Thus a deep concern for the health of the global economy and thus oil demand going forward is absolutely warranted. And thus the preemptive production cuts by Saudi Arabia. But killing the global economy off while it is wobbling with an oil price of USD 110-120/b or higher is of course not a smart thing to do either.
At the same conference in Canada yesterday the CEO of Aramco, Amin H. Nasser, said that he expected global oil demand to reach 110 m b/d in 2030 and that talk about a near term peak in global oil demand was ”driven by policies, rather than the proven combination of markets, competitive economics and technology” (Reuters).
With a demand outlook of 110 m b/d in 2030 the responsible thing to do is of course to make sure that the oil price stays at a level where investments are sufficient to cover both decline in existing production as well as future demand growth.
In terms of oil prices we tend to think about recent history and also in nominal terms. Most market participants are still mentally thinking of the oil prices we have experienced during the shale oil boom years from 2015-2019. The average nominal Brent crude price during that period was USD 58.5/b. This is today often perceived as ”the normal price”. But it was a very special period with booming non-OPEC supply whenever the WTI price moved above USD 45/b. But that period is increasingly behind us. While we could enjoy fairly low oil prices during this period it also left the world with a legacy: Subdued capex spending in upstream oil and gas all through these years. Then came the Covid-years which led to yet another trough in capex spending. We are soon talking close to 9 years of subdued capex spending.
If Amin H. Nasser is ballpark correct in his prediction that global oil demand will reach 110 m b/d in 2030 then the world should better get capex spending rolling. There is only one way to make that happen: a higher oil price. If the global economy now runs into an economic setback or recession and OPEC allows the oil price to drop to say USD 50/b, then we’d get yet another couple of years with subdued capex spending on top of the close to 9 years with subdued spending we already have behind us. So in the eyes of Saudi Arabia, Amin H. Nasser and Abdulaziz bin Salman, the responsible thing to do is to make sure that the oil price stays up at a sufficient level to ensure that capex spending stays up even during an economic downturn.
This brings us back to the question of what is a high oil price. We remember the shale oil boom years with an average nominal price of USD 58.5/b. We tend to think of it as the per definition ”normal” price. But we should instead think of it as the price depression period. A low-price period during which non-OPEC production boomed. Also, adjusting it for inflation, the real average price during this period was actually USD 72.2/b and not USD 58.5/b. If we however zoom out a little and look at the last 20 years then we get a nominal average of USD 75/b. The real, average inflation adjusted price over the past 20 years is however USD 97/b. The Dated Brent crude oil price yesterday closed at USD 96/b.
Worth noting however is that for such inflation adjustment to make sense then the assumed cost of production should actually rise along with inflation and as such create a ”rising floor price” to oil based on rising real costs. If costs in real terms instead are falling due to productivity improvements, then such inflation adjusted prices will have limited bearing for future prices. What matters more specifically is the development of real production costs for non-OPEC producers and the possibility to ramp up such production. Environmental politics in OECD countries is of course a clear limiting factor for non-OPEC oil production growth and possibly a much more important factor than the production cost it self.
But one last note on the fact that Saudi Arabia’s energy minister, Abdulaziz bin Salman, is emphasizing that the cuts are preemptive rather then an effort to drive the oil price to the sky while Amin H. Nasser is emphasizing that we need to be responsible. It means that if it turns out that the current cuts have indeed made the global oil market too tight with an oil price spiraling towards USD 110-120/b then we’ll highly likely see added supply from Saudi Arabia in November and December rather than Saudi sticking to 9.0 m b/d. This limits the risk for a continued unchecked price rally to such levels.
Oil price perspectives. We tend to think that the nominal average Brent crude oil price of USD 58.5/b during the shale oil boom years from 2015-19 is per definition the ”normal” price. But that period is now increasingly behind us. Zoom out a little to the real, average, inflation adjusted price of the past 20 years and we get USD 97/b. In mathematical terms it is much more ”normal” than the nominal price during the shale oil boom years
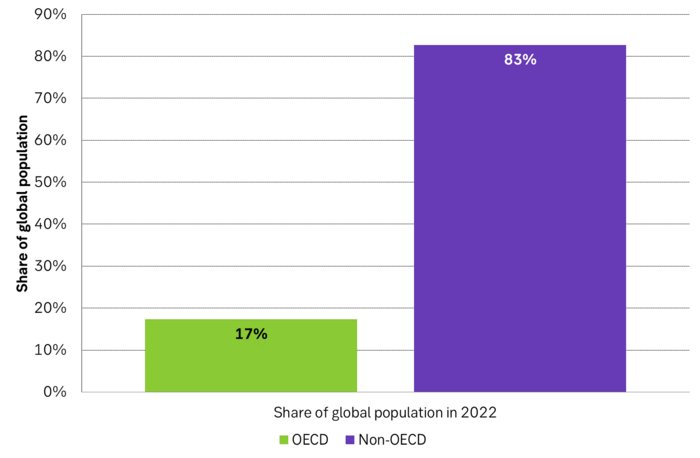
Is global oil demand about to peak 1: OECD and non-OECD share of global population
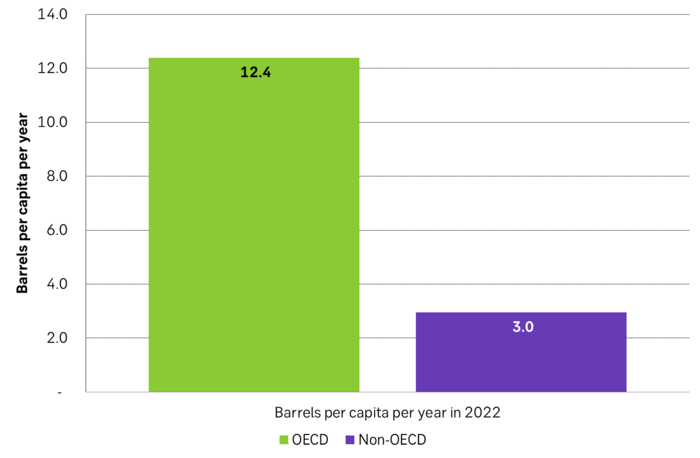
Is global oil demand about to peak 2: Oil demand per capita per year
Some rebound but not much. Brent crude rebounded 1.5% yesterday to $65.47/b. This morning it is inching 0.2% up to $65.6/b. The lowest close last week was on Thursday at $64.11/b.

The curve structure is almost as week as it was before the weekend. The rebound we now have gotten post the message from OPEC+ over the weekend is to a large degree a rebound along the curve rather than much strengthening at the front-end of the curve. That part of the curve structure is almost as weak as it was last Thursday.
We are still on a weakening path. The message from OPEC+ over the weekend was we are still on a weakening path with rising supply from the group. It is just not as rapidly weakening as was feared ahead of the weekend when a quota hike of 500 kb/d/mth for November was discussed.
The Brent curve is on its way to full contango with Brent dipping into the $50ies/b. Thus the ongoing weakening we have had in the crude curve since the start of the year, and especially since early June, will continue until the Brent crude oil forward curve is in full contango along with visibly rising US and OECD oil inventories. The front-month Brent contract will then flip down towards the $60/b-line and below into the $50ies/b.
At what point will OPEC+ turn to cuts? The big question then becomes: When will OPEC+ turn around to make some cuts? At what (price) point will they choose to stabilize the market? Because for sure they will. Higher oil inventories, some more shedding of drilling rigs in US shale and Brent into the 50ies somewhere is probably where the group will step in.
There is nothing we have seen from the group so far which indicates that they will close their eyes, let the world drown in oil and the oil price crash to $40/b or below.
The message from OPEC+ is also about balance and stability. The world won’t drown in oil in 2026. The message from the group as far as we manage to interpret it is twofold: 1) Taking back market share which requires a lower price for non-OPEC+ to back off a bit, and 2) Oil market stability and balance. It is not just about 1. Thus fretting about how we are all going to drown in oil in 2026 is totally off the mark by just focusing on point 1.
When to buy cal 2026? Before Christmas when Brent hits $55/b and before OPEC+ holds its last meeting of the year which is likely to be in early December.
Brent crude oil prices have rebounded a bit along the forward curve. Not much strengthening in the structure of the curve. The front-end backwardation is not much stronger today than on its weakest level so far this year which was on Thursday last week.

The front-end backwardation fell to its weakest level so far this year on Thursday last week. A slight pickup yesterday and today, but still very close to the weakest year to date. More oil from OPEC+ in the coming months and softer demand and rising inventories. We are heading for yet softer levels.

Down to the lowest since early May. Brent crude has fallen sharply the latest four days. It closed at USD 64.11/b yesterday which is the lowest since early May. It is staging a 1.3% rebound this morning along with gains in both equities and industrial metals with an added touch of support from a softer USD on top.
What stands out the most to us this week is the collapse in the Dubai one to three months time-spread.
Dubai is medium sour crude. OPEC+ is in general medium sour crude production. Asian refineries are predominantly designed to process medium sour crude. So Dubai is the real measure of the balance between OPEC+ holding back or not versus Asian oil demand for consumption and stock building.
A sharp weakening of the front-end of the Dubai curve. The front-end of the Dubai crude curve has been holding out very solidly throughout this summer while the front-end of the Brent and WTI curves have been steadily softening. But the strength in the Dubai curve in our view was carrying the crude oil market in general. A source of strength in the crude oil market. The core of the strength.
The now finally sharp decline of the front-end of the Dubai crude curve is thus a strong shift. Weakness in the Dubai crude marker is weakness in the core of the oil market. The core which has helped to hold the oil market elevated.
Facts supports the weakening. Add in facts of Iraq lifting production from Kurdistan through Turkey. Saudi Arabia lifting production to 10 mb/d in September (normal production level) and lifting exports as well as domestic demand for oil for power for air con is fading along with summer heat. Add also in counter seasonal rise in US crude and product stocks last week. US oil stocks usually decline by 1.3 mb/week this time of year. Last week they instead rose 6.4 mb/week (+7.2 mb if including SPR). Total US commercial oil stocks are now only 2.1 mb below the 2015-19 seasonal average. US oil stocks normally decline from now to Christmas. If they instead continue to rise, then it will be strongly counter seasonal rise and will create a very strong bearish pressure on oil prices.
Will OPEC+ lift its voluntary quotas by zero, 137 kb/d, 500 kb/d or 1.5 mb/d? On Sunday of course OPEC+ will decide on how much to unwind of the remaining 1.5 mb/d of voluntary quotas for November. Will it be 137 kb/d yet again as for October? Will it be 500 kb/d as was talked about earlier this week? Or will it be a full unwind in one go of 1.5 mb/d? We think most likely now it will be at least 500 kb/d and possibly a full unwind. We discussed this in a not earlier this week: ”500 kb/d of voluntary quotas in October. But a full unwind of 1.5 mb/d”
The strength in the front-end of the Dubai curve held out through summer while Brent and WTI curve structures weakened steadily. That core strength helped to keep flat crude oil prices elevated close to the 70-line. Now also the Dubai curve has given in.

Brent crude oil forward curves

Total US commercial stocks now close to normal. Counter seasonal rise last week. Rest of year?

Total US crude and product stocks on a steady trend higher.

Analys
OPEC+ will likely unwind 500 kb/d of voluntary quotas in October. But a full unwind of 1.5 mb/d in one go could be in the cards
Down to mid-60ies as Iraq lifts production while Saudi may be tired of voluntary cut frugality. The Brent December contract dropped 1.6% yesterday to USD 66.03/b. This morning it is down another 0.3% to USD 65.8/b. The drop in the price came on the back of the combined news that Iraq has resumed 190 kb/d of production in Kurdistan with exports through Turkey while OPEC+ delegates send signals that the group will unwind the remaining 1.65 mb/d (less the 137 kb/d in October) of voluntary cuts at a pace of 500 kb/d per month pace.
Signals of accelerated unwind and Iraqi increase may be connected. Russia, Kazakhstan and Iraq were main offenders versus the voluntary quotas they had agreed to follow. Russia had a production ’debt’ (cumulative overproduction versus quota) of close to 90 mb in March this year while Kazakhstan had a ’debt’ of about 60 mb and the same for Iraq. This apparently made Saudi Arabia angry this spring. Why should Saudi Arabia hold back if the other voluntary cutters were just freeriding? Thus the sudden rapid unwinding of voluntary cuts. That is at least one angle of explanations for the accelerated unwinding.
If the offenders with production debts then refrained from lifting production as the voluntary cuts were rapidly unwinded, then they could ’pay back’ their ’debts’ as they would under-produce versus the new and steadily higher quotas.
Forget about Kazakhstan. Its production was just too far above the quotas with no hope that the country would hold back production due to cross-ownership of oil assets by international oil companies. But Russia and Iraq should be able to do it.
Iraqi cumulative overproduction versus quotas could reach 85-90 mb in October. Iraq has however steadily continued to overproduce by 3-5 mb per month. In July its new and gradually higher quota came close to equal with a cumulative overproduction of only 0.6 mb that month. In August again however its production had an overshoot of 100 kb/d or 3.1 mb for the month. Its cumulative production debt had then risen to close to 80 mb. We don’t know for September yet. But looking at October we now know that its production will likely average close to 4.5 mb/d due to the revival of 190 kb/d of production in Kurdistan. Its quota however will only be 4.24 mb/d. Its overproduction in October will thus likely be around 250 kb/d above its quota with its production debt rising another 7-8 mb to a total of close to 90 mb.
Again, why should Saudi Arabia be frugal while Iraq is freeriding. Better to get rid of the voluntary quotas as quickly as possible and then start all over with clean sheets.
Unwinding the remaining 1.513 mb/d in one go in October? If OPEC+ unwinds the remaining 1.513 mb/d of voluntary cuts in one big go in October, then Iraq’s quota will be around 4.4 mb/d for October versus its likely production of close to 4.5 mb/d for the coming month..
OPEC+ should thus unwind the remaining 1.513 mb/d (1.65 – 0.137 mb/d) in one go for October in order for the quota of Iraq to be able to keep track with Iraq’s actual production increase.
October 5 will show how it plays out. But a quota unwind of at least 500 kb/d for Oct seems likely. An overall increase of at least 500 kb/d in the voluntary quota for October looks likely. But it could be the whole 1.513 mb/d in one go. If the increase in the quota is ’only’ 500 kb/d then Iraqi cumulative production will still rise by 5.7 mb to a total of 85 mb in October.
Iraqi production debt versus quotas will likely rise by 5.7 mb in October if OPEC+ only lifts the overall quota by 500 kb/d in October. Here assuming historical production debt did not rise in September. That Iraq lifts its production by 190 kb/d in October to 4.47 mb/d (August level + 190 kb/d) and that OPEC+ unwinds 500 kb/d of the remining quotas in October when they decide on this on 5 October.


Teck Resources kan förse Nordamerika och kanske hela G7 med all germanium som behövs

Leading Edge Materials är på rätt plats i rätt tid

Oljepriset faller efter ny handelskonflikt mellan USA och Kina

Christian Kopfer kommenterar guld, koppar, olja och stål, samt några råvarubolag

Silver spränger den magiska gränsen, kostar nu över 50 USD per uns

Aktier i guldbolag laggar priset på guld

Kinas elproduktion slog nytt rekord i augusti, vilket även kolkraft gjorde

Tyskland har så höga elpriser att företag inte har råd att använda elektricitet

Det stigande guldpriset en utmaning för smyckesköpare

Ett samtal om guld, olja, fjärrvärme och förnybar energi
-
 Nyheter4 veckor sedan
Aktier i guldbolag laggar priset på guld
-
 Nyheter4 veckor sedan
Kinas elproduktion slog nytt rekord i augusti, vilket även kolkraft gjorde
-
Nyheter4 veckor sedan
Tyskland har så höga elpriser att företag inte har råd att använda elektricitet
-
 Nyheter4 veckor sedan
Det stigande guldpriset en utmaning för smyckesköpare
-
 Nyheter3 veckor sedan
Ett samtal om guld, olja, fjärrvärme och förnybar energi
-

 Nyheter2 veckor sedan
OPEC+ missar produktionsmål, stöder oljepriserna
-
Analys4 veckor sedan
Brent crude ticks higher on tension, but market structure stays soft
-
Analys3 veckor sedan
Are Ukraine’s attacks on Russian energy infrastructure working?