

Analys
Tariffs deepen economic concerns – significantly weighing on crude oil prices

Brent crude prices initially maintained the gains from late March and traded sideways during the first two trading days in April. Yesterday evening, the price even reached its highest point since mid-February, touching USD 75.5 per barrel.

However, after the U.S. president addressed the public and unveiled his new package of individual tariffs, the market reacted accordingly. Overnight, Brent crude dropped by close to USD 4 per barrel, now trading at USD 71.6 per barrel.
Key takeaways from the speech include a baseline tariff rate of 10% for all countries. Additionally, individual reciprocal tariffs will be imposed on countries with which the U.S. has the largest trade deficits. Many Asian economies end up at the higher end of the scale, with China facing a significant 54% tariff. In contrast, many North and South American countries are at the lower end, with a 10% tariff rate. The EU stands at 20%, which, while not unexpected given earlier signals, is still disappointing, especially after Trump’s previous suggestion that there might be some easing.
Once again, Trump has followed through on his promise, making it clear that he is serious about rebalancing the U.S. trade position with the world. While some negotiation may still occur, the primary objective is to achieve a more balanced trade environment. A weaker U.S. dollar is likely to be an integral part of this solution.
Yet, as the flow of physical goods to the U.S. declines, the natural question arises: where will these goods go? The EU may be forced to raise tariffs on China, mirroring U.S. actions to protect its industries from an influx of discounted Chinese goods.
Initially, we will observe the effects in soft economic data, such as sentiment indices reflecting investor, industry, and consumer confidence, followed by drops in equity markets and, very likely, declining oil prices. This will eventually be followed by more tangible data showing reductions in employment, spending, investments, and overall economic activity.
Ref oil prices moving forward, we have recently adjusted our Brent crude price forecast. The widespread imposition of strict tariffs is expected to foster fears of an economic slowdown, potentially reducing oil demand. Macroeconomic uncertainty, particularly regarding tariffs, warrants caution regarding the pace of demand growth. Our updated forecast of USD 70 per barrel for 2025 and 2026, and USD 75 per barrel for 2027, reflects a more conservative outlook, influenced by stronger-than-expected U.S. supply, a more politically influenced OPEC+, and an increased focus on fragile demand.
___
US DOE data:
Last week, U.S. crude oil refinery inputs averaged 15.6 million barrels per day, a decrease of 192 thousand barrels per day from the previous week. Refineries operated at 86.0% of their total operable capacity during this period. Gasoline production increased slightly, averaging 9.3 million barrels per day, while distillate (diesel) production also rose, averaging 4.7 million barrels per day.
U.S. crude oil imports averaged 6.5 million barrels per day, up by 271 thousand barrels per day from the prior week. Over the past four weeks, imports averaged 5.9 million barrels per day, reflecting a 6.3% year-on-year decline compared to the same period last year.
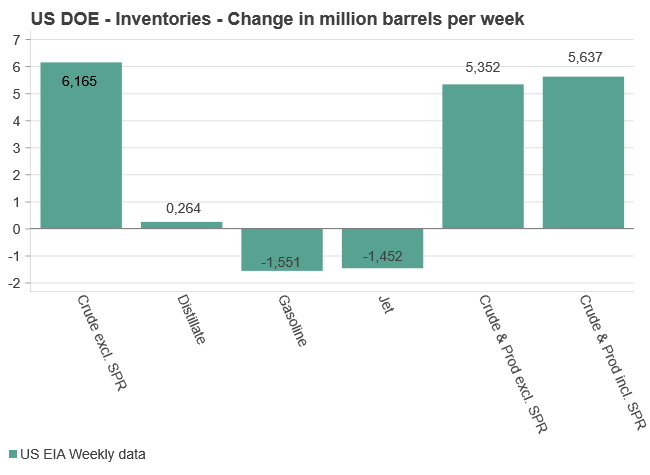
The focus remains on U.S. crude and product inventories, which continue to impact short-term price dynamics in both WTI and Brent crude. Total commercial petroleum inventories (excl. SPR) increased by 5.4 million barrels, a modest build, yet insufficient to trigger significant price movements.
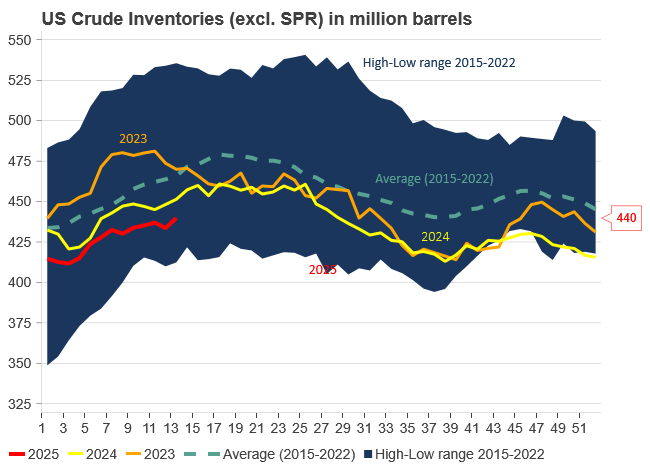
Commercial crude oil inventories (excl. SPR) rose by 6.2 million barrels, in line with the 6-million-barrel build forecasted by the API. With this latest increase, U.S. crude oil inventories now stand at 439.8 million barrels, which is 4% below the five-year average for this time of year.
Gasoline inventories decreased by 1.6 million barrels, exactly matching the API’s reported decline of 1.6 million barrels. Diesel inventories rose by 0.3 million barrels, which is close to the API’s forecast of an 11-thousand-barrel decrease. Diesel inventories are currently 6% below the five-year average.
Over the past four weeks, total products supplied, a proxy for U.S. demand, averaged 20.1 million barrels per day, a 1.2% decrease compared to the same period last year. Gasoline supplied averaged 8.8 million barrels per day, down 1.9% year-on-year. Diesel supplied averaged 3.8 million barrels per day, marking a 3.7% increase from the same period last year. Jet fuel demand also showed strength, rising 4.2% over the same four-week period.

Brent crude prices have lost the positive momentum seen from Monday evening through midday yesterday. The price initially bottomed out at USD 65.7 per barrel on Monday afternoon, before climbing steadily by USD 3 to USD 68.7 on Wednesday morning. However, that upward momentum quickly reversed course. Brent tumbled nearly USD 3.4, hitting a weekly low of USD 65.3 per barrel before recovering some losses. As of this morning, it trades at USD 66.6 – a reflection of continued and substantial volatility.
Market fundamentals have largely remained in the background, with tariff rhetoric still dominating headlines. However, yesterday’s drop was clearly driven by the supply side of the equation, after reports emerged that several OPEC+ members are pushing for an accelerated oil output increase in June.
The timing of this move – amid global trade uncertainty and softening demand – may seem counterintuitive. But internal rifts within OPEC+ appear to be taking precedence. In May, Saudi Arabia already surprised the market with an output hike aimed at disciplining quota violators. That move failed to restrict Kazakhstan, the group’s largest overproducer, and has now triggered discussions of yet another sizeable production boost in June.
A later statement from Kazakhstan’s energy ministry, pledging renewed compliance, may have helped lift crude prices slightly this morning.
The next OPEC+ meeting is set for May 5, with the proposed June output hike expected to top the agenda. The group will likely choose between a scheduled, incremental increase of 138,000 barrels per day, or a more aggressive jump of 411,000 barrels per day – equivalent to ish three months’ worth of increases rolled into one. The latter scenario would put downward pressure on oil prices and highlight deepening tensions within OPEC+, while also exacerbating concerns in a market already clouded by weak demand expectations.
Although the final decision on volumes remains unclear, OPEC+ has demonstrated it still has pricing power, and that it can pull prices lower quickly if it chooses to do so.
________
US DOE DATA
U.S. refinery activity picked up in the week ending April 18, with crude inputs rising by 326,000 barrels per day to a total of 15.9 million. Utilization rates also climbed to 88.1%. Gasoline output strengthened to 10.1 million barrels per day, while distillate fuel production edged lower to 4.6 million.
Crude imports declined by 412,000 barrels per day to 5.6 million last week. Over the past month, import volumes have averaged 6.1 million barrels per day – down 6.8% compared to the same period a year ago. Gasoline and distillate imports came in at 858,000 and 97,000 barrels per day, respectively.
Inventories were mixed. Crude oil inventories (excl. SPR) rose slightly by 0.2 million barrels to 443.1 million, still 5% below the five-year average. Gasoline inventories posted a sharp draw of 4.5 million barrels and are now 3% under seasonal norms. Diesel inventories dropped by 2.4 million barrels, leaving levels 13% below the five-year average. Propane inventories rose by 2.3 million but remained 7% under typical levels. Total commercial petroleum inventories saw a net decline of 0.7 million barrels on the week.
Product demand was generally stable. Total products supplied averaged 19.9 million barrels per day over the last four weeks, up 0.4% year-on-year. Gasoline demand slipped by 0.4%, while distillates and jet fuel rose sharply, by 12.8% and 13.8%, respectively.


Brent carried higher by relief rally across markets as Trump backs away from sacking Powel. Brent crude rose 1.8% ydy to USD 67.44/b with an intraday high of USD 68.04/b. The gain was driven by a relief rally across markets as it became clear that Trump would not try to force out Powel from his role as chair of the US Fed. US equities rallied more than 2.5% as a result and pulled oil along upwards in relief. The gains continue this morning both in equities and oil with the latter up 1.2% to USD 68.25/b.

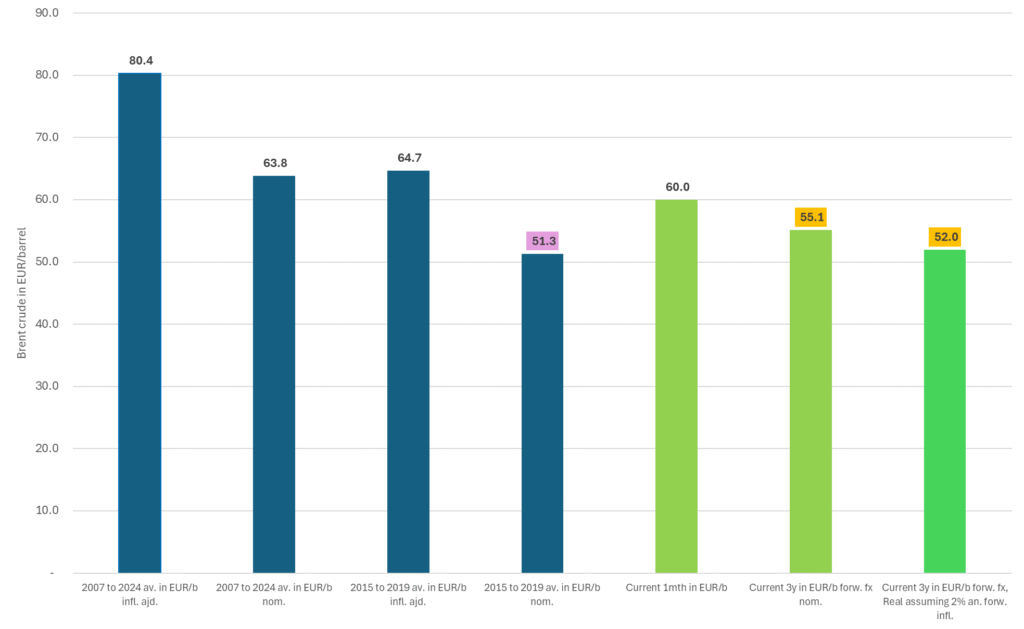
Forward oil in euro looks very appealing for consumers. Even after recent oil price gains. A weaker USD and a lower oil price at the same time recently has strongly lifted the appeal for oil purchases by non-US denominated oil consumers. The euro has rallied against the USD. On Monday Brent closed at EUR 57.57/b while the 3yr forward Brent price closed at a nominal EUR 53.95/b when the forward fx rate is applied. But this is nominal three years forward basis. If we also assume that Eurozone inflation will average 2% pa. for the next three years, then the real forward euro price for oil is even lower. The price for Brent crude today is EUR 60.1/b for the front-month while the 36mth contract is EUR 55.1/b when the forward eurusd rate of 1.2 is applied. If we also assume a 2% annual inflation for three years then the real forward price is only EUR 51.9/b. Compare this to the average nominal price of Brent crude from 2015 to 2019, the shale oil boom-years, when Brent crude only averaged USD 58.5/b and EUR 51.3/b. This period was the tragic oil-years when US shale oil companies were chasing volumes rather than profits with many of them going bankrupt as a result. Even after the recent rally in Brent crude oil prices, the forward 36mth price in EUR is still relatively cheap in historical terms and especially so when the 36mth real forward price is taken into account.
The 36mth real forward price for Brent crude in EUR/b is almost down to the ”valley of death” period from 2015 to 2019 when Brent crude nominally averaged USD 58.5/b and EUR 51.3/b. That was the period when US shale oil producers aimed for volume over profits which led many of them to bankruptcy.
Brent crude ticks higher along with positive equity markets. Brent crude has been gradually ticking higher since its recent low close of USD 62.82/b on 8 April. Though 9 April was rather extreme with an intraday low of USD 58.4/b and a close the same day of USD 66.02/b. Brent is rising 1.4% this morning to USD 67.2/b along with higher equity markets in China and US equity futures (+1%). The daily fluctuations in Brent crude oil prices have been quite well aligned with fluctuations in equity prices which again are driven predominantly by the varying perceptions of how the US trade war with the world will progress and what the fallout will be.
Will Trump stay the course through economic pain or not? Will Donald Trump continue head-on, or will he pull back as pain emerges? It is clear that economic pain and damage will follow from what Donald Trump has done so far. That is already priced in. The big question though is whether he will stubbornly carry on or not. This looks like a ”game of chicken” where the question is who will blink first. Donald Trump or Xi Jinping? Will Donald Trump back off as US consumer-pain rockets and US economic activity falters or will he stay the course? Markets are highly conflicted on this as Trump has been extremely mercurial before and can suddenly change course. If he chooses to stay the course, without flinching, then obviously there is more downside to come. The current impression is that Trump is aiming for major changes and is willing to endure pain to achieve them.
Brent crude has taken direction from equity markets (here the US Russel 2000 index in orange) as it is a barometer of how bad the fallout from the tariffs will be on global growth and oil demand growth. The Russel 2000 is as of yesterday.

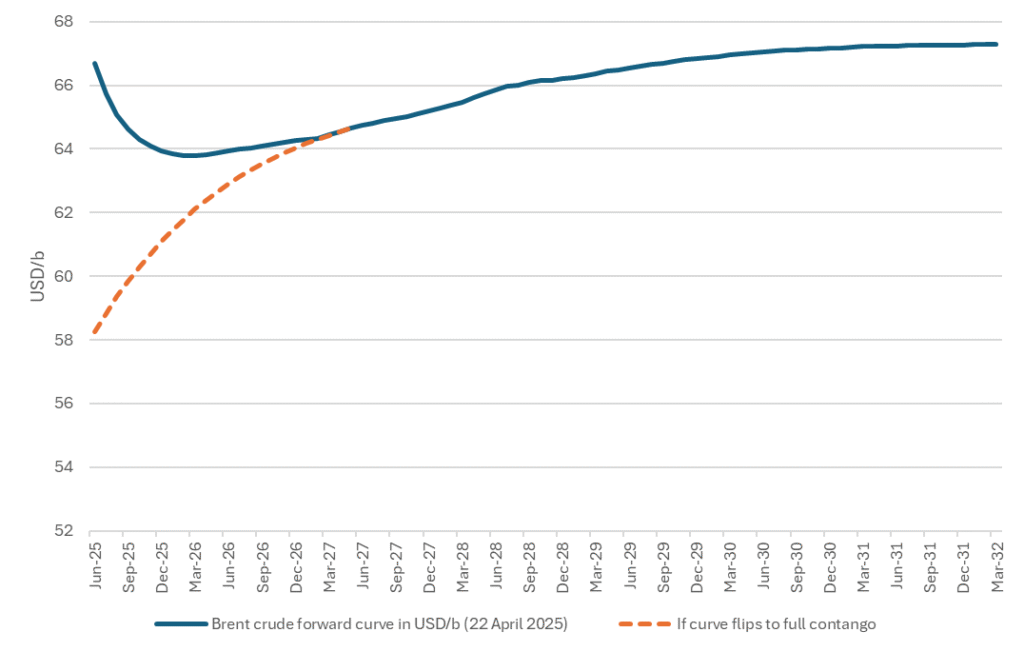
The Brent crude forward curve is pricing tightness and surplus at the same time. The Brent crude forward curve is currently pricing two things at the same time:
1) Supply/Demand is tight here and now (front-end backwardation)
2) But also, that surplus is coming (contango further out)
If the market is right, i.e. that surplus is coming, that Donald will continue head on with what he is doing, then the forward Brent curve will likely shift to full contango with the front-end of the Brent crude oil curve dipping into the 50ies. The big question is of course whether Donald Trump will carry head on without flinching or not. Staying the course through the coming economic pain.
Current Brent crude oil forward curve and how it could shift to full contango if the market shifts to surplus and stock building.


OPEC+ tensions resurface: Brent slides to $66.6

Mjölkpriset har gått upp 80 procent på fem år – nu mår bönderna bra
Nam, nam, nam. Give me more 36mth forward Brent crude in EUR/barrel
Crude oil comment: The forward curve is pricing tightness today and surplus tomorrow

Den viktiga råvaruvalutan USD faller kraftigt

Tysklands SEFE skriver avtal om att köpa 1,5 miljarder ton LNG per år från Delfin i USA

Danska Seaborg Technologies siktar på serieproduktion av smältsaltsreaktorer till mitten av 2030-talet
Brent Edges Lower After Resisting Equity Slump – Sanctions, Saudi Pricing in Focus

Oljepriserna slaktas på samtidiga negativa faktorer

Guld kostar över 3100 USD per uns och 1 miljoner kronor per kilo
-
 Nyheter4 veckor sedan
Tysklands SEFE skriver avtal om att köpa 1,5 miljarder ton LNG per år från Delfin i USA
-
 Nyheter3 veckor sedan
Danska Seaborg Technologies siktar på serieproduktion av smältsaltsreaktorer till mitten av 2030-talet
-
Analys4 veckor sedan
Brent Edges Lower After Resisting Equity Slump – Sanctions, Saudi Pricing in Focus
-
 Nyheter3 veckor sedan
Oljepriserna slaktas på samtidiga negativa faktorer
-
 Nyheter3 veckor sedan
Guld kostar över 3100 USD per uns och 1 miljoner kronor per kilo
-
 Nyheter2 veckor sedan
Två samtal om det aktuella läget på råvarumarknaden
-
Analys4 veckor sedan
Crude inventories fall, but less than API signal
-
Analys3 veckor sedan
Lowest since Dec 2021. Kazakhstan likely reason for OPEC+ surprise hike in May