

Analys
Stronger inventory build than consensus, diesel demand notable

Yesterday’s US DOE report revealed an increase of 4.6 million barrels in US crude oil inventories for the week ending February 14. This build was slightly higher than the API’s forecast of +3.3 million barrels and compared with a consensus estimate of +3.5 million barrels. As of this week, total US crude inventories stand at 432.5 million barrels – ish 3% below the five-year average for this time of year.

In addition, gasoline inventories saw a slight decrease of 0.2 million barrels, now about 1% below the five-year average. Diesel inventories decreased by 2.1 million barrels, marking a 12% drop from the five-year average for this period.
Refinery utilization averaged 84.9% of operable capacity, a slight decrease from the previous week. Refinery inputs averaged 15.4 million barrels per day, down by 15 thousand barrels per day from the prior week. Gasoline production decreased to an average of 9.2 million barrels per day, while diesel production increased to 4.7 million barrels per day.
Total products supplied (implied demand) over the last four-week period averaged 20.4 million barrels per day, reflecting a 3.7% increase compared to the same period in 2024. Specifically, motor gasoline demand averaged 8.4 million barrels per day, up by 0.4% year-on-year, and diesel demand averaged 4.3 million barrels per day, showing a strong 14.2% increase compared to last year. Jet fuel demand also rose by 4.3% compared to the same period in 2024.

Strong rebound yesterday with further gains today. Brent crude rallied 3.2% with a close of USD 62.15/b yesterday and a high of the day of USD 62.8/b. This morning it is gaining another 0.9% to USD 62.7/b with signs that US and China may move towards trade talks.

Brent went lower on 9 April than on Monday. Looking back at the latest trough on Monday it traded to an intraday low of USD 58.5/b. In comparison it traded to an intraday low of USD 58.4/b on 9 April. While markets were in shock following 2 April (’Liberation Day’) one should think that the announcement from OPEC+ this weekend of a production increase of some 400 kb/d also in June would have chilled the oil market even more. But no.
’ Technically overbought’ may be the explanation. ’Technically overbought’ has been the main explanation for the rebound since Monday. Maybe so. But the fact that it went lower on 9 April than on Monday this week must imply that markets aren’t totally clear over what OPEC+ is currently doing and is planning to do. Is it the start of a flood or a brief period where disorderly members need to be whipped into line?
The official message is that this is punishment versus quota cheaters Iraq, UAE and Kazakhstan. Makes a lot of sense since it is hard to play as a team if the team strategy is not followed by all players. If the May and June hikes is punishment to force the cheaters into line, then there is very real possibility that they actually will fall in line. And voila. The May and June 4x jumps is what we got and then we are back to increases of 137 kb/d per month. Or we could even see a period with no increase at all or even reversals and cuts.
OPEC+ has after all not officially abandoned cooperation. It has not abandoned quotas. It is still an overall orderly agenda and message to the market. This isn’t like 2014/15 with ’no quotas’. Or like full throttle in spring 2020. The latter was resolved very quickly along with producer pain from very low prices. It is quite clear that Saudi Arabia was very angry with the quota cheaters when the production for May was discussed at the end of March. And that led to the 4x hike in May. And the same again this weekend as quota offenders couldn’t prove good behavior in April. But if the offenders now prove good behavior in May, then the message for July production could prove a very different message than the 4x for May and June.
Trade talk hopes, declining US crude stocks, backwardated Brent curve and shale oil pain lifts price. If so, then we are left with the risk for a US tariff war induced global recession. And with some glimmers of hope now that US and China will start to talk trade, we see Brent crude lifting higher today. Add in that US crude stocks indicatively fell 4.5 mb last week (actual data later today), that the Brent crude forward curve is still in front-end backwardation (no surplus quite yet) and that US shale oil production is starting to show signs of pain with cuts to capex spending and lowering of production estimates.
Rebounding from the sub-60-line for a second time. Following a low of USD 59.3/b, the Brent July contract rebounded and closed up 1.8% at USD 62.13/b. This was the second test of the 60-line with the previous on 9 April when it traded to a low of USD 58.4/b. But yet again it defied a close below the 60-line. US ISM Manufacturing fell to 48.7 in April from 49 in March. It was still better than the feared 47.9 consensus. Other oil supportive elements for oil yesterday were signs that there are movements towards tariff negotiations between the US and China, US crude oil production in February was down 279 kb/d versus December and that production by OPEC+ was down 200 kb/d in April rather than up as expected by the market and planned by the group.
All eyes on OPEC+ when they meet on Monday 5 May. What will they decide to do in June? Production declined by 200 kb/d in April (to 27.24 mb/d) rather than rising as the group had signaled and the market had expected. Half of it was Venezuela where Chevron reduced activity due to US sanctions. Report by Bloomberg here. Saudi Arabia added only 20 kb/d in April. The plan is for the group to lift production by 411 kb/d in May which is close to 3 times the monthly planned increases. But the actual increase will be much smaller if the previous quota offenders, Kazakhstan, Iraq and UAE restrain their production to compensate for previous offences.
The limited production increase from Saudi Arabia is confusing as it gives a flavor that the country deliberately aimed to support the price rather than to revive the planned supply. Recent statements from Saudi officials that the country is ready and able to sustain lower prices for an extended period instead is a message that reviving supply has priority versus the price.
OPEC+ will meet on Monday 5 May to decide what to do with production in June. The general expectation is that the group will lift quotas according to plans with 137 kb/d. But recent developments add a lot of uncertainty to what they will decide. Another triple quota increase as in May or none at all. Most likely they will stick to the original plan and decide lift by 137 kb/d in June.
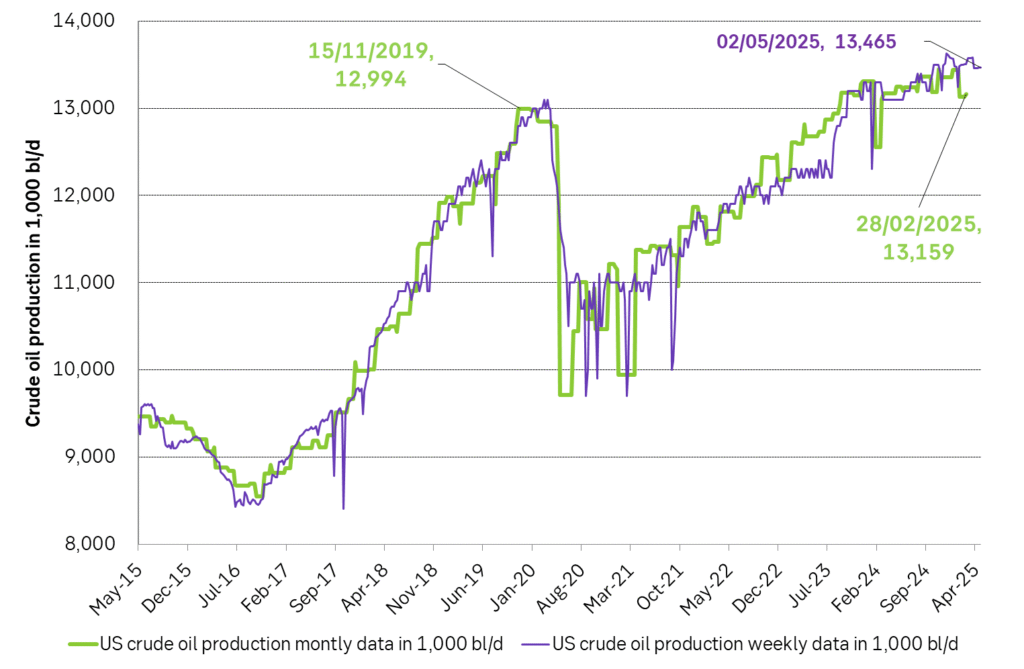
US production surprised on the downside in February. Are prices starting to bite? US crude oil production fell sharply in January, but that is often quite normal due to winter hampering production. What was more surprising was that production only revived by 29 kb/d from January to February. Weekly data which are much more unreliable and approximate have indicated that production rebounded to 13.44 mb/d after the dip in January. The official February production of 13.159 mb/d is only 165 kb/d higher than the previous peak from November/December 2019. The US oil drilling rig count has however not change much since July last year and has been steady around 480 rigs in operation. Our bet is that the weaker than expected US production in February is mostly linked to weather and that it will converge to the weekly data in March and April.
Where is the new US shale oil price pain point? At USD 50/b or USD 65/b? The WTI price is now at USD 59.2/b and the average 13 to 24 mth forward WTI price has averaged USD 61.1/b over the past 30 days. The US oil industry has said that the average cost break even in US shale oil has increased from previous USD 50/b to now USD 65/b with that there is no free cashflow today for reinvestments if the WTI oil price is USD 50/b. Estimates from BNEF are however that the cost-break-even for US shale oil is from USD 40/b to US 60/b with a volume weighted average of around USD 50/b. The proof will be in the pudding. I.e. we will just have to wait and see where the new US shale oil ”price pain point” really is. At what price will we start to see US shale oil rig count starting to decline. We have not seen any decline yet. But if the WTI price stays sub-60, we should start to see a decline in the US rig count.
US crude oil production. Monthly and weekly production in kb/d.
Brent crude falls with strong conviction that trade war will hurt demand for oil. Brent crude sold off 2.4% yesterday to USD 64.25/b along with rising concerns that the US trade war with China will soon start to visibly hurt oil demand or that it has already started to happen. Tariffs between the two are currently at 145% and 125% in the US and China respectively which implies a sharp decline in trade between the two if at all. This morning Brent crude (June contract) is trading down another 1.2% to USD 63.3/b. The June contract is rolling off today and a big question is how that will leave the shape of the Brent crude forward curve. Will the front-end backwardation in the curve evaporate further or will the July contract, now at USD 62.35/b, move up to where the June contract is today?
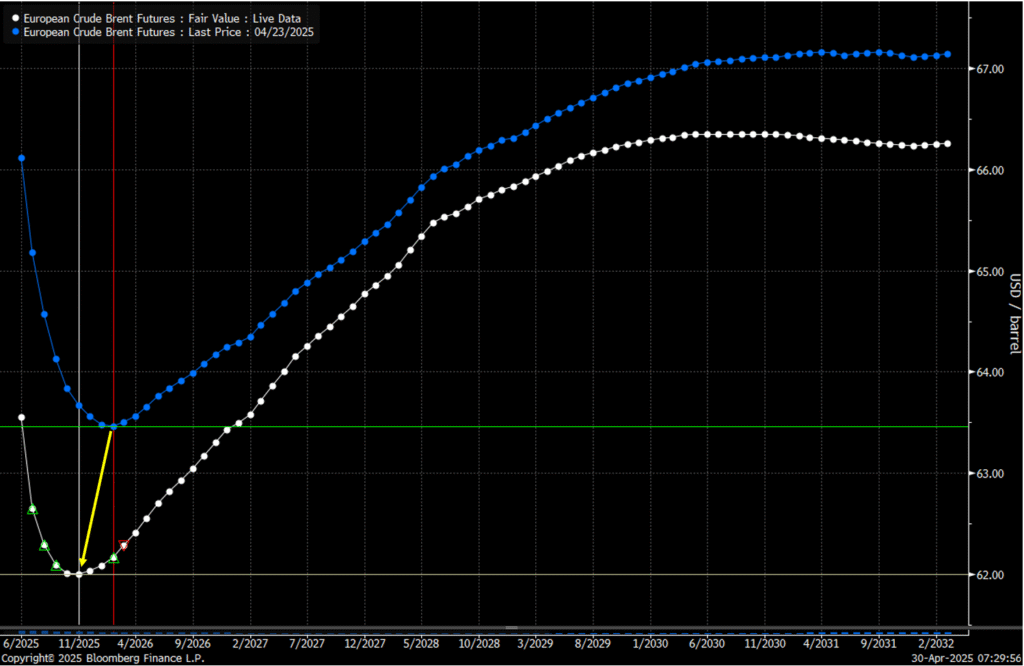
The unusual ”weird smile” of Brent forward curve implies unusual strong bearish conviction amid current prompt tightness. the The Brent crude oil forward curve has displayed a very unusual shape lately with front-end backwardation combined with deferred contango. Market pricing tightness today but weakness tomorrow. We have commented on this several times lately and Morgan Stanly highlighted how unusual historically this shape is. The reason why it is unusual is probably because markets in general have a hard time pricing a future which is very different from the present. Bearishness in the oil market when it is shifting from tight to soft balance usually comes creeping in at the front-end of the curve. A slight contango at the front-end in combination with an overall backwardated curve. Then this slight contango widens and in the end the whole curve flips to full contango. The current shape of the forward curve implies a very, very strong conviction by the market that softness and surplus is coming. A conviction so strong that it overrules the present tightness. This conviction flows from the fundamental understanding that ongoing trade war is bad for the global economy, for oil demand and for the oil price.
Will OPEC+ switch to cuts or will it leave balancing to a lower price driving US production lower? Add of course also in that OPEC+ has signaled that it will lift production more rapidly and is currently no longer in the mode of holding back to keep Brent at USD 75/b due to an internal quarrel over quotas. That stand can of course change from one day to the next. That is a very clear risk to the upside and oil consumers around should keep that in the back of their minds that this could happen. Though we are not utterly convinced of the imminent risk of this. Before such a pivot happens, Iraq and Kazakhstan probably have to prove that they can live up to their promised cuts. And that will take a few months. Also, OPEC+ might also like to see where the pain-point for US shale oil producers’ price-vise really is today. So far, we have seen no decline in the number of US oil drilling rigs in operation which have steadily been running at around 480 rigs.
With a surplus oil market on the horizon, OPEC+ will have to make a choice. How shale this coming surplus be resolved? Shall OPEC+ cut in order to balance the market or shall lower oil prices drive pain and lower production in the US which then will result in a balanced market? Maybe it is the first or maybe the latter. The group currently has a bloated surplus balance which it needs to slim down at some point. And maybe now is the time. Allowing the oil price to slide. Economic pain for US shale oil producers to rise and US oil production to fall in order to balance the market and make room OPEC+ to redeploy its previous cuts back into the market.
Surplus is not yet here. US oil inventories likely fell close to 2 mb last week. US API yesterday released indications that US crude and product inventories fell 1.8 mb last week with crude up 3.8 mb, gasoline down 3.1 mb and distillates down 2.5 mb. So, in terms of a crude oil contango market (= surplus and rising inventories) we have not yet moved to the point where US inventories are showing that the global oil market now indeed is in surplus. Though Chinese purchases to build stocks may have helped to keep the market tight. Indications that Saudi Arabia may lift June Official Selling Prices is a signal that the oil market may not be all that close to unraveling in surplus.
The low point of the Brent crude oil curve is shifting closer to present. A sign that the current front-end backwardation of the Brent crude oil curve is about to evaporate.
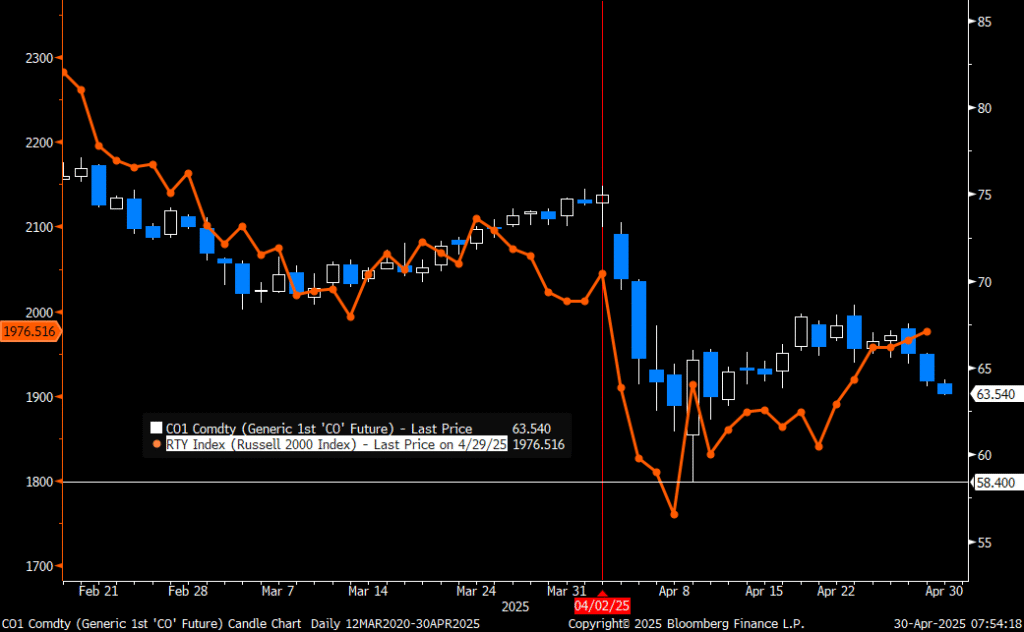
Brent crude versus US Russel 2000 equity index. Is the equity market too optimistic or the oil market too bearish?


Whipping quota cheaters into line is still the most likely explanation

Hur USA blev världens största exportör av propan

Utbudsunderskott och stigande industriell efterfrågan av silver på marknaden

Inflationsjusterat är olja nu billigare än på mitten av 1980-talet

Vad som händer med råvaror, dollar, olja, mjölk och koppar

Ingenting stoppar guldets uppgång, nu 3400 USD per uns
Crude oil comment: The forward curve is pricing tightness today and surplus tomorrow

Samtal om läget för guld, kobolt och sällsynta jordartsmetaller

Agnico Eagle siktar på toppen – två av världens största guldgruvor i sikte

Lägre elpriser och många minustimmar fram till midsommar
-
 Nyheter3 veckor sedan
Ingenting stoppar guldets uppgång, nu 3400 USD per uns
-
Analys2 veckor sedan
Crude oil comment: The forward curve is pricing tightness today and surplus tomorrow
-
 Nyheter2 veckor sedan
Samtal om läget för guld, kobolt och sällsynta jordartsmetaller
-
 Nyheter2 veckor sedan
Agnico Eagle siktar på toppen – två av världens största guldgruvor i sikte
-
 Nyheter1 vecka sedan
Lägre elpriser och många minustimmar fram till midsommar
-
 Nyheter3 veckor sedan
Kina slår nytt rekord i produktion av kol
-

 Nyheter1 vecka sedan
Saudiarabien informerar att man är ok med ett lägre oljepris
-

 Nyheter3 veckor sedan
Den viktiga råvaruvalutan USD faller kraftigt