

Analys
Silver outlook to Q4 2021: A year for the hybrid metal

Nitesh Shah, Director, Research, WisdomTree, provides his 2021 outlook for silver, including the potential drivers of performance and the continued recovery of industrial demand.

“After a slow start, silver outpaced gold and most industrial metals in 2020. Initially riding gold’s defensive coattails and then getting a tailwind from its industrial traits, silver was an outperformer, gaining 47% in 2020. That compares to gold (24%), copper (27%) and nickel (21%). Silver’s hybrid status served it well in 2020 and we expect more of the same in 2021. As we articulated in Gold outlook to Q4 2021: at the crossroads of hope and fear, we start 2021 with the hope that COVID-19 vaccines will offer a route out of the malaise that the pandemic has wreaked on the health of the human population and the economies that we operate in. However, as has been abundantly clear in December 2020, the path to the recovery is likely to have many bumps along the road. Silver, playing both a defensive and cyclical role could do very well this year.
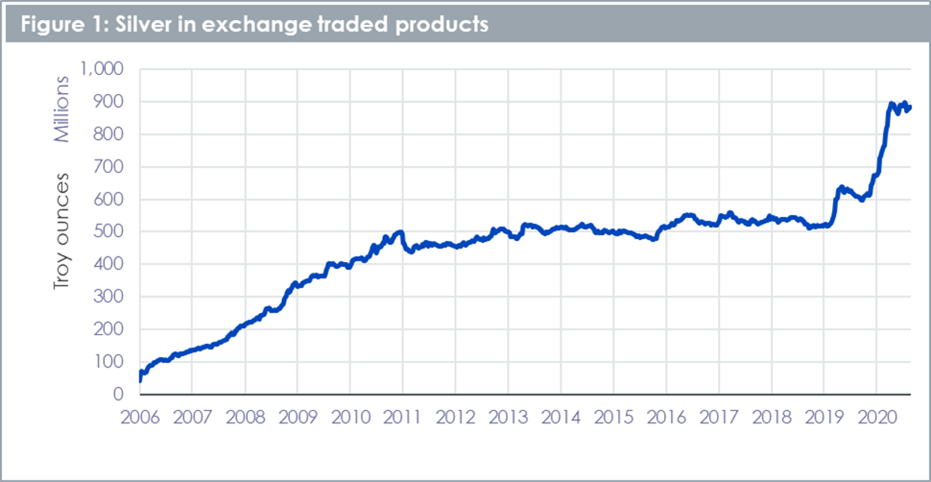
“Silver’s hybrid status has not gone unnoticed by investors. Silver held in exchange traded products (ETPs) rose to an all-time high in 2020 (Figure 1), and more remarkably at a pace never seen before. With 275mn ounces of silver added to silver exchange traded commodities in 2020, the year marks more than double the next highest year of silver ETP gains (2009 with 137mn ounces added). There was strong buying when silver was under-priced relative to gold in the first half of 2020. However, that buying slowed in the second half of the year as silver prices caught up with gold.
Framework
In “Gold and silver: similar, but different”, we argued that silver’s price performance is 80% correlated with gold. In our modelling framework, gold price is therefore the main driver of silver price. However, we also find the following variables as important drivers of silver price:
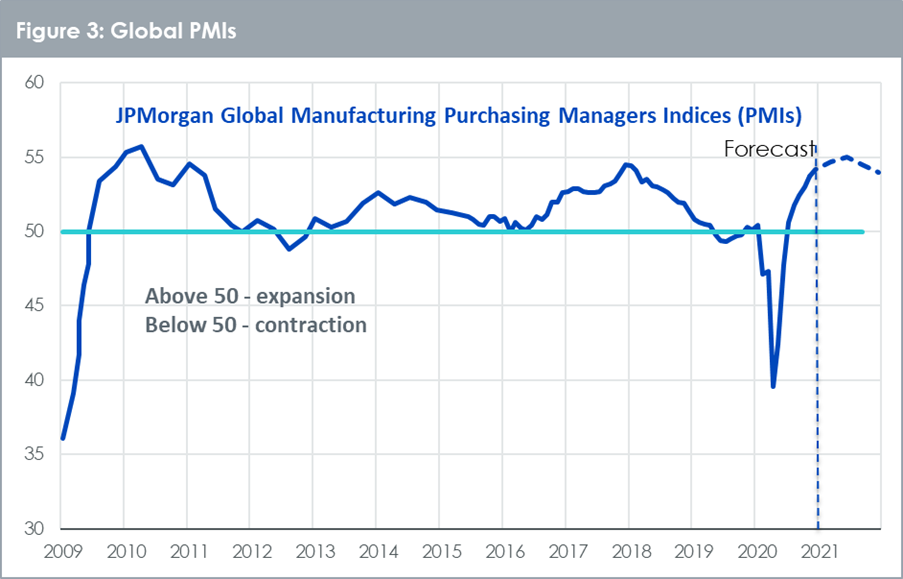
- Growth in manufacturing activity – more than 50% of silver’s use is in industrial applications (in contrast to gold where less than 10% comes from that sector). We use global manufacturing Purchasing Managers Index (PMI) as a proxy for industrial demand
- Growth in silver inventory – rising inventories signal greater availability of the metal and hence is price negative. We use futures market exchange inventory as a proxy
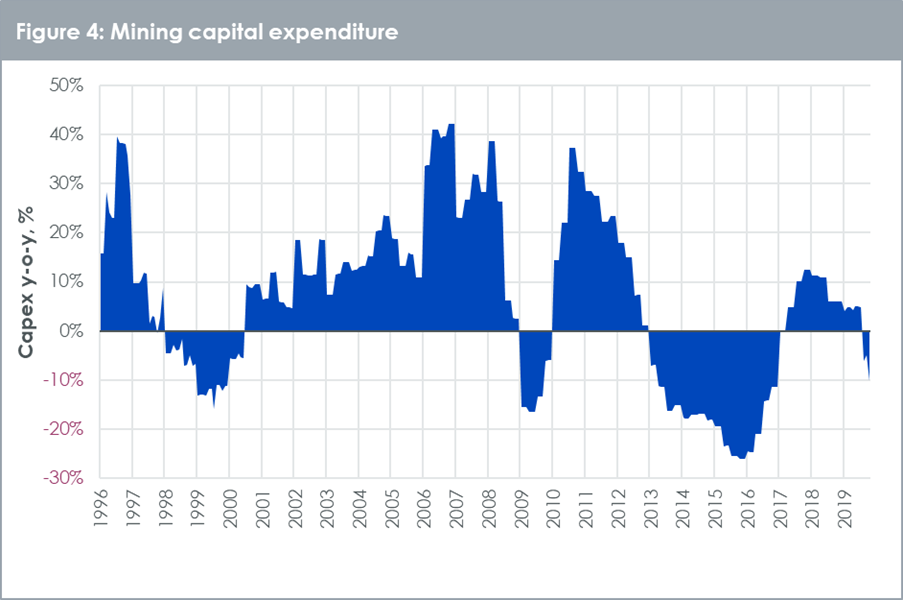
- Growth in mining capital investment (capex) – the more mines invest, the more potential supply we will see in the future. Thus, we take an 18-month lag on this variable. Given that most silver comes as a by-product of mining for other metals, we look at mining capex across the top 100 miners (not just monoline silver miners).
Gold outlook Q4 2021: at the crossroads of hope and fear
In Gold outlook to Q4 2021: at the crossroads of hope and fear we laid out our forecasts under three scenarios.
- Consensus – based on consensus forecasts for all the macroeconomic inputs and an assumption that investor sentiment towards gold remains flat at where it is today.
- Continued economic uncertainty – further monetary intervention, possibly through yield curve control – limits Treasury yields and the US dollar continues to weaken, while investor sentiment towards gold strengthens.
- Hawkish Fed – despite having adjusted its inflation target, the Federal Reserve (Fed) behaves hawkish and Treasury yields rise substantially, the US dollar appreciates back to where it was in June 2020 and inflation remains way below target. As US dollar debasement fears recede, positioning in gold futures declines.
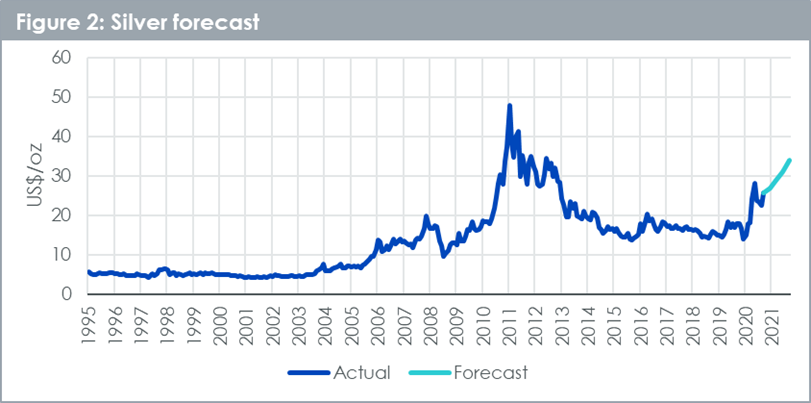
In our silver forecast, we focus on the ‘Continued economic uncertainty scenario’ where the gold price reaches US$2130/oz at the end of the forecast horizon.
Silver forecasts
“We believe in growth terms, silver could outpace gold, reaching US$34/oz in Q4 2021 (33.6% from today’s levels, versus 13.3% for gold. We explain the other drivers to this forecast below.
Industrial demand to continue to recover
“Manufacturing Purchasing Managers Indices (PMIs) have risen strongly in the past few months and are now in the expansionary post-50 region (Figure 3). Coming from a period of tight lockdowns, it’s unsurprising that the relative recovery from spring 2020 levels for the PMIs was strong as lockdown conditions eased. Renewed lockdowns could temporarily halt the improvement, but in general many businesses – with the support of a monetary and fiscal stimulus – will continue to see improvement. As with most historic recoveries, the pace of rebound is likely to slow in in the second half of the year. However, peaking at over 55, the PMIs indicate plenty of industrial demand for silver to be expected.
Mining supply could expand in 2021
“Our model approach uses the capital expenditure in mines as a proxy for future silver supply. While capital expenditure has declined in the past quarter (Figure 4), given the lag that we apply to this input, the rising capital expenditure we saw before that acts as a headwind for silver prices in our model approach.
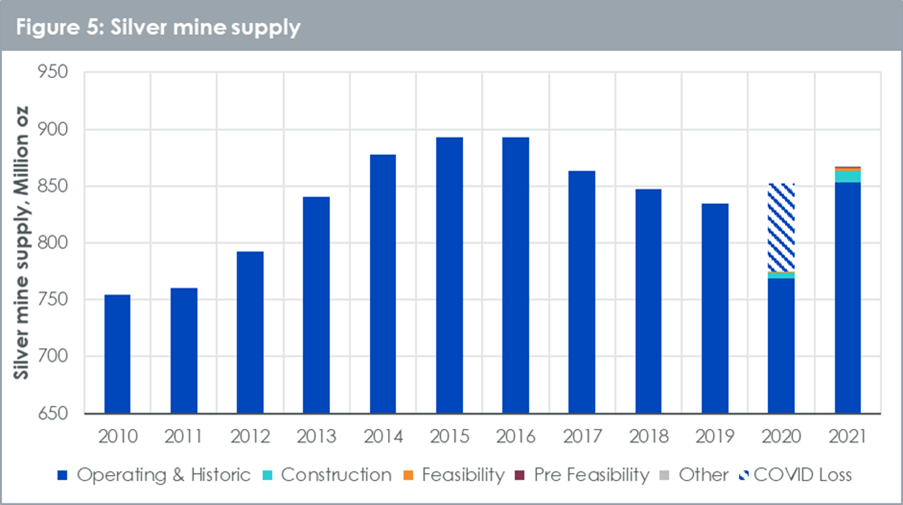
“We know that earlier in 2020 many mines were unable to operate at full capacity due to social distancing and therefore silver mine production has been lower than it would have otherwise been. Figure 5 shows how much these COVID-19 related losses were estimated to be by Metals Focus. Assuming we don’t see lockdowns reintroduced in 2021, we are very likely to see mine production of silver rebound.
Silver exchange inventory rising again
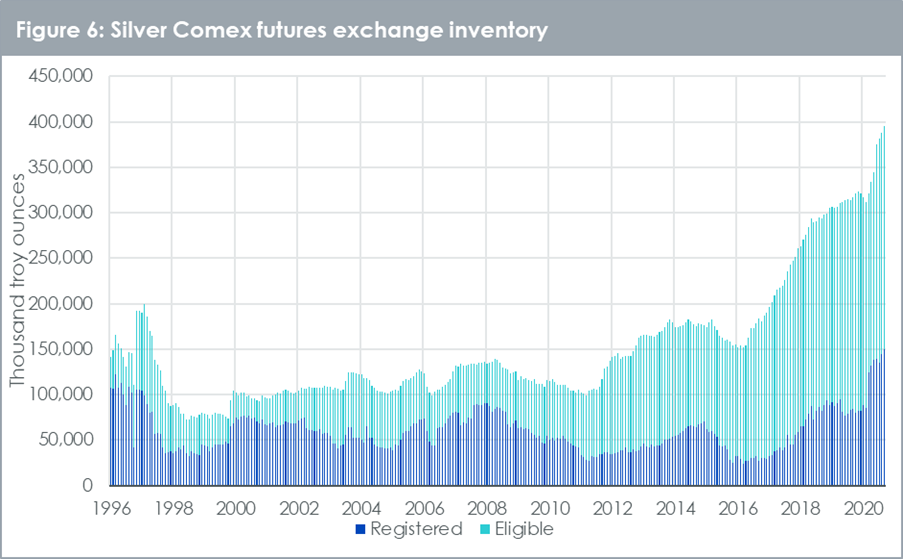
“Silver inventory in Comex warehouses took a dip earlier in 2020 as sourcing metal became difficult under COVID-19 related operational hurdles (including flying metal from refiners in Europe, which became very difficult during lockdown). However, the supply of silver at the futures exchange was always plentiful and did not experience as sharp a dislocation from the over-the-counter spot bullion market as gold did. In recent months silver inventory on exchange has resumed its upward trajectory (Figure 6). We expect this trend to continue, adding some headwinds to silver price.
“We should note that there is a distinction between registered and eligible inventory. Eligible means the metal meets exchange’s requirements but has not been pledged as collateral against a futures market transaction. Registered means the metal meets requirements and has been pledged as collateral for futures market transactions. Eligible can easily be converted into registered, and that is why we look at the aggregate. However, most of the gains in recent years have come in the form of eligible rather than registered. That could simply be the choice of warehousing more in Comex warehouses rather than other warehouses. Nevertheless, the greater source of visible inventory has had a price dampening impact on silver. We expect rising inventory to continue to have this effect in the future.
Silver is not as cheap as it was in 2020
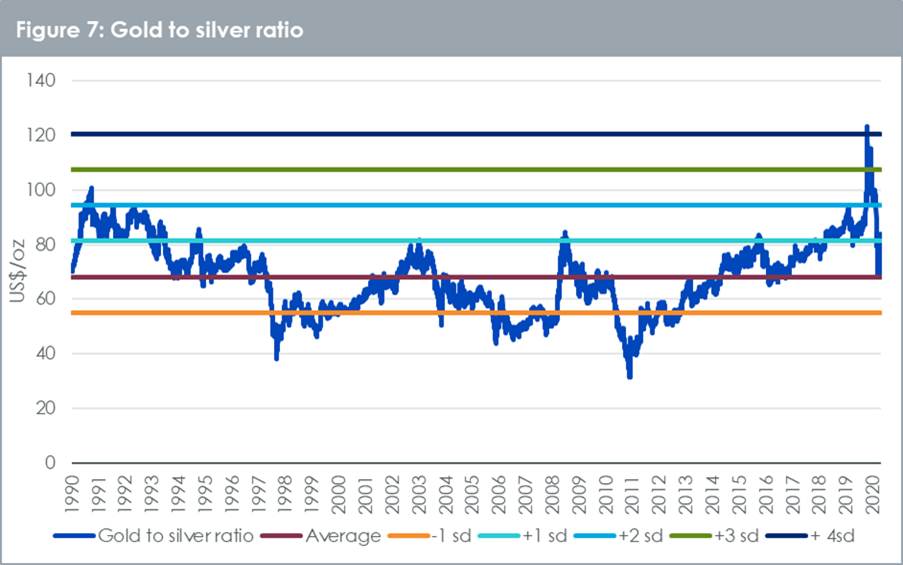
“After spiking to a modern-era high in Q1 2020, the gold-to-silver ratio is now sitting only slightly above its historic average since 1990 (Figure 7). In this regard silver is not as ‘cheap’ as it was in Q1 2020. We still expect silver outperformance over gold this year however, and our current forecasts (under the ‘continued economic uncertainty’ scenario) would put the gold-to-silver ratio at 63 at the end of 2021, just below the historic average of 68.
Conclusion
“Although silver faces some headwinds from potential supply increases, its correlation to gold should act as strong tailwind. Moreover, its hybrid status will allow it to benefit from a cyclical upswing, as we pass the ‘bumps in the road’ in combating the COVID-19 pandemic. Silver has outperformed gold in 2020 and its historic high gold-beta may continue to see it outperform gold when gold is rising.”
Nitesh Shah, Director, Research, WisdomTree


Down on Friday. Up on Monday. The Brent June crude oil contract traded down 5.1% last week to a close of $90.38/b. It reached a high of $103.87/b last Monday and a low of $86.09/b on Friday as Iran announced that the Strait of Hormuz was fully open for transit. That quickly changed over the weekend as the US upheld its blockade of Iranian oil exports while Iran naturally responded by closing the SoH again. The US blew a hole in the engine room of the Iranian ship TOUSKA and took custody of the ship on Sunday. Brent crude is up 5.6% this morning to $95.4/b.

The cease-fire is expiring tomorrow. The US has said it will send a delegation for a second round of negotiations in Islamabad in Pakistan. But Iran has for now rejected a second round of talks as it views US demands as unrealistic and excessive while the US is also blocking the Strait of Hormuz.
While Brent is up 5% this morning, the financial market is still very optimistic that progress will be made. That talks will continue and that the SoH will fully open by the start of May which is consistent with a rest-of-year average Brent crude oil price of around $90/b with the market now trading that balance at around $88/b.
Financial optimism vs. physical deterioration. We have a divergence where the financial market is trading negotiations, improvements and resolution while at the same time the physical market is deteriorating day by day. Physical oil flows remain constrained by disrupted flows, longer voyage times and elevated freight and insurance costs.
Financial markets are betting that a US/Iranian resolution will save us in time from violent shortages down the road. But every day that the SoH remains closed is bringing us closer to a potentially very painful point of shortages and much higher prices.
The US blockade is also a weapon of leverage against its European and Asian allies. When Iran closed the SoH it held the world economy as a hostage against the US. The US blockade of the SoH is of course blocking Iranian oil exports. But it is also an action of disruption directed towards Europe and Asia. The US has called for the rest of the world to engaged in the war with Iran: ”If you want oil from the Persian Gulf, then go and get it”. A risk is that the US plays brinkmanship with the global oil market directed towards its European and Asian allies and maybe even towards China to force them to engage and take part. Maybe unthinkable. But unthinkable has become the norm with Trump in the White House.
Wild moves yesterday. Brent crude traded to a high of $114.43/b and a low of $96.0/b and closed at $99.94/b yesterday.
US – Iran negotiations ongoing or not? What a day. Donald Trump announced that good talks were ongoing between Iran and the US and that the 48 hour deadline before bombing Iranian power plants and energy infrastructure was postponed by five days subject to success of ongoing meetings. Iranian media meanwhile stated that no meetings were ongoing at all.
Today we are scratching our heads trying to figure out what yesterday was all about.
Friends and family playing the market? Was it just Trump and his friends and family who were playing with oil and equity markets with $580m and $1.46bn in bets being placed by someone in oil and equity markets just 15 minutes before Trump’s announcement?
Was Trump pulling a TACO as he reached his political and economic pain point: Brent at $112/b, US Gas at $4/gal, SPX below 200dma and US 10yr above 4.4%?
Different Iranian factions with Trump talking with one of them? Are there real negotiations going on but with the US talking to one faction in Iran while another, the hardliners, are not involved and are denying any such negotiations going on?
Extending the ultimatum to attack and invade Kharg island next weekend? Or, is the five day delay of the deadline a tactical decision to allow US amphibious assault ships and marines to arrive in the Gulf in the upcoming weekend while US and Israeli continues to degrade Iranian military targets till then. And then next weekend a move by the US/Israel to attack and conquer for example the Kharg island?
We do not really know which it is or maybe a combination of these.
We did get some kind of TACO ydy. But markets have been waiting for some kind of TACO to happen and yesterday we got some kind of TACO. And Brent crude is now trading at $101.5/b as a result rather than at $112-114/b as it did no the high yesterday.
But what really matters in our view is the political situation on the ground in Iran. Will hardliners continue to hold power or will a more pragmatic faction gain power?
If the hardliners remain in power then oil pain should extend all the way to US midterm elections. The hardliners were apparently still in charge as of last week. Iran immediately retaliated and damaged LNG infrastructure in Qatar after Israel hit Iranian South Pars. The SoH was still closed and all messages coming out of Iran indicated defiance. Hardliners continues in power has a huge consequence for oil prices going forward. The regime has played its ’oil-weapon’ (closing or chocking the Strait of Hormuz). It is using it to achieve political goals. Deterrence: it needs to be so politically and economically expensive to attack Iran that it won’t happen again in the future. Or at least that the US/Israel thinks 10-times over before they attack again. The highest Brent crude oil closing price since the start of the war is $112.19/b last Friday. In comparison the 20-year inflation adjusted Brent price is $103/b. So Brent crude last Friday at $112.19/b isn’t a shockingly high price. And it is still far below the nominal high of $148/b from 2008 which is $220/b if inflation adjusted. So once in a lifetime Iran activates its most powerful weapon. The oil weapon. It needs to show the power of this weapon and it needs to reap political gains. Getting Brent to $112/b and intraday high of $119.5/b (9 March) isn’t a display of the power of that weapon. And it is not a deterrence against future attacks.
So if the hardliners remain in power in Iran, then the SoH will likely remain chocked all the way to US midterm elections and Brent crude will at a minimum go above the historical nominal high of $148/b from 2008.
Thus the outlook for the oil price for the rest of the year doesn’t depend all that much of whether Trump pulls a TACO or not. Stops bombing or not. It depends more on who is in charge in Iran. If it is the hardliners, then deterrence against future attacks via chocking of the SoH and high oil prices is the likely line of action. It is impacting the world but the Iranian ’oil-weapon’ is directed towards the US president and the the US midterm elections.
If a pragmatic faction gets to power in Iran, then a very prosperous future is possible. However, if power is shifting towards a more pragmatic faction in Iran then a completely different direction could evolve. Such a faction could possibly be open for cooperation with the US and the GCC and possibly put its issues versus Israel aside. Then the prosperity we have seen evolving in Dubai could be a possible future also for Iran.
So far it looks like the hardliners are fully in charge. As far as we can see, the hardliners are still fully in control in Iran. That points towards continued chocking of the SoH and oil prices ticking higher as global inventories (the oil market buffers) are drawn lower. And not just for a few more weeks, but possibly all the way to the US midterm elections.
A brief sigh of relief yesterday as oil infra at Kharg wasn’t damaged. But higher today. Brent crude dabbled around a bit yesterday in relief that oil infrastructure at Iran’s Kharg island wasn’t damaged. It traded briefly below the 100-line and in a range of $99.54 – 106.5/b. Its close was near the low at $100.21/b.
No easy victorious way out for Trump. So no end in sight yet. Brent is up 3.2% today to $103.4/b with no signs that the war will end anytime soon. Trump has no easy way to declare victory and mission accomplished as long as Iran is in full control of the Strait of Hormuz while also holding some 440 kg of uranium enriched to 60% and not far from weapons grade at 90%. As long as these two factors are unresolved it is difficult for Trump to pull out of the Middle East. Naturally he gets increasingly frustrated over the situation as the oil price and US retail gas prices keeps ticking higher while the US is tied into the mess in the Middle East. Trying to drag NATO members into his mess but not much luck there.
When commodity prices spike they spike 2x, 3x, 4x or 5x. Supply and demand for commodities are notoriously inflexible. When either of them shifts sharply, the the price can easily go to zero (April 2022) or multiply 2x, 3x, or even 5x of normal. Examples in case cobalt in 2025 where Kongo restricted supply and the price doubled. Global LNG in 2022 where the price went 5x normal for the full year average. Demand for tungsten in ammunition is up strongly along with full war in the middle east. And its price? Up 537%.
Why hasn’t the Brent crude oil price gone 2x, 3x, 4x or 5x versus its normal of $68/b given close to full stop in the flow of oil of the Strait of Hormuz? We are after all talking about close to 20% of global supply being disrupted. The reason is the buffers. It is fairly easy to store oil. Commercial operators only hold stocks for logistical variations. It is a lot of oil in commercial stocks, but that is predominantly because the whole oil system is so huge. In addition we have Strategic Petroleum Reserves (SPRs) of close to 2500 mb of crude and 1000 mb of oil products. The IEA last week decided to release 400 mb from global SPR. Equal to 20 days of full closure of the Strait of Hormuz. Thus oil in commercial stocks on land, commercial oil in transit at sea and release of oil from SPRs is currently buffering the situation.
But we are running the buffers down day by day. As a result we see gradually increasing stress here and there in the global oil market. Asia is feeling the pinch the most. It has very low self sufficiency of oil and most of the exports from the Gulf normally head to Asia. Availability of propane and butane many places in India (LPG) has dried up very quickly. Local prices have tripled as a result. Local availability of crude, bunker oil, fuel oil, jet fuel, naphtha and other oil products is quickly running down to critical levels many places in Asia with prices shooting up. Oman crude oil is marked at $153/b. Jet fuel in Singapore is marked at $191/b.
Oil at sea originating from Strait of Hormuz from before 28 Feb is rapidly emptied. Oil at sea is a large pool of commercial oil. An inventory of oil in constant move. If we assume that the average journey from the Persian Gulf to its destinations has a volume weighted average of 13.5 days then the amount of oil at sea originating from the Persian Gulf when the the US/Israel attacked on 28 Feb was 13.5 days * 20 mb/d = 269 mb. Since the strait closed, this oil has increasingly been delivered at its destinations. Those closest to the Strait, like Pakistan, felt the emptying of this supply chain the fastest. Propane prices shooting to 3x normal there already last week and restaurants serving cold food this week is a result of that. Some 50-60% of Asia’s imports of Naphtha normally originates from the Persian Gulf. So naphtha is a natural pain point for Asia. The Gulf also a large and important exporter of Jet fuel. That shut in has lifted jet prices above $200/b.
To simplify our calculations we assume that no oil has left the Strait since that date and that there is no increase in Saudi exports from Yanbu. Then the draining of this inventory at sea originated from the Persian Gulf will essentially look like this:
The supply chain of oil at sea originating from the Strait of Hormuz is soon empty. Except for oil allowed through the Strait of Hormuz by Iran and increased exports from Yanbu in the Red Sea. Not included here.

Oil at sea is falling fast as oil is delivered without any new refill in the Persian Gulf. Waivers for Russian crude is also shifting Russian crude to consumers. Brent crude will likely start to feel the pinch much more forcefully when oil at sea is drawn down another 200 mb to around 1000 mb. That is not much more than 10 days from here.

Oil and oil products are starting to become very pricy many places. Brent crude has still been shielded from spiking like the others.


Market Still Betting on Timely Resolution, But Each Day Raises Shortage Risk

Christian Kopfer om läget för oljan

Marknaden måste börja betrakta de höga kopparpriserna som det nya normala

Det fysiska spotpriset på brentolja har slagit nytt rekord

40 minuter med Javier Blas om hur världen verkligen påverkas av energikrisen
40 minuter med Javier Blas om hur världen verkligen påverkas av energikrisen

Elpriserna fördubblas, stor osäkerhet inför sommaren

MP Materials, USA:s svar på Kinas dominans över sällsynta jordartsmetaller
Det fysiska spotpriset på brentolja har slagit nytt rekord

Studsvik har idag ansökt om att få bygga 1200-1600 MW kärnkraft i Valdemarsvik
-
 Nyheter3 veckor sedan
40 minuter med Javier Blas om hur världen verkligen påverkas av energikrisen
-
 Nyheter4 veckor sedan
Elpriserna fördubblas, stor osäkerhet inför sommaren
-
 Nyheter4 veckor sedan
MP Materials, USA:s svar på Kinas dominans över sällsynta jordartsmetaller
-
 Nyheter2 veckor sedan
Det fysiska spotpriset på brentolja har slagit nytt rekord
-
 Nyheter4 veckor sedan
Studsvik har idag ansökt om att få bygga 1200-1600 MW kärnkraft i Valdemarsvik
-
 Nyheter2 veckor sedan
Marknaden måste börja betrakta de höga kopparpriserna som det nya normala
-
Analys4 veckor sedan
TACO (or Whatever It Was) Sends Oil Lower — Iran Keeps Choking Hormuz
-

 Nyheter4 veckor sedan
Matproduktion är beroende av gödsel, Gulfkriget skapar brist