

Analys
Silver outlook to Q4 2021: A year for the hybrid metal

Nitesh Shah, Director, Research, WisdomTree, provides his 2021 outlook for silver, including the potential drivers of performance and the continued recovery of industrial demand.

“After a slow start, silver outpaced gold and most industrial metals in 2020. Initially riding gold’s defensive coattails and then getting a tailwind from its industrial traits, silver was an outperformer, gaining 47% in 2020. That compares to gold (24%), copper (27%) and nickel (21%). Silver’s hybrid status served it well in 2020 and we expect more of the same in 2021. As we articulated in Gold outlook to Q4 2021: at the crossroads of hope and fear, we start 2021 with the hope that COVID-19 vaccines will offer a route out of the malaise that the pandemic has wreaked on the health of the human population and the economies that we operate in. However, as has been abundantly clear in December 2020, the path to the recovery is likely to have many bumps along the road. Silver, playing both a defensive and cyclical role could do very well this year.
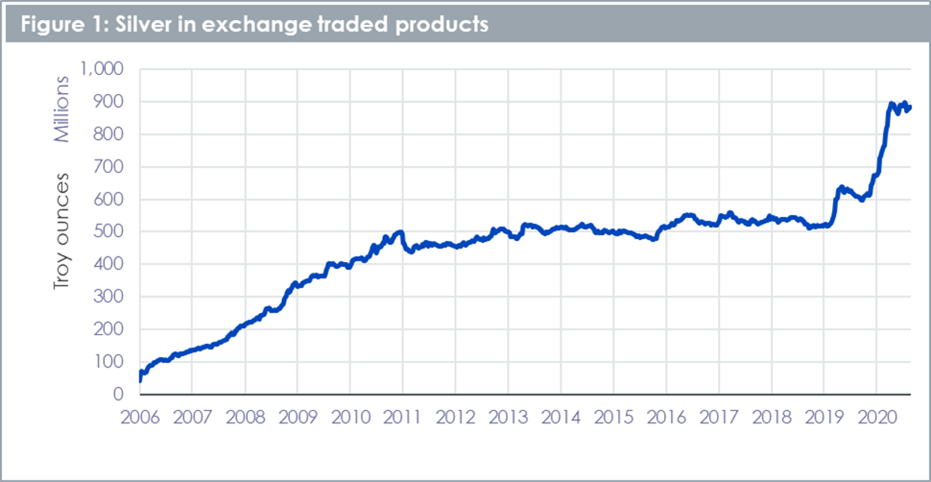
“Silver’s hybrid status has not gone unnoticed by investors. Silver held in exchange traded products (ETPs) rose to an all-time high in 2020 (Figure 1), and more remarkably at a pace never seen before. With 275mn ounces of silver added to silver exchange traded commodities in 2020, the year marks more than double the next highest year of silver ETP gains (2009 with 137mn ounces added). There was strong buying when silver was under-priced relative to gold in the first half of 2020. However, that buying slowed in the second half of the year as silver prices caught up with gold.
Framework
In “Gold and silver: similar, but different”, we argued that silver’s price performance is 80% correlated with gold. In our modelling framework, gold price is therefore the main driver of silver price. However, we also find the following variables as important drivers of silver price:
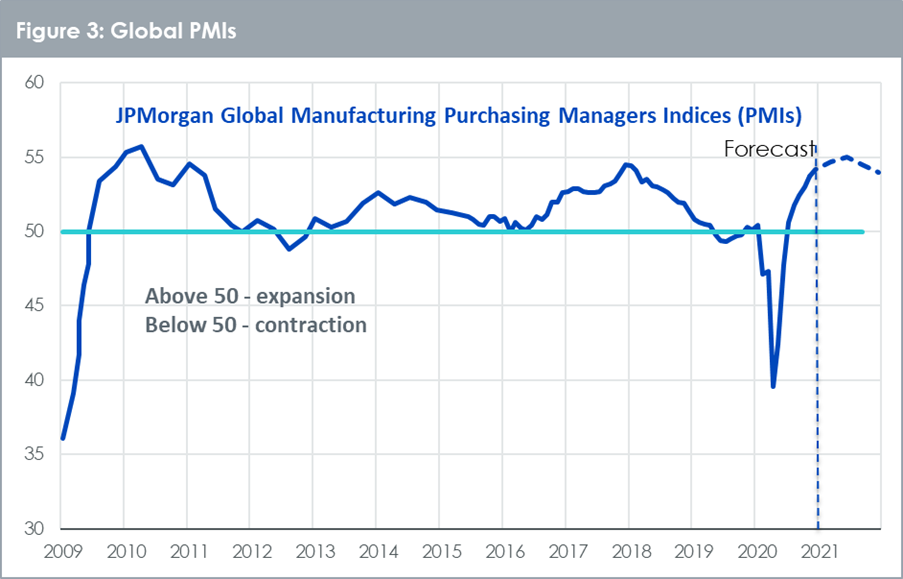
- Growth in manufacturing activity – more than 50% of silver’s use is in industrial applications (in contrast to gold where less than 10% comes from that sector). We use global manufacturing Purchasing Managers Index (PMI) as a proxy for industrial demand
- Growth in silver inventory – rising inventories signal greater availability of the metal and hence is price negative. We use futures market exchange inventory as a proxy
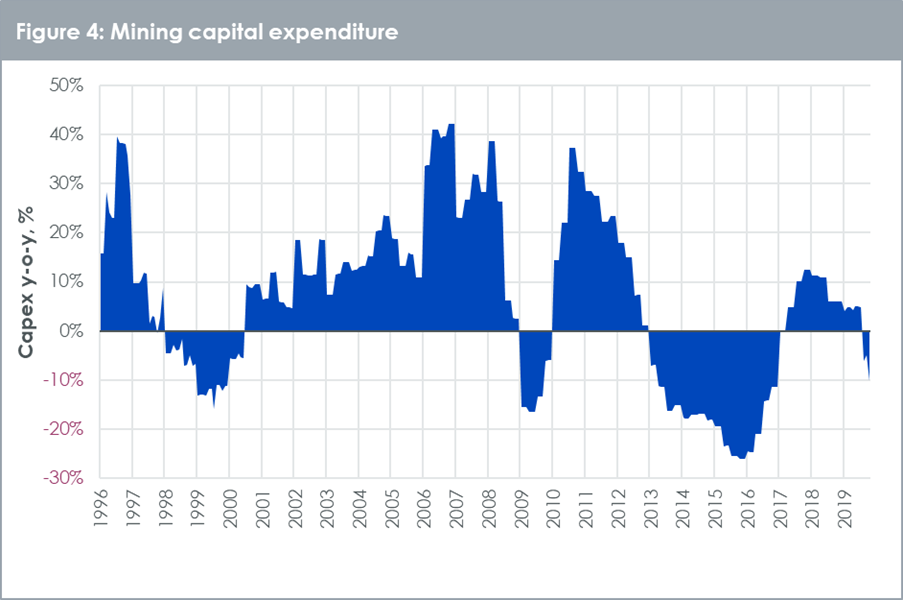
- Growth in mining capital investment (capex) – the more mines invest, the more potential supply we will see in the future. Thus, we take an 18-month lag on this variable. Given that most silver comes as a by-product of mining for other metals, we look at mining capex across the top 100 miners (not just monoline silver miners).
Gold outlook Q4 2021: at the crossroads of hope and fear
In Gold outlook to Q4 2021: at the crossroads of hope and fear we laid out our forecasts under three scenarios.
- Consensus – based on consensus forecasts for all the macroeconomic inputs and an assumption that investor sentiment towards gold remains flat at where it is today.
- Continued economic uncertainty – further monetary intervention, possibly through yield curve control – limits Treasury yields and the US dollar continues to weaken, while investor sentiment towards gold strengthens.
- Hawkish Fed – despite having adjusted its inflation target, the Federal Reserve (Fed) behaves hawkish and Treasury yields rise substantially, the US dollar appreciates back to where it was in June 2020 and inflation remains way below target. As US dollar debasement fears recede, positioning in gold futures declines.
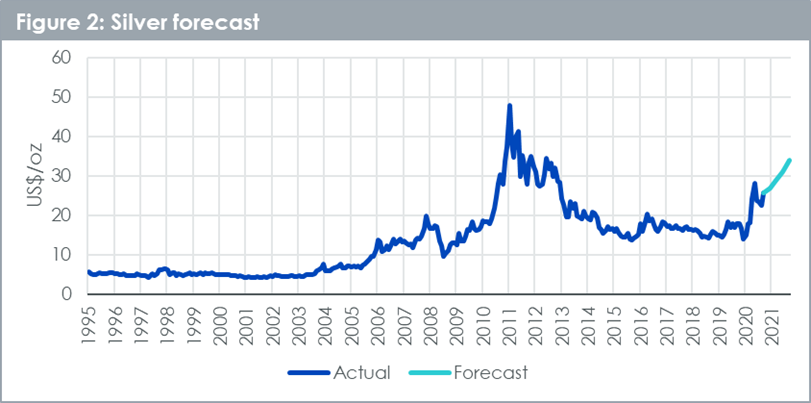
In our silver forecast, we focus on the ‘Continued economic uncertainty scenario’ where the gold price reaches US$2130/oz at the end of the forecast horizon.
Silver forecasts
“We believe in growth terms, silver could outpace gold, reaching US$34/oz in Q4 2021 (33.6% from today’s levels, versus 13.3% for gold. We explain the other drivers to this forecast below.
Industrial demand to continue to recover
“Manufacturing Purchasing Managers Indices (PMIs) have risen strongly in the past few months and are now in the expansionary post-50 region (Figure 3). Coming from a period of tight lockdowns, it’s unsurprising that the relative recovery from spring 2020 levels for the PMIs was strong as lockdown conditions eased. Renewed lockdowns could temporarily halt the improvement, but in general many businesses – with the support of a monetary and fiscal stimulus – will continue to see improvement. As with most historic recoveries, the pace of rebound is likely to slow in in the second half of the year. However, peaking at over 55, the PMIs indicate plenty of industrial demand for silver to be expected.
Mining supply could expand in 2021
“Our model approach uses the capital expenditure in mines as a proxy for future silver supply. While capital expenditure has declined in the past quarter (Figure 4), given the lag that we apply to this input, the rising capital expenditure we saw before that acts as a headwind for silver prices in our model approach.
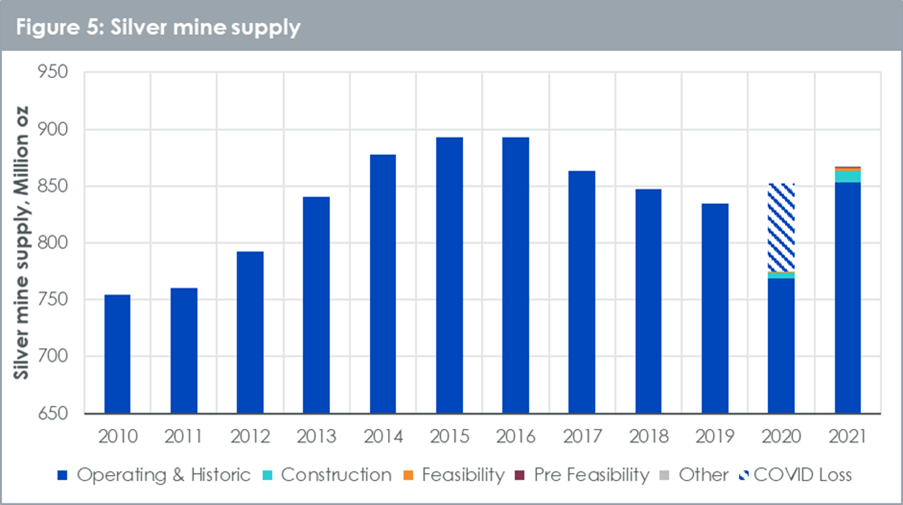
“We know that earlier in 2020 many mines were unable to operate at full capacity due to social distancing and therefore silver mine production has been lower than it would have otherwise been. Figure 5 shows how much these COVID-19 related losses were estimated to be by Metals Focus. Assuming we don’t see lockdowns reintroduced in 2021, we are very likely to see mine production of silver rebound.
Silver exchange inventory rising again
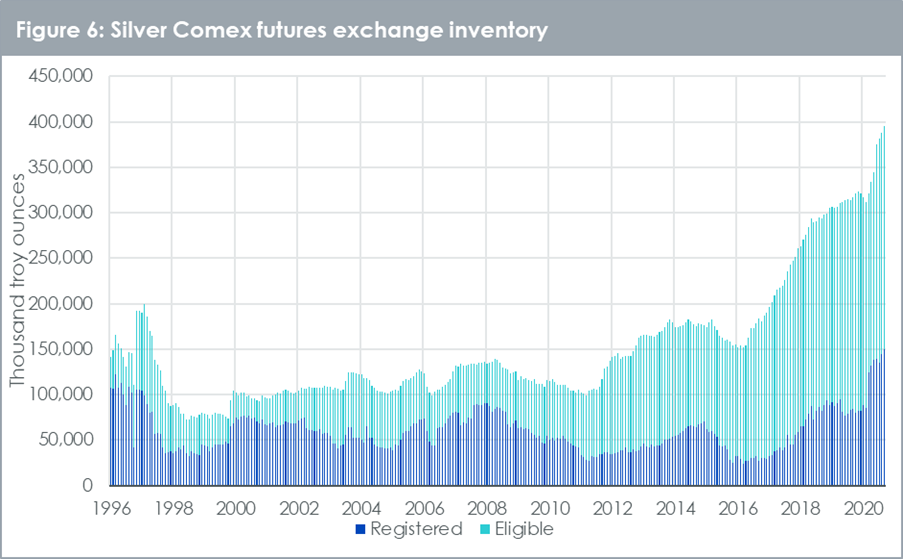
“Silver inventory in Comex warehouses took a dip earlier in 2020 as sourcing metal became difficult under COVID-19 related operational hurdles (including flying metal from refiners in Europe, which became very difficult during lockdown). However, the supply of silver at the futures exchange was always plentiful and did not experience as sharp a dislocation from the over-the-counter spot bullion market as gold did. In recent months silver inventory on exchange has resumed its upward trajectory (Figure 6). We expect this trend to continue, adding some headwinds to silver price.
“We should note that there is a distinction between registered and eligible inventory. Eligible means the metal meets exchange’s requirements but has not been pledged as collateral against a futures market transaction. Registered means the metal meets requirements and has been pledged as collateral for futures market transactions. Eligible can easily be converted into registered, and that is why we look at the aggregate. However, most of the gains in recent years have come in the form of eligible rather than registered. That could simply be the choice of warehousing more in Comex warehouses rather than other warehouses. Nevertheless, the greater source of visible inventory has had a price dampening impact on silver. We expect rising inventory to continue to have this effect in the future.
Silver is not as cheap as it was in 2020
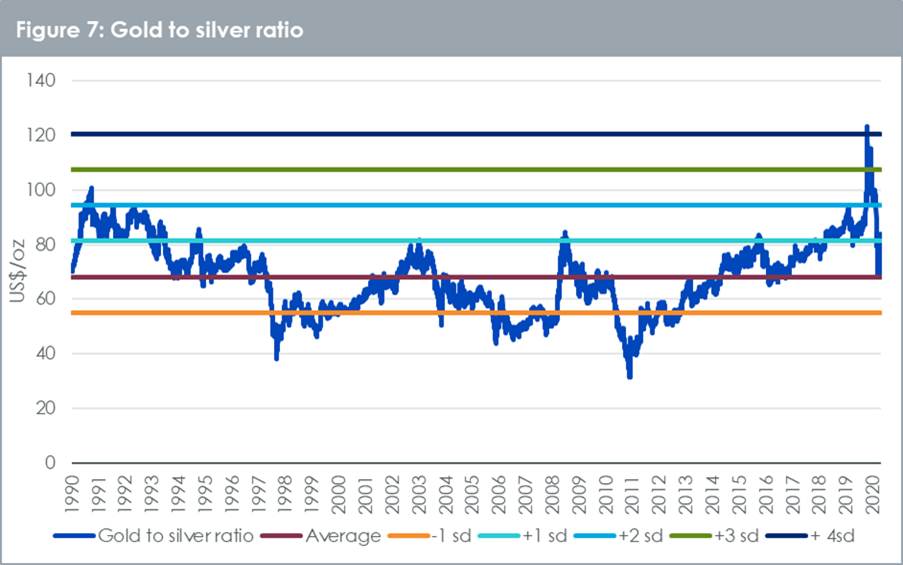
“After spiking to a modern-era high in Q1 2020, the gold-to-silver ratio is now sitting only slightly above its historic average since 1990 (Figure 7). In this regard silver is not as ‘cheap’ as it was in Q1 2020. We still expect silver outperformance over gold this year however, and our current forecasts (under the ‘continued economic uncertainty’ scenario) would put the gold-to-silver ratio at 63 at the end of 2021, just below the historic average of 68.
Conclusion
“Although silver faces some headwinds from potential supply increases, its correlation to gold should act as strong tailwind. Moreover, its hybrid status will allow it to benefit from a cyclical upswing, as we pass the ‘bumps in the road’ in combating the COVID-19 pandemic. Silver has outperformed gold in 2020 and its historic high gold-beta may continue to see it outperform gold when gold is rising.”
Nitesh Shah, Director, Research, WisdomTree


When it starts to move lower it moves rather quickly. Gaza, China, IEA. Brent crude is down 2.1% today to $62/b after having traded as high as $66.58/b last Thursday and above $70/b in late September. The sell-off follows the truce/peace in Gaze, a flareup in US-China trade and yet another bearish oil outlook from the IEA.

A lasting peace in Gaze could drive crude oil at sea to onshore stocks. A lasting peace in Gaza would probably calm down the Houthis and thus allow more normal shipments of crude oil to sail through the Suez Canal, the Red Sea and out through the Bab-el-Mandeb Strait. Crude oil at sea has risen from 48 mb in April to now 91 mb versus a pre-Covid normal of about 50-60 mb. The rise to 91 mb is probably the result of crude sailing around Africa to be shot to pieces by the Houthis. If sailings were to normalize through the Suez Canal, then it could free up some 40 mb in transit at sea moving onshore into stocks.
The US-China trade conflict is of course bearish for demand if it continues.
Bearish IEA yet again. Getting closer to 2026. Credibility rises. We expect OPEC to cut end of 2025. The bearish monthly report from the IEA is what it is, but the closer we get to 2026, the more likely the IEA is of being ball-park right in its outlook. In its monthly report today the IEA estimates that the need for crude oil from OPEC in 2026 will be 25.4 mb/d versus production by the group in September of 29.1 mb/d. The group thus needs to do some serious cutting at the end of 2025 if it wants to keep the market balanced and avoid inventories from skyrocketing. Given that IEA is correct that is. We do however expect OPEC to implement cuts to avoid a large increase in inventories in Q1-26. The group will probably revert to cuts either at its early December meeting when they discuss production for January or in early January when they discuss production for February. The oil price will likely head yet lower until the group reverts to cuts.
Dubai: The Mid-East anchor dragging crude oil lower. Surplus emerging in Mid-East pricing. Crude oil prices held surprisingly strong all through the summer. A sign and a key source of that strength came from the strength in the front-end backwardation of the Dubai crude oil curve. It held out strong from mid-June and all until late September with an average 1-3mth time-spread premium of $1.8/b from mid-June to end of September. The 1-3mth time-spreads for Brent and WTI however were in steady deterioration from late June while their flat prices probably were held up by the strength coming from the Persian Gulf. Then in late September the strength in the Dubai curve suddenly collapsed. Since the start of October it has been weaker than both the Brent and the WTI curves. The Dubai 1-3mth time-spread now only stands at $0.25/b. The Middle East is now exporting more as it is producing more and also consuming less following elevated summer crude burn for power (Aircon) etc.
The only bear-element missing is a sudden and solid rise in OECD stocks. The only thing that is missing for the bear-case everyone have been waiting for is a solid, visible rise in OECD stocks in general and US oil stocks specifically. So watch out for US API indications tomorrow and official US oil inventories on Thursday.
No sign of any kind of fire-sale of oil from Saudi Arabia yet. To what we can see, Saudi Arabia is not at all struggling to sell its oil. It only lowered its Official Selling Prices (OSPs) to Asia marginally for November. A surplus market + Saudi determination to sell its oil to the market would normally lead to a sharp lowering of Saudi OSPs to Asia. Not yet at least and not for November.
The 5yr contract close to fixed at $68/b. Of importance with respect to how far down oil can/will go. When the oil market moves into a surplus then the spot price starts to trade in a large discount to the 5yr contract. Typically $10-15/b below the 5yr contract on average in bear-years (2009, 2015, 2016, 2020). But the 5yr contract is usually pulled lower as well thus making this approach a moving target. But the 5yr contract price has now been rock solidly been pegged to $68/b since 2022. And in the 2022 bull-year (Brent spot average $99/b), the 5yr contract only went to $72/b on average. If we assume that the same goes for the downside and that 2026 is a bear-year then the 5yr goes to $64/b while the spot is trading at a $10-15/b discount to that. That would imply an average spot price next year of $49-54/b. But that is if OPEC doesn’t revert to cuts and instead keeps production flowing. We think OPEC(+) will trim/cut production as needed into 2026 to prevent a huge build-up in global oil stocks and a crash in prices. But for now we are still heading lower. Into the $50ies/b.
Some rebound but not much. Brent crude rebounded 1.5% yesterday to $65.47/b. This morning it is inching 0.2% up to $65.6/b. The lowest close last week was on Thursday at $64.11/b.
The curve structure is almost as week as it was before the weekend. The rebound we now have gotten post the message from OPEC+ over the weekend is to a large degree a rebound along the curve rather than much strengthening at the front-end of the curve. That part of the curve structure is almost as weak as it was last Thursday.
We are still on a weakening path. The message from OPEC+ over the weekend was we are still on a weakening path with rising supply from the group. It is just not as rapidly weakening as was feared ahead of the weekend when a quota hike of 500 kb/d/mth for November was discussed.
The Brent curve is on its way to full contango with Brent dipping into the $50ies/b. Thus the ongoing weakening we have had in the crude curve since the start of the year, and especially since early June, will continue until the Brent crude oil forward curve is in full contango along with visibly rising US and OECD oil inventories. The front-month Brent contract will then flip down towards the $60/b-line and below into the $50ies/b.
At what point will OPEC+ turn to cuts? The big question then becomes: When will OPEC+ turn around to make some cuts? At what (price) point will they choose to stabilize the market? Because for sure they will. Higher oil inventories, some more shedding of drilling rigs in US shale and Brent into the 50ies somewhere is probably where the group will step in.
There is nothing we have seen from the group so far which indicates that they will close their eyes, let the world drown in oil and the oil price crash to $40/b or below.
The message from OPEC+ is also about balance and stability. The world won’t drown in oil in 2026. The message from the group as far as we manage to interpret it is twofold: 1) Taking back market share which requires a lower price for non-OPEC+ to back off a bit, and 2) Oil market stability and balance. It is not just about 1. Thus fretting about how we are all going to drown in oil in 2026 is totally off the mark by just focusing on point 1.
When to buy cal 2026? Before Christmas when Brent hits $55/b and before OPEC+ holds its last meeting of the year which is likely to be in early December.
Brent crude oil prices have rebounded a bit along the forward curve. Not much strengthening in the structure of the curve. The front-end backwardation is not much stronger today than on its weakest level so far this year which was on Thursday last week.

The front-end backwardation fell to its weakest level so far this year on Thursday last week. A slight pickup yesterday and today, but still very close to the weakest year to date. More oil from OPEC+ in the coming months and softer demand and rising inventories. We are heading for yet softer levels.

Down to the lowest since early May. Brent crude has fallen sharply the latest four days. It closed at USD 64.11/b yesterday which is the lowest since early May. It is staging a 1.3% rebound this morning along with gains in both equities and industrial metals with an added touch of support from a softer USD on top.
What stands out the most to us this week is the collapse in the Dubai one to three months time-spread.
Dubai is medium sour crude. OPEC+ is in general medium sour crude production. Asian refineries are predominantly designed to process medium sour crude. So Dubai is the real measure of the balance between OPEC+ holding back or not versus Asian oil demand for consumption and stock building.
A sharp weakening of the front-end of the Dubai curve. The front-end of the Dubai crude curve has been holding out very solidly throughout this summer while the front-end of the Brent and WTI curves have been steadily softening. But the strength in the Dubai curve in our view was carrying the crude oil market in general. A source of strength in the crude oil market. The core of the strength.
The now finally sharp decline of the front-end of the Dubai crude curve is thus a strong shift. Weakness in the Dubai crude marker is weakness in the core of the oil market. The core which has helped to hold the oil market elevated.
Facts supports the weakening. Add in facts of Iraq lifting production from Kurdistan through Turkey. Saudi Arabia lifting production to 10 mb/d in September (normal production level) and lifting exports as well as domestic demand for oil for power for air con is fading along with summer heat. Add also in counter seasonal rise in US crude and product stocks last week. US oil stocks usually decline by 1.3 mb/week this time of year. Last week they instead rose 6.4 mb/week (+7.2 mb if including SPR). Total US commercial oil stocks are now only 2.1 mb below the 2015-19 seasonal average. US oil stocks normally decline from now to Christmas. If they instead continue to rise, then it will be strongly counter seasonal rise and will create a very strong bearish pressure on oil prices.
Will OPEC+ lift its voluntary quotas by zero, 137 kb/d, 500 kb/d or 1.5 mb/d? On Sunday of course OPEC+ will decide on how much to unwind of the remaining 1.5 mb/d of voluntary quotas for November. Will it be 137 kb/d yet again as for October? Will it be 500 kb/d as was talked about earlier this week? Or will it be a full unwind in one go of 1.5 mb/d? We think most likely now it will be at least 500 kb/d and possibly a full unwind. We discussed this in a not earlier this week: ”500 kb/d of voluntary quotas in October. But a full unwind of 1.5 mb/d”
The strength in the front-end of the Dubai curve held out through summer while Brent and WTI curve structures weakened steadily. That core strength helped to keep flat crude oil prices elevated close to the 70-line. Now also the Dubai curve has given in.

Brent crude oil forward curves

Total US commercial stocks now close to normal. Counter seasonal rise last week. Rest of year?

Total US crude and product stocks on a steady trend higher.


The Mid-East anchor dragging crude oil lower

Samtal om sällsynta jordartsmetaller, guld och silver

Brookfield köper bränsleceller för 5 miljarder USD av Bloom Energy för att driva AI-datacenter

Teck Resources kan förse Nordamerika och kanske hela G7 med all germanium som behövs

Leading Edge Materials är på rätt plats i rätt tid

Kinas elproduktion slog nytt rekord i augusti, vilket även kolkraft gjorde

Tyskland har så höga elpriser att företag inte har råd att använda elektricitet

OPEC+ missar produktionsmål, stöder oljepriserna

Ett samtal om guld, olja, fjärrvärme och förnybar energi
Brent crude ticks higher on tension, but market structure stays soft
-
 Nyheter4 veckor sedan
Kinas elproduktion slog nytt rekord i augusti, vilket även kolkraft gjorde
-
Nyheter4 veckor sedan
Tyskland har så höga elpriser att företag inte har råd att använda elektricitet
-
 Nyheter3 veckor sedan
OPEC+ missar produktionsmål, stöder oljepriserna
-
 Nyheter3 veckor sedan
Ett samtal om guld, olja, fjärrvärme och förnybar energi
-
Analys4 veckor sedan
Brent crude ticks higher on tension, but market structure stays soft
-
Analys3 veckor sedan
Are Ukraine’s attacks on Russian energy infrastructure working?
-

 Nyheter2 veckor sedan
Guld nära 4000 USD och silver 50 USD, därför kan de fortsätta stiga
-

 Nyheter3 veckor sedan
Guldpriset uppe på nya höjder, nu 3750 USD