

Analys
SEB – Råvarukommentarer vecka 18 2012
Sammanfattning: Föregående vecka
 Brett råvaruindex: +1,62 %
UBS Bloomberg CMCI TR Index- Energi: +1,42 %
UBS Bloomberg CMCI Energy TR Index - Ädelmetaller: +2,12 %
UBS Bloomberg CMCI Precious Metals TR Index - Industrimetaller: +3,47 %
UBS Bloomberg CMCI Industrial Metals TR Index - Jordbruk: +0,59 %
UBS Bloomberg CMCI Agriculture TR Index
Kortsiktig marknadsvy:
- Guld: Neutral/köp
- Olja: Sälj
- Koppar: Sälj
- Majs: Sälj
- Vete: Neutral/sälj
Guld

- Guldet steg 1,97 procent förra veckan och har för tillfället svårt att bryta ut på uppsidan. Flera länder går till val i Europa vilket försvårar för gemensamma förhandlingar. Tidigare överenskommelser såsom den förhandlade budgetpakten, som drivits fram av Tyskland, kan komma att rivas upp eller omförhandlas vilket försvagar euron och ger styrka till dollarn vilket i sin tur dämpar guldpriset.
- I USA redovisade U.S Mint guldmyntförsäljningen för april vilken var den lägsta på fem år. Endast 17 000 troy ounce (ett troy ounce är ca 31 gram) har sålts i april jämfört med 70 000 ton under årets tre första månader. Spekulativa positioner på Comex har också minskat.
- Fed lämnade räntan oförändrad vilket ger stöd åt guldpriset samtidigt som avsaknaden av ytterligare stimulanser verkade dämpande. Guldpriset var oför-ändrat på Feds räntebesked.
- Centralbanker är fortfarande nettoköpare av guld och den ryska centralbanken ökade sin reserv med 15,5 ton. Guldet kommer troligen från inhemsk produktion. Börsen i Shanghai kommer att införa högre marginalkrav för några råvaror, däribland guld. Höjningen träder i kraft den 27:e april. Detta kan tillfälligt förhindra prisökningar.
- Teknisk Analys: Dubbelbotten? Bara marginella rörelser noterade sedan förra fredagen. Dock har vi fått ett par spikar på nedsidan vilket visar att köparna har visat intresse under 1640 området något som vi tolkar lätt positivt. Som tidigare krävs dock åtminstone en uppgång över 1680 för att öka på sannolikheten för att en botten äntligen är på plats.

Olja

- Europa fortsätter att oroa marknaden och statistik från det viktiga dragloket Tyskland har varit sämre än förväntat. Preliminära inköpschefsindexet för den tyska industrin sjönk till 46,3 i april jämfört med 48,4 i mars. Det är den lägsta siffran på 33 månader. Att S & P:s beslutade att sänka Spaniens kreditbetyg två steg med fortsatt negativa utsikter spär på oro och ovisshet.
- Fed lämnade räntan oförändrad på onsdagen med en förväntad låg ränta t.o.m. slutet av 2014 eftersom de ekonomiska förhållandena enligt Fed kräver en extrem lågräntepolitik. Vad gäller kvantitativa lättnader så är Fed redo att göra mer om förhållanden i marknaden skulle kräva det. Oljepriset steg på beskedet att Fed trots allt reviderade upp sin prognos för amerikansk tillväxt i 2012.
- Förra veckan gjorde Iran ett utspel där landet meddelade att man kommer att överväga Rysslands förslag om att inte vidareutveckla landets kärnvapenprogram och att tillåta ytterligare inspektioner. Utspelet kan mycket väl vara ett sätt för landet att vinna tid. Oljan sjönk en procent efter uttalandet. Nytt atommöte med Iran kommer att hållas i Bagdad den 23:e maj.
- Veckostatistik från American Petroleum Institute (API) visade att råoljelager föll med en miljon fat medan onsdagens DOE siffra visade att råoljelager steg med fyra miljoner fat mot förväntade tre miljoner.
- Teknisk Analys: Återtest av bandet & sedan ned. Vi bör nu vara i slutfasen av återtestet av 55 dagars bandet (vi flaggade för förra veckan). Återtestet har gått långsammare än förväntat vilket å andra sidan visar på lågt deltagande av köpare, något som passar bra in i vår nu något mer negativ vy.

Koppar

- S & P:s beslutade i torsdags att sänka Spaniens kreditbetyg två steg med fort-satt negativa utsikter. Motiveringen är en ökad risk att spanska staten behöver mer kapital för att kunna bistå bankerna samt risk för två år med recession. Hela Eurozonen fick en känga av S & P: ”strategin att hantera Europas stats-skuldkris fortsätter att sakna effektivitet.” Euroländerna måste besluta om man ska hjälpa Spanien.
- Dollarn stärktes på S & Ps besked och kopparpriset steg t.o.m något trots dollarns förstärkning.
- Enligt kinesiska myndigheter importerade Kina 345,7 ton koppar i mars vilket är en minskning med 8 procent från februari. Flera rapporter bekräftar att koppar-lagren i Kina är välfyllda till bredden. Inkluderat 600 000 ton i frihamnslager uppges lagren uppgå till 1 miljon ton. Enligt estimat finns ¾ av globala lager i Kina nu. Marknaden i Kina är stängd idag.
- Terminskurvan i koppar är i backwardation dvs. framtida förväntade priser är billigare än aktuellt pris och denna skillnad blir allt större vilket vi tolkar som att tillgången på koppar utanför Kina är begränsad USA:s BNP ökade med 2,2 procent på årlig basis under det första kvartalet vilket var lägre än vad analytiker hade räknat med enligt Bloomberg. Siffran kan tolkas på så sätt att sannolikheten för kvantitativa lättnader ökar.
- Teknisk Analys: Färdig korrektion. Studsen upp från trend linjen blev lite starkare än vad vi initialt räknade med (8218) vilket i och för sig inte ändrar nå-got av den större vyn. Vi ser fortfarande marknaden som negativ och kommer att fortsätta göra så länge vi inte återetablerar oss över medelvärdesbanden.

Majs

- Majspriset steg ca en halv procent förra veckan. Vi kan se en fortsatt hög volatilitet i majsmarknaden, där majkontraktet i Chicago handlades upp och ned med några procent varje dag, men utan tydlig riktning.
- En faktor som hjälpt till att trycka upp priset är den kinesiska efterfrågan, där USDA i början av veckan kom ut med statistik som påvisade en god export av amerikansk majs till okända destinationer. Det kunde senare under veckan bekräftas att en stor del av denna majs gått till Kina.
- Samtidigt har det spekulerats en hel del kring huruvida den goda starten på den amerikanska majsplanteringen ska kunna fortsätta på samma sätt framöver, där det funnits en viss oro för att det kalla väder som råder norr om flera viktiga majsstater ska leta sig söderut. Då en mängd prognoser visat på att så inte är fallet har oron minskat och med dessa även efterfrågan på majs.
- Vi anser inte att förra veckans uppgång kan motiveras av stark efterfrågan från Kina och tror med detta att majspriset under den kommande veckan kommer att kunna falla tillbaka något.
- Teknisk Analys: Lite förvirrat. Efter det falska brottet under botten linjen samt efterföljande test och studs av densamma ser det ut som om marknaden skulle kunna vara på väg att söka sig norrut. Å andra sidan har vi än så länge inte lyckats hålla oss kvar över mitten punkten, 624, av den kraftigt stigande ”candlen” per 30:e mars. För att minska förvirringen måste vi bryta antingen 632 eller 609 ½.

Vete
 - Prisutveckling")
- Vetet i Paris föll nära två procent veckan som gick. För närvarande är korrelationen mellan det amerikanska och det europeiska vetet mycket låg.
- I Europa är det en blandad utveckling med förhållandevis goda prognoser avseende veteskörden i Tyskland, Storbritannien och Frankrike. Samtidigt är förutsättningarna bedrövliga i Spanien, där man gång på gång tvingas justera ned sina produktionsestimat.
- I början av veckan kom International Grains Councils senaste spannmålsrapport, i vilken organisationen justerar ned sin prognos för den globala veteskörden. Denna nedrevidering av tidigare estimat är i princip uteslutande baserad på de europeiska köldproblemen från första kvartalet.
- Vi förhåller oss neutrala till svagt negativa till vetet i Paris denna vecka, där vi dock är beredda att snabbt positionera oss mot en nedgång om planteringssiffrorna fortsätter att överraska oss positivt i USA och Europa.
- Teknisk Analys: Tunga motstånd bromsar. Efter att i princip ha tangerat årshögsta faller vi tillbaka något i vad som får anses vara en mindre vinsthemtagning. Vidare behöver nog marknaden samla lite styrka för att kunna ta sig an ett så pass tungt motstånd som 219-området. Det mest troliga utfallet ser ut att bli intervall handel mellan medelvärdesbandet och topp området.

[box]SEB Veckobrev Veckans råvarukommentar är producerat av SEB Merchant Banking och publiceras i samarbete och med tillstånd på Råvarumarknaden.se[/box]
Disclaimer
The information in this document has been compiled by SEB Merchant Banking, a division within Skandinaviska Enskilda Banken AB (publ) (“SEB”).
Opinions contained in this report represent the bank’s present opinion only and are subject to change without notice. All information contained in this report has been compiled in good faith from sources believed to be reliable. However, no representation or warranty, expressed or implied, is made with respect to the completeness or accuracy of its contents and the information is not to be relied upon as authoritative. Anyone considering taking actions based upon the content of this document is urged to base his or her investment decisions upon such investigations as he or she deems necessary. This document is being provided as information only, and no specific actions are being solicited as a result of it; to the extent permitted by law, no liability whatsoever is accepted for any direct or consequential loss arising from use of this document or its contents.
About SEB
SEB is a public company incorporated in Stockholm, Sweden, with limited liability. It is a participant at major Nordic and other European Regulated Markets and Multilateral Trading Facilities (as well as some non-European equivalent markets) for trading in financial instruments, such as markets operated by NASDAQ OMX, NYSE Euronext, London Stock Exchange, Deutsche Börse, Swiss Exchanges, Turquoise and Chi-X. SEB is authorized and regulated by Finansinspektionen in Sweden; it is authorized and subject to limited regulation by the Financial Services Authority for the conduct of designated investment business in the UK, and is subject to the provisions of relevant regulators in all other jurisdictions where SEB conducts operations. SEB Merchant Banking. All rights reserved.
Analys
Physical easing. Iran risk easing. But Persian Gulf risk cannot fully fade before US war ships are pulled away

Traded down 3.7% last week as Iranian risk faded a bit. Brent crude traded in a range of $65.19 – 69.76/b last week. In the end it traded down 3.7% with a close of $68.05/b. It was unable to challenge the peak of $71.89/b from the previous week when the market got its first nervous shake as Trump threatened Iran with an armada of US war ships.

The market has started to cool down a bit with US and Iran in talks in Oman on Friday and Brent crude is easing 0.9% this morning to $67.4/b in an extension of that. As we have stated before we think the probability is very low for a scenario where the US attacks Iran in such a way that it risks an uncontrollable escalation with possible large scale disruption of oil out of the Strait of Hormuz and thus a massive spike in the oil price. That would endanger Trump’s mid-term election which is already challenged with unhappy US voters complaining about affordability and that Trump is spending too much time on foreign issues.
A statement by Trump last week that India had agreed not to buy Russian crude turns out to have little substance as India has agreed to no such thing on paper. The statement last week naturally supported oil prices as the market is already struggling with a two tire market with legal versus illegal barrels. There is a lot of friction in the market for sanctioned crude oil barrels from Iran and Russia. If India had agreed not to buy Russian crude oil then the market for legal barrels would have been tighter.
The physical market has been tighter than expected. And the recent concerns over Iranian risk has come on top of that. The market is probably starting calm down regarding the Iranian risk. But the physical tightness is also going to ease gradually over the coming couple of weeks. CPC blend exports averaged 1.5 mb/d last year, but were down to less than 1 mb/d in January due to a combination of factors. Drone attacks by Ukraine in late November. The Tengiz field has been disrupted by fires. Adverse winter weather has also been a problem. US crude oil production has also been disrupted by a fierce winter storm. But these issues are fading with supply reviving over the next couple of weeks.
The physical tightness is likely going to ease over the next couple of weeks. The market may also have started to get used to the Iranian situation. But the Iranian risk premium cannot be fully defused as long as US warships are located where they are with their guns and rockets pointing towards Iran.
Brent crude rose 2.7% last week to $65.88/b with a gain on Friday of 2.8%. Unusually cold US winter weather with higher heating oil demand and likely US oil supply outages was probably part of the bullish drive at the end of last week. But US threats towards Iran with USS Abraham Lincoln being deployed to the Middle East was probably more important.
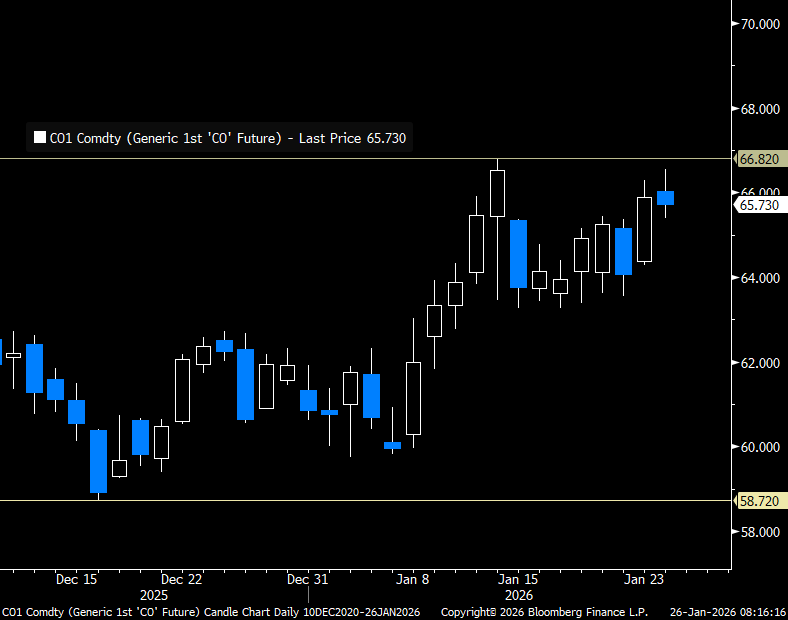
Brent crude has maintained the gains it got from 8 January onwards when it rose from the $60/b-line and up to around $65/b on the back of Iranian riots where the US added fuel to the fire by threatening to attack Iran in support of the rioters. This morning Brent has tested the upside to $66.54/b. That is short of the $66.82/b from 14 January and Brent has given back part of the early gains this morning and is currently trading close to unchanged versus Friday’s close with a dollar decline of 0.4% not enough to add much boost to the price yet at least.
Brent crude front-month prices in USD/b
The rally in Brent crude from the $60/b-line to its current level of $65-66/b seems to be tightly linked to an elevated risk of the US attacking Iran in support of the rioters. Bloomberg reported on Saturday that the US has dispatched the USS Abraham Lincoln aircraft carrier and its associated strike group to the Middle East. It is a similar force which the US deployed to the Caribbean Sea just weeks before the 3 January operation where Maduro was captured. The probability of a US/Israeli attack on Iran is pegged at 65-70% by geopolitical risk assessment firms Eurasia Group and Rapidan Energy Group. Such a high probability explains much of the recent rally in Brent crude.
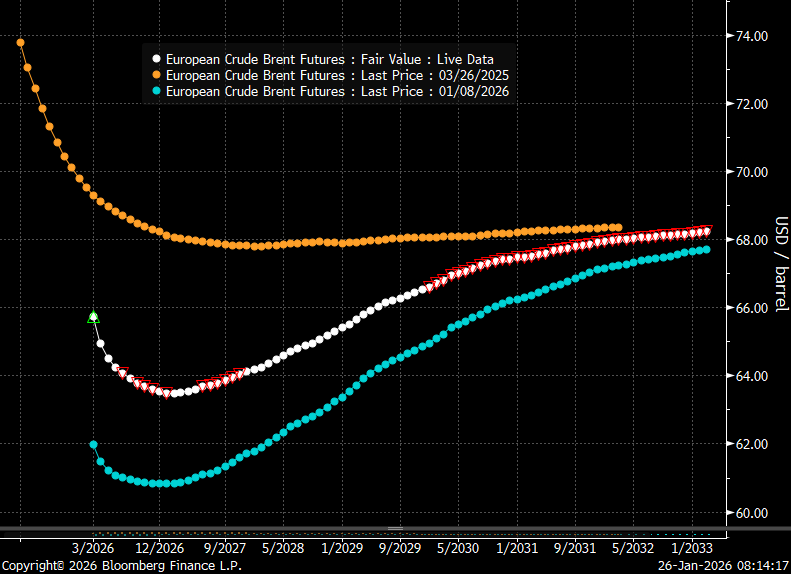
The recent rally in Brent crude is not a signal from the oil market that the much discussed global surplus has been called off. If we look at the shape of the Brent crude oil curve it is currently heavily front-end backwardated with the curve sloping upwards in contango thereafter. It signals front-end tightness or near term geopolitical risk premium followed by surplus. If the market had called off the views of a surplus, then the whole Brent forward curve would have been much flatter and without the intermediate deep dip in the curve. The shape of the Brent curve is telling us that the market is concerned right now for what might happen in Iran, but it still maintains and overall view of surplus and stock building unless OPEC+ cuts back on supply.
It also implies that Brent crude will fall back if the US pulls back from its threats of attacking Iran.
Brent crude forward curves in USD/b.
Falling back this morning. Brent crude traded from an intraday low of $59.75/b last Monday to an intraday high of $63.92/b on Friday and a close that day of $63.34/b. Driven higher by the rising riots in Iran. Brent is trading slightly lower this morning at $63.0/b.
Iranian riots and risk of supply disruption in the Middle East takes center stage. The Iranian public is rioting in response to rapidly falling living conditions. The current oppressive regime has been ruling the country for 46 years. The Iranian economy has rapidly deteriorated the latest years along with the mismanagement of the economy, a water crisis, encompassing corruption with the Iranian Revolutionary Guard Corps at the center and with US sanctions on top. The public has had enough and is now rioting. SEB’s EM Strategist Erik Meyersson wrote the following on the Iranian situation yesterday: ”Iran is on the brink – but of what?” with one statement being ”…the regime seems to lack a comprehensive set of solutions to solve the socioeconomic problems”. That is of course bad news for the regime. What can it do? Erik’s takeaway is that it is an open question what this will lead to while also drawing up different possible scenarios.
Personally I fear that this may end very badly for the rioters. That the regime will use absolute force to quash the riots. Kill many, many more and arrest and torture anyone who still dare to protest. I do not have high hopes for a transition to another regime. I bet that Iranian’s telephone lines to its diverse group of autocratic friends currently are running red-hot with ”friendly” recommendations of how to quash the riots. This could easily become the ”Tiananmen Square” moment (1989) for the current Iranian regime.
The risks to the oil market are:
1) The current regime applies absolute force. The riots die out and oil production and exports continue as before. Continued US and EU sanctions with Iranian oil mostly going to China. No major loss of supply to the global market in total. Limited impact on oil prices. Current risk premium fades. Economically the Iranian regime continues to limp forward at a deteriorating path.
2) The regime applies absolute force as in 1), but the US intervenes kinetically. Escalation ensues in the Middle East to the point that oil exports out of the Strait of Hormuz are curbed. The price of oil shots above $150/b.
3) Riots spreads to affect Iranian oil production/exports. The current regime does not apply sufficient absolute force. Riots spreads further to affect oil production and export facilities with the result that the oil market loses some 1.5 mb/d to 2.0 mb/d of exports from Iran. Thereafter a messy aftermath regime wise.
Looking at the oil market today the Brent crude oil price is falling back 0.6% to $63/b. As such the oil market is assigning very low risk for scenario 2) and probably a very high probability for scenario 1).
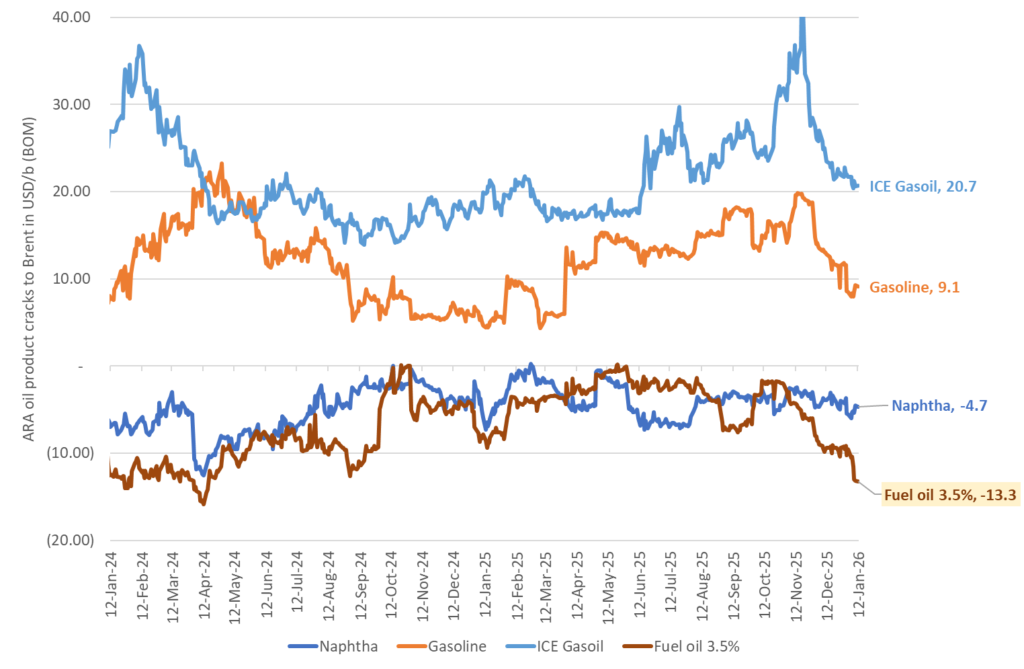
Venezuela: Heavy sour crude and product prices falls sharply on prospect of reduced US sanctions on Venezuelan oil exports. The oil market take on Venezuela has quickly shifted from fear of losing what was left of its production and exports to instead expecting more heavy oil from Venezuela to be released into the market. Not at least easier access to Venezuelan heavy crude for USGC refineries. The US has started to partially lift sanctions on Venezuelan crude oil exports with the aim of releasing 30mn-50mn bl of Venezuelan crude from onshore and offshore stocks according to the US energy secretary Chris Wright. But a significant increase in oil production and exports is far away. It is estimated that it will take $10bn in capex spending every year for 10 years to drive its production up by 1.5 mb/d to a total of 2.5 mb/d. That is not moving the needle a lot for the US which has a total hydrocarbon liquids production today of 23.6 mb/d (2025 average). At the same time US oil majors are not all that eager to invest in Venezuela as they still hold tens of billions of dollars in claims against the nation from when it confiscated their assets in 2007. Prices for heavy crude in the USGC have however fallen sharply over the prospect of getting easier access to more heavy crude from Venezuela. The relative price of heavy sour crude products in Western Europe versus Brent crude have also fallen sharply into the new year.
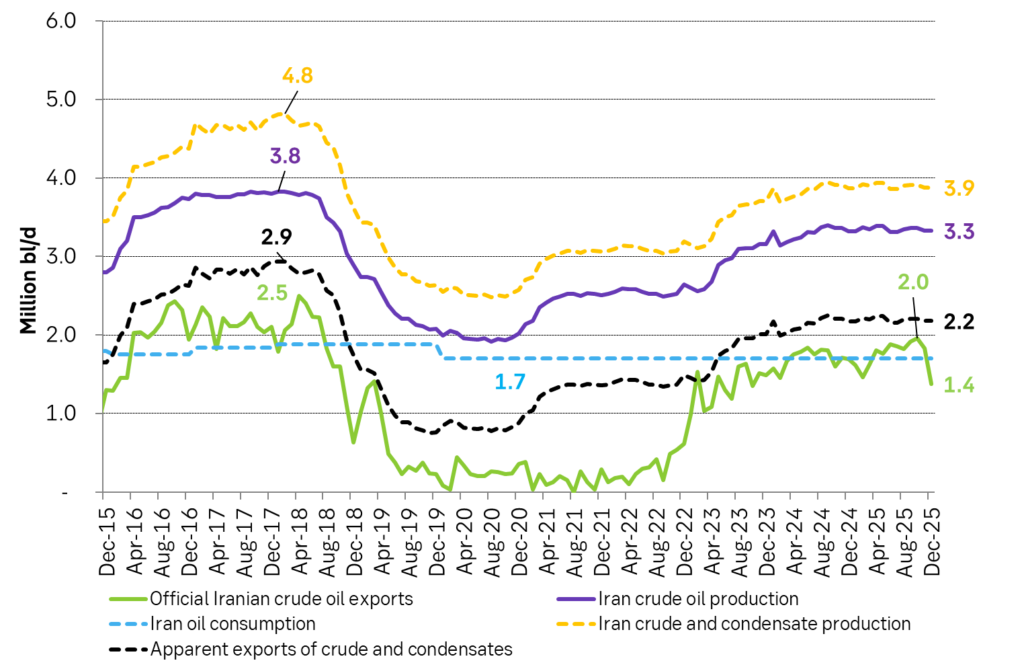
Iran officially exported 1.75 mb/d of crude on average in 2025 falling sharply to 1.4 mb/d in December. But it also produces condensates. Probably in the magnitude of 0.5-0.6 mb/d. Total production of crude and condensates probably close to 3.9 mb/d.
The price of heavy, sour fuel oil has fallen sharply versus Brent crude the latest days in response to the prospect of more heavy sour crude from Venezuela.


Ett samtal om ädelmetaller ur ett längre perspektiv
Physical easing. Iran risk easing. But Persian Gulf risk cannot fully fade before US war ships are pulled away

Under 2025 byggde Kina klart 78 GW ny kolkraft

Samtal om den senaste tidens råvarurörelser

Kall och nederbördsfattig månad driver upp elpriset

Silverpriset stiger över 100 USD per uns

Guldpriset stiger till över 5000 USD per uns

Samtal om guld och andra råvaror när flera priser rusar i höjden

Christian Kopfer om marknadens olika råvaror

Silver utgör nu 30 procent av kostnaden för att producera solcellspaneler
-
 Nyheter4 veckor sedan
Silverpriset stiger över 100 USD per uns
-
 Nyheter3 veckor sedan
Guldpriset stiger till över 5000 USD per uns
-
 Nyheter3 veckor sedan
Samtal om guld och andra råvaror när flera priser rusar i höjden
-
 Nyheter4 veckor sedan
Christian Kopfer om marknadens olika råvaror
-
 Nyheter3 veckor sedan
Silver utgör nu 30 procent av kostnaden för att producera solcellspaneler
-
 Nyheter2 veckor sedan
Kall och nederbördsfattig månad driver upp elpriset
-

 Nyheter3 veckor sedan
Indien kommer inte att göra slut med kol
-

 Nyheter3 veckor sedan
Kylan lyfter elpriset i vinter, minst 40 procent högre än väntat