

Analys
SEB – Råvarukommentarer vecka 12 2012
Sammanfattning: Föregående vecka
 Brett råvaruindex: +0,67 %
UBS Bloomberg CMCI TR Index- Energi: +0,36 %
UBS Bloomberg CMCI Energy TR Index - Ädelmetaller: -3,57 %
UBS Bloomberg CMCI Precious Metals TR Index - Industrimetaller: +0,13 %
UBS Bloomberg CMCI Industrial Metals TR Index - Jordbruk: +2,66 %
UBS Bloomberg CMCI Agriculture TR Index
Kortsiktig marknadssyn:
- Guld: Köp
- Olja: Neutral/köp
- Koppar: Sälj
- Majs: Neutral/köp
- Vete: Neutral/köp
Guld
 och spekulativa positioner")
- Guldpriset föll kraftigt efter Feds möte onsdagen förra veckan där Bernanke inte nämnde något om ytterligare stimulanser. Fed lyfte istället fram förbättringar i arbetsmarknaden. Dollarn stärktes på beskedet och guldpriset föll till 1663 dollar per troy ounce, den lägsta nivån sedan slutet av januari. På torsdagen föll guldpriset ytterligare till 1635 dollar och bröt därmed igenom viktiga stödnivåer.
- Enligt Financial Times har BIS ”the Bank for International Settlement ” köpt cirka fem ton guld i OTC-marknaden förra veckan.
- Enligt US Mint har redan 23 500 American Eagle guldmynt sålts under mars månad vilket är mer än vad som såldes under hela februari. Fysiska guld ETF: er uppgår enligt Bloomberg till 2 409,5 ton, en ny rekordnivå.
- Vi ser det kraftiga prisfallet som varit som en möjlighet att bygga upp positioner.
- Teknisk Analys: Vår bedömning är att marknaden befinner sig i slutfasen av innevarande nedgång och precis som vid tidigare korrektioner bör en förnyad uppgångsfas ta sin början från framför allt 233-dagarsbandet eller strax därunder. Ett brott tillbaka över 55-dagars medelvärdesband bekräftar därefter vändningen uppåt. Över 1725/40 kan vi med stor säkerhet peka på ett nytt mål runt 2070.

Olja

- Brent priset steg 0,80 procent förra veckan. Geopolitisk risk och spänningar kring Iran fortsätter att oroa marknaden. Saudiarabien har låtit meddela att man kommer att kompensera för utebliven oljeexport från Iran samtidigt som det är osäkert hur stor reservkapacitet landet egentligen har.
- Priset på Brentolja återhämtade sig på fredagen efter torsdagen då priset föll kraftigt efter nyheten att Storbritannien och USA skulle ha en överenskommelse om att släppa lös sina strategiska oljelager för att på så sätt stävja att höga bränslepriser hämmar den ekonomiska tillväxten. Nyheten har dock dementerats av USA.
- Amerikanska energidepartementet DOE presenterade statistik som visade att lagren av råolja steg mer än förväntat. Enligt IEA bör OPEC producera 30,1 fat olja per dag 2012 vilket faktiskt är mindre än de 31,4 miljoner fat som OPEC idag producerar per dag.
- Teknisk Analys: Förra veckans fråga huruvida vi hade en topp på plats får nog för närvarande besvaras nekande. Det ser mer ut som om vi konsoliderar snarare än korrigerar, varför det sannolikt finns en topp kvar i området 129/131. Under 121 börjar nedsidan vinna förtroende, men bara under 119 pekar på en avslutad uppgångsfas.

Koppar

- LME lager fortsätter att sjunka och är snart på de låga nivåer vi såg i slutet av 2008.
- Oro för utvecklingen i Kina präglar kopparmarknaden igen. I Kina gick premiärminister Wen Jiabao ut med budskapet att fastighetssektorn är övervärderad, framförallt i landets storstäder och att man därför kommer att föra en politik som dämpar marknaden vilket kan innebära mindre ekonomiska stimulanser. Kina och USA är världens två största kopparkonsumenter.
- Dollarn stärktes efter Fed räntebesked där räntan lämnades oförändrad och förväntas ligga kvar på dessa låga nivåer en längre tid. Trots att statistik från USA visar på en försiktig återhämtning och att den akuta krisen i Europa för tillfället dämpats genom stödlån till Grekland så dominerar för tillfället oron över den kinesiska ekonomin kopparmarknaden.
- Teknisk Analys: För tredje gången testar vi nu det fallande 233-dagarsbandet (efter ånyo en bortstötning från 55-dagarsbandet). Frågan som måste ställas är om vi är i slutfasen av att skapa en triangel. En triangel skulle definitivt försena det negativa utfall vi målat in under 2012 då trianglar faller i kategorin fortsättningsmönster. Eftersom vi gått in i triangeln underifrån så skall den följaktligen bryta uppåt (över 8695 bekräftar 9250-ish).

Majs

- Vår kortsiktiga vy om en fortsatt svag uppgång visade sig stämma väl under föregående vecka. En del spekulanter hade inför WASDE-rapporten den 9/3 positionerat sig mot en högre än förväntad utbudsprognos och när detta inte besannades var dessa aktörer tvungna att ta stänga korta kontrakt, vilket hjälpte priset att stiga under förra veckan. Totalt sett kunde vi se en uppgång med 4,35 procent.
- Det stora samtalsämnet är dock fortsatt huruvida Kina har börjat köpa på sig stora volymer majs från USA. Detta har fått en del spekulanter att gå in i marknaden igen, vilket bedöms vara den primära drivkraften bakom förra veckans prisuppgång.
- Konferensen Global Grain Asia 2012 gick av stapeln i Singapore under förra veckan. Enligt en representant från kinesiska myndigheter bedömer de inte att importbehovet bör öka i någon större omfattning de närmaste åren. Detta bör inte påverka marknaden den kommande veckan, men det är ändå intressant att se hur åsikterna går isär avseende landets behov, där flera stora spannmålsorganisationer istället ser ett kraftigt ökat behov från Kina.
- Enligt CME tror många analytiker att vi kortsiktigt bör kunna se bibehållna eller något högre priser, detta baserat på en generell tro att USDA överskattar den amerikanska skörden.
- Vi väljer att bibehålla vår kortsiktigt något positiva syn på majspriset. Detta bland annat baserat på det faktum att de inhemska kinesiska majspriserna fortsätter att stiga.
- Teknisk Analys: Andra försöket att bryta trendlinjen lyckades betydligt bättre än det första som ju ”spikade” ovanför linjen. Brottet har satt igång en rörelse som borde kunna ta oss upp över 233-dagarsbandet. Givet brottet av trendlinjen har vi också antagit en mer positiv vy gentemot majsmarknaden.

Vete

- I samband med att USDA:s jordbruksrapport kom ut förra fredagen blev nog många förvånade när de justerade ned sin prognos på de globala vetelagren för 2012. Detta tryckte förra veckan upp vetepriset i både Chicago och Paris, där det europeiska priset ökade med nästan 2,5 procent.
- Den franska analysfirman Tallage justerade i sin Stratégie grains-rapport från i torsdags ned sin förväntansbild på den europeiska veteskörden för skördeåret 2012-2013. Nu spekuleras det allt mer kring hur hårt köldknäppen i Europa under februari faktiskt kommer att slå mot den kommande skörden.
- Många oroar sig i nuläget för att stora delar av det amerikanska vintervete som börjar skördas i vår kan påverkas av snabba temperaturförändringar. Under de senaste veckorna har det varit ovanligt varmt väder i flera av de veteproducerande staterna, vilket har påskyndat utvecklingen för vetet i marken och gjort det extra känsligt för kyla. Klarar områdena under de kommande veckorna sig från för låga temperaturer bör dock skörden av vintervete i USA kunna bli omfattande detta år.
- Precis som för majspriset förhåller vi oss kortsiktigt fortsatt svagt positiva till vetepriset. Huruvida skördarna blir bättre eller sämre än förväntat får vi bättre klarhet i inom några veckor. Osäkerheten är i nuläget stor.
- Teknisk Analys: I och med brottet över B-vågens topp har vi bekräftat att nya toppar är på väg. Ett teoretiskt mål torde återfinnas runt €245. Nuvarande stopp, 199, kan nu justeras upp till 203.25.

[box]SEB Veckobrev Veckans råvarukommentar är producerat av SEB Merchant Banking och publiceras i samarbete och med tillstånd på Råvarumarknaden.se[/box]
Disclaimer
The information in this document has been compiled by SEB Merchant Banking, a division within Skandinaviska Enskilda Banken AB (publ) (“SEB”).
Opinions contained in this report represent the bank’s present opinion only and are subject to change without notice. All information contained in this report has been compiled in good faith from sources believed to be reliable. However, no representation or warranty, expressed or implied, is made with respect to the completeness or accuracy of its contents and the information is not to be relied upon as authoritative. Anyone considering taking actions based upon the content of this document is urged to base his or her investment decisions upon such investigations as he or she deems necessary. This document is being provided as information only, and no specific actions are being solicited as a result of it; to the extent permitted by law, no liability whatsoever is accepted for any direct or consequential loss arising from use of this document or its contents.
About SEB
SEB is a public company incorporated in Stockholm, Sweden, with limited liability. It is a participant at major Nordic and other European Regulated Markets and Multilateral Trading Facilities (as well as some non-European equivalent markets) for trading in financial instruments, such as markets operated by NASDAQ OMX, NYSE Euronext, London Stock Exchange, Deutsche Börse, Swiss Exchanges, Turquoise and Chi-X. SEB is authorized and regulated by Finansinspektionen in Sweden; it is authorized and subject to limited regulation by the Financial Services Authority for the conduct of designated investment business in the UK, and is subject to the provisions of relevant regulators in all other jurisdictions where SEB conducts operations. SEB Merchant Banking. All rights reserved.

Down 4.4% last week with more from OPEC+, a possible truce in Ukraine and weak US data. Brent crude fell 4.4% last week with a close of the week of USD 66.59/b and a range of USD 65.53-69.98/b. Three bearish drivers were at work. One was the decision by OPEC+ V8 to lift its quotas by 547 kb/d in September and thus a full unwind of the 2.2 mb/d of voluntary cuts. The second was the announcement that Trump and Putin will meet on Friday 15 August to discuss the potential for cease fire in Ukraine (without Ukraine). I.e. no immediate new sanctions towards Russia and no secondary sanctions on buyers of Russian oil to any degree that matters for the oil price. The third was the latest disappointing US macro data which indicates that Trump’s tariffs are starting to bite. Brent is down another 1% this morning trading close to USD 66/b. Hopes for a truce on the horizon in Ukraine as Putin meets with Trump in Alaska in Friday 15, is inching oil lower this morning.

Trump – Putin meets in Alaska. The potential start of a process. No disruption of Russian oil in sight. Trump has invited Putin to Alaska on 15 August to discuss Ukraine. The first such invitation since 2007. Ukraine not being present is bad news for Ukraine. Trump has already suggested ”swapping of territory”. This is not a deal which will be closed on Friday. But rather a start of a process. But Trump is very, very unlikely to slap sanctions on Russian oil while this process is ongoing. I.e. no disruption of Russian oil in sight.
What OPEC+ is doing, what it is saying and what we are hearing. OPEC+ V8 is done unwinding its 2.2 mb/d in September. It doesn’t mean production will increase equally much. Since it started the unwind and up to July (to when we have production data), the increase in quotas has gone up by 1.4 mb/d, while actual production has gone up by less than 0.7 mb/d. Some in the V8 group are unable to increase while others, like Russia and Iraq are paying down previous excess production debt. Russia and Iraq shouldn’t increase production before Jan and Mar next year respectively.
We know that OPEC+ has spare capacity which it will deploy back into the market at some point in time. And with the accelerated time-line for the redeployment of the 2.2 mb/d voluntary cuts it looks like it is happening fast. Faster than we had expected and faster than OPEC+ V8 previously announced.
As bystanders and watchers of the oil market we naturally combine our knowledge of their surplus spare capacity with their accelerated quota unwind and the combination of that is naturally bearish. Amid this we are not really able to hear or believe OPEC+ when they say that they are ready to cut again if needed. Instead we are kind of drowning our selves out in a combo of ”surplus spare capacity” and ”rapid unwind” to conclude that we are now on a highway to a bear market where OPEC+ closes its eyes to price and blindly takes back market share whatever it costs. But that is not what the group is saying. Maybe we should listen a little.
That doesn’t mean we are bullish for oil in 2026. But we may not be on a ”highway to bear market” either where OPEC+ is blind to the price.
Saudi OSPs to Asia in September at third highest since Feb 2024. Saudi Arabia lifted its official selling prices to Asia for September to the third highest since February 2024. That is not a sign that Saudi Arabia is pushing oil out the door at any cost.
Saudi Arabia OSPs to Asia in September at third highest since Feb 2024

Lower as OPEC+ keeps fast-tracking redeployment of previous cuts. Brent closed down 1.3% yesterday to USD 68.76/b on the back of the news over the weekend that OPEC+ (V8) lifted its quota by 547 kb/d for September. Intraday it traded to a low of USD 68.0/b but then pushed higher as Trump threatened to slap sanctions on India if it continues to buy loads of Russian oil. An effort by Donald Trump to force Putin to a truce in Ukraine. This morning it is trading down 0.6% at USD 68.3/b which is just USD 1.3/b below its July average.
Only US shale can hand back the market share which OPEC+ is after. The overall picture in the oil market today and the coming 18 months is that OPEC+ is in the process of taking back market share which it lost over the past years in exchange for higher prices. There is only one source of oil supply which has sufficient reactivity and that is US shale. Average liquids production in the US is set to average 23.1 mb/d in 2025 which is up a whooping 3.4 mb/d since 2021 while it is only up 280 kb/d versus 2024.
Taking back market share is usually a messy business involving a deep trough in prices and significant economic pain for the involved parties. The original plan of OPEC+ (V8) was to tip-toe the 2.2 mb/d cuts gradually back into the market over the course to December 2026. Hoping that robust demand growth and slower non-OPEC+ supply growth would make room for the re-deployment without pushing oil prices down too much.
From tip-toing to fast-tracking. Though still not full aggression. US trade war, weaker global growth outlook and Trump insisting on a lower oil price, and persistent robust non-OPEC+ supply growth changed their minds. Now it is much more fast-track with the re-deployment of the 2.2 mb/d done already by September this year. Though with some adjustments. Lifting quotas is not immediately the same as lifting production as Russia and Iraq first have to pay down their production debt. The OPEC+ organization is also holding the door open for production cuts if need be. And the group is not blasting the market with oil. So far it has all been very orderly with limited impact on prices. Despite the fast-tracking.
The overall process is nonetheless still to take back market share. And that won’t be without pain. The good news for OPEC+ is of course that US shale now is cooling down when WTI is south of USD 65/b rather than heating up when WTI is north of USD 45/b as was the case before.
OPEC+ will have to break some eggs in the US shale oil patches to take back lost market share. The process is already in play. Global oil inventories have been building and they will build more and the oil price will be pushed lower.
A Brent average of USD 60/b in 2026 implies a low of the year of USD 45-47.5/b. Assume that an average Brent crude oil price of USD 60/b and an average WTI price of USD 57.5/b in 2026 is sufficient to drive US oil rig count down by another 100 rigs and US crude production down by 1.5 mb/d from Dec-25 to Dec-26. A Brent crude average of USD 60/b sounds like a nice price. Do remember though that over the course of a year Brent crude fluctuates +/- USD 10-15/b around the average. So if USD 60/b is the average price, then the low of the year is in the mid to the high USD 40ies/b.
US shale oil producers are likely bracing themselves for what’s in store. US shale oil producers are aware of what is in store. They can see that inventories are rising and they have been cutting rigs and drilling activity since mid-April. But significantly more is needed over the coming 18 months or so. The faster they cut the better off they will be. Cutting 5 drilling rigs per week to the end of the year, an additional total of 100 rigs, will likely drive US crude oil production down by 1.5 mb/d from Dec-25 to Dec-26 and come a long way of handing back the market share OPEC+ is after.
The OPEC+ subgroup V8 this weekend decided to fully unwind their voluntary cut of 2.2 mb/d. The September quota hike was set at 547 kb/d thereby unwinding the full 2.2 mb/d. This still leaves another layer of voluntary cuts of 1.6 mb/d which is likely to be unwind at some point.
Higher quotas however do not immediately translate to equally higher production. This because Russia and Iraq have ”production debts” of cumulative over-production which they need to pay back by holding production below the agreed quotas. I.e. they cannot (should not) lift production before Jan (Russia) and March (Iraq) next year.
Argus estimates that global oil stocks have increased by 180 mb so far this year but with large skews. Strong build in Asia while Europe and the US still have low inventories. US Gulf stocks are at the lowest level in 35 years. This strong skew is likely due to political sanctions towards Russian and Iranian oil exports and the shadow fleet used to export their oil. These sanctions naturally drive their oil exports to Asia and non-OECD countries. That is where the surplus over the past half year has been going and where inventories have been building. An area which has a much more opaque oil market. Relatively low visibility with respect to oil inventories and thus weaker price signals from inventory dynamics there.
This has helped shield Brent and WTI crude oil price benchmarks to some degree from the running, global surplus over the past half year. Brent crude averaged USD 73/b in December 2024 and at current USD 69.7/b it is not all that much lower today despite an estimated global stock build of 180 mb since the end of last year and a highly anticipated equally large stock build for the rest of the year.
What helps to blur the message from OPEC+ in its current process of unwinding cuts and taking back market share, is that, while lifting quotas, it is at the same time also quite explicit that this is not a one way street. That it may turn around make new cuts if need be.
This is very different from its previous efforts to take back market share from US shale oil producers. In its previous efforts it typically tried to shock US shale oil producers out of the market. But they came back very, very quickly.
When OPEC+ now is taking back market share from US shale oil it is more like it is exerting a continuous, gradually increasing pressure towards US shale oil rather than trying to shock it out of the market which it tried before. OPEC+ is now forcing US shale oil producers to gradually back off. US oil drilling rig count is down from 480 in Q1-25 to now 410 last week and it is typically falling by some 4-5 rigs per week currently. This has happened at an average WTI price of about USD 65/b. This is very different from earlier when US shale oil activity exploded when WTI went north of USD 45/b. This helps to give OPEC+ a lot of confidence.
Global oil inventories are set to rise further in H2-25 and crude oil prices will likely be forced lower though the global skew in terms of where inventories are building is muddying the picture. US shale oil activity will likely decline further in H2-25 as well with rig count down maybe another 100 rigs. Thus making room for more oil from OPEC+.


Bönder i USA får hela tiden ut mer majs per hektar

NKT tillverkar elkablar som kan överföra 1 GW, har orderstock på 10 miljarder euro

CATL pausar stor litiumgruva, kan ge prishöjningar på marknaden

Omgående mångmiljardfiasko för Equinors satsning på Ørsted och vindkraft
What OPEC+ is doing, what it is saying and what we are hearing

USA inför 93,5 % tull på kinesisk grafit

Fusionsföretag visar hur guld kan produceras av kvicksilver i stor skala – alkemidrömmen ska bli verklighet

Westinghouse planerar tio nya stora kärnreaktorer i USA – byggstart senast 2030

Kopparpriset i fritt fall i USA efter att tullregler presenterats

Ryska militären har skjutit ihjäl minst 11 guldletare vid sin gruva i Centralafrikanska republiken
-
 Nyheter4 veckor sedan
USA inför 93,5 % tull på kinesisk grafit
-
 Nyheter3 veckor sedan
Fusionsföretag visar hur guld kan produceras av kvicksilver i stor skala – alkemidrömmen ska bli verklighet
-
 Nyheter4 veckor sedan
Westinghouse planerar tio nya stora kärnreaktorer i USA – byggstart senast 2030
-
 Nyheter2 veckor sedan
Kopparpriset i fritt fall i USA efter att tullregler presenterats
-
 Nyheter3 veckor sedan
Ryska militären har skjutit ihjäl minst 11 guldletare vid sin gruva i Centralafrikanska republiken
-
 Nyheter2 veckor sedan
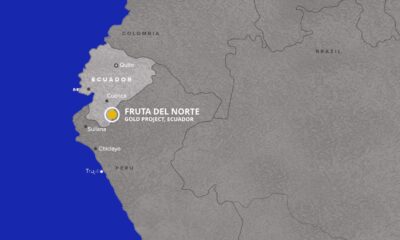
Lundin Gold rapporterar enastående borrresultat vid Fruta del Norte
-
 Nyheter2 veckor sedan
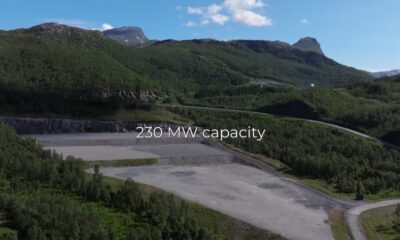
Stargate Norway, AI-datacenter på upp till 520 MW etableras i Narvik
-

 Nyheter4 veckor sedan
Kina skärper kontrollen av sällsynta jordartsmetaller, vill stoppa olaglig export