

Analys
SEB – Råvarukommentarer, 5 maj 2014

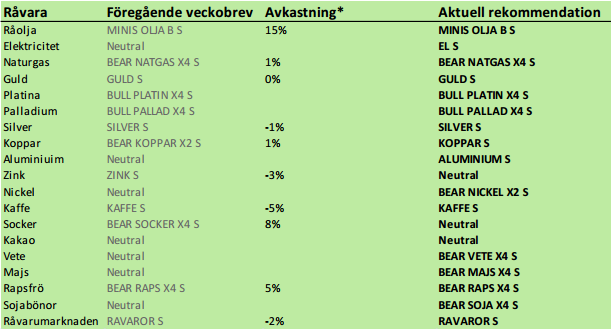
Rekommendationer
Kort sammanfattning
Det är verkligen hög tid att köpa ädelmetaller, trots ”tapering” och bra arbetsmarknadsstatistik i USA. Ädelmetallerna har priser som är i nivå med den genomsnittliga produktionskostnaden och oron i Ukraina, dvs mellan Ryssland och Västvärlden är en faktor som kan driva priset uppåt. Vår rangordning av ädelmetallerna är platina, palladium, silver och guld. De två senare är de som normalt brukar efterfrågas vid geopolitisk oro.
Kopparmarknaden har en liknande situation, med ett pris som är i nivå med produktionskostnaden och dessutom sjunkande lager, som nu hunnit bli ganska låga i ett historiskt perspektiv.
Vetepriset handlades upp i fredags efter förnyad oro för situationen i Ukraina. Däremot ser väderleksprognoserna för alla veteodlande regioner utom Kansas och Texas bättre ut än på flera år. Egyptens GASC köpte också vete från Ukraina och Ryssland, där riskpremien för Ukraina var 1% på priset. Det visar att marknaden för vete fokuserar allt för mycket på Ukrainas problem (vädret och vetet är i perfekt skick) och för lite på vad som faktiskt påverkar marknadens utbud och efterfrågan – och därmed priset. Diskrepansen mellan det pris marknaden har bildat genom fel fokus å ena sidan och jordnära realiteter å den andra, gör att vi rekommenderar sälj på vete. Vädret är gynnsamt för majs också. Sådden i USA är inte sen och som utvecklingen i vädret ter sig nu, kan sådden t o m bli snabbare avklarad än normalt.
Råolja – Brent
Oljepriset föll tillbaka i veckan innan det repade sig till 108.59 vid stängning i fredags. Det är de växlande beskeden från Libyen som marknaden handlar på, bland annat.
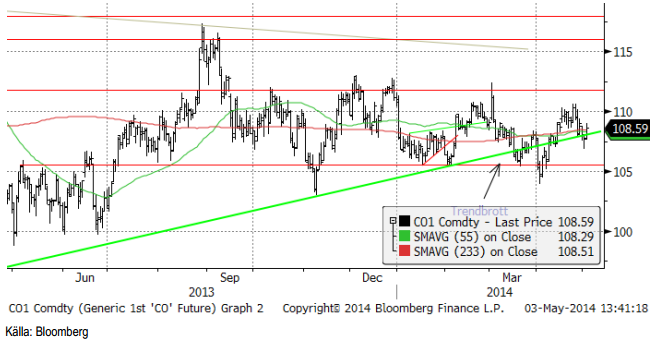
Råoljelagren i USA nådde rekordnivå. Lagren vid guldkusten är överfulla pga att produktionen ökat mycket mer än pipelinesystemen byggts ut och raffinaderikapaciteten likaså. Därför har det de senaste månaderna talats om att tillåta export av råolja från USA, men det är bättre ekonomi i att raffinera olja till produkter i USA än att exportera olja t ex till EU för att raffinera den här. I USA finns billig naturgas, som dels kan användas för att uppgradera oljan till lättare kolväten och dels användas som värmekälla i processen.
Importen sjönk från förra veckan; högre import var alltså inte heller den här veckan den drivande faktorn bakom de rekordhöga lagren.
Krisen i Ukraina och Libyens problem innebär två saker. För det första skjuts prisfallet i olja lite på framtiden. För det andra stimuleras spridning av fracking ännu mer, vilket innebär att prisfallet blir ännu djupare när det kommer.
Vi rekommenderar en kort position i olja, t ex med MINIS OLJA B S eller MINIS OLJA A S.
Elektricitet
Elpriset gick i veckan över trendlinjen och vi har då enligt det förra veckobrevet en köprekommendation. Väderleksprognosen enligt GFS-modellen (se nedan under odlingsväder) för de norsk-svenska fjällen ser dock blötare ut än normalt. Om det blir en rekyl nedåt i elpriset kan det vara ett bra tillfälle att gå lång marknaden.
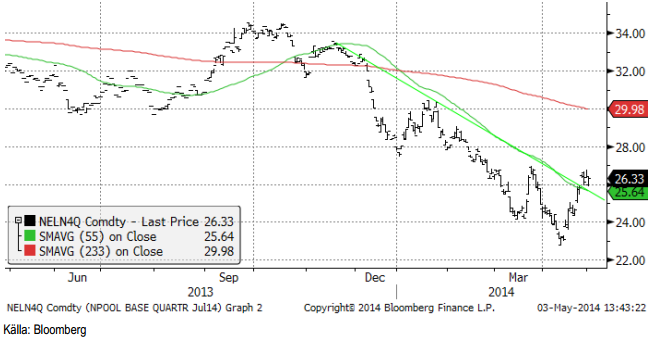
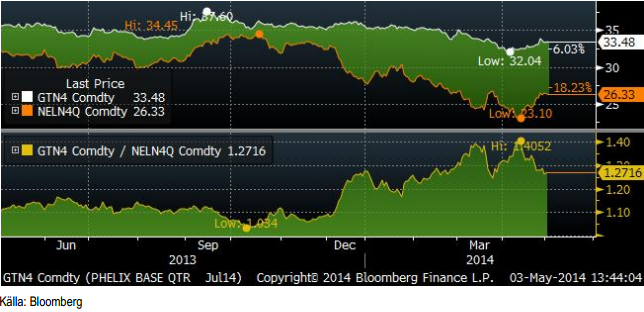
Spreaden mellan Phelix Baseload för det tredje kvartalet och Nasdaqs motsvarande har gått i hop 1% sedan förra veckan, från 28% skillnad till 27% skilllnad. Nordisk el är dock fortfarande ”billig” i förhållande till tysk el.
Priset på kol har rört sig uppåt, men utan större dynamik i rörelsen, varför man kan förvänta sig en rekyl nedåt.
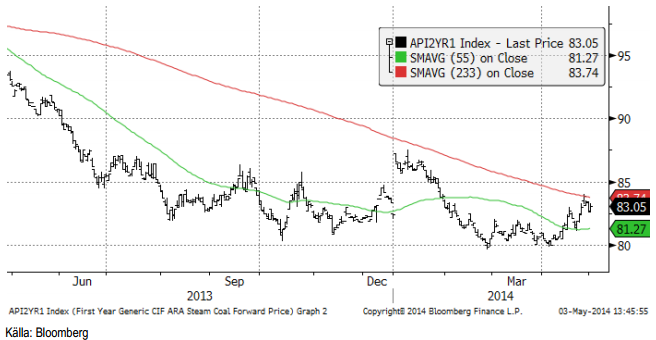
Vi har alltså gått över till köprekommendation, men tycker att man helst ska invänta en rekyl nedåt för att köpa till bättre nivå.
Naturgas
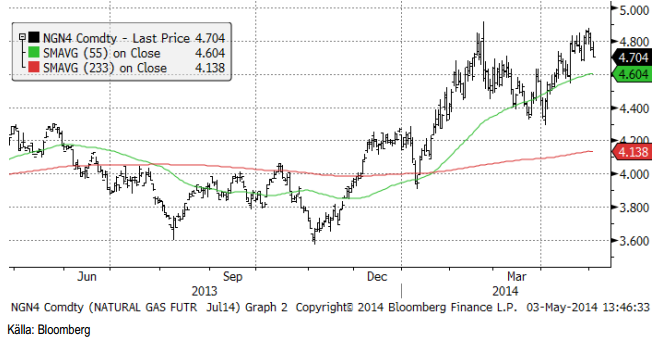
Priset på naturgas har hängt sig kvar vid 4.80 dollar per MMBtu. Att priset inte orkat gå högre än pristoppen i februari, trots ytterligare en veckas försök, får tolkas som ytterligare en negativ signal.
Från USA rapporteras att t ex Marcellusfältet producerar mer naturgas än det finns möjlighet att transportera därifrån via pipelines. Fracking har alltså varit mer framgångsrik än vad logistiken hunnit med att ta hand om. Det är en situation som känns igen från den första oljeruschen i Pennsylvania på 1860-talet och från oljeruschen i Iran, Irak i början av 1900-talet och Saudiarabien vid mitten av 1900-talet. Nyckeln till framgång och förmögenhetsbildning flyttas från den glamorösa oljerushen till den tråkiga pipeline-affären.
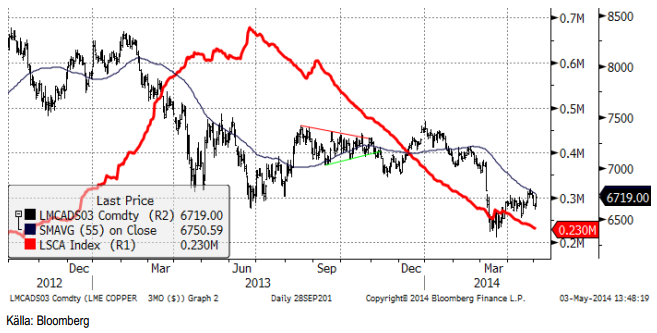
Koppar
Det börjar uppmärksammas att lagernivåerna fallit ett längre tag och att trenden håller i sig, trots de ganska låga nivåerna i ett historiskt perspektiv. Ett pris på 6500 dollar per ton är vad det kostar att producera koppar hos Codelco i Chile. Dagens priser är därför förmodligen nära botten.
Vi håller fast vid en köprekommendation på koppar.
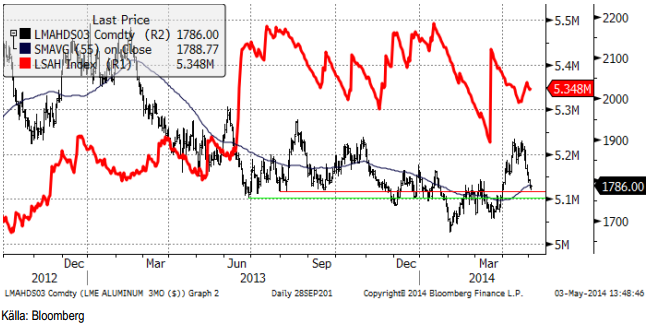
Aluminium
Förra veckan hade vi neutral på aluminium. Tekniskt har den fallande trenden brutits, men sedan kom veckans kraftiga rekyl. Lagernivåerna är fortfarande mycket höga och det kommer att ta tid, lång tid, att beta av lagren. Priset är nere på en stödnivå efter veckans ras och det är möjligt att det kan komma en rekyl uppåt från den här nivån. Vi gör därför över till kortsiktigt köp, som rekommendation.
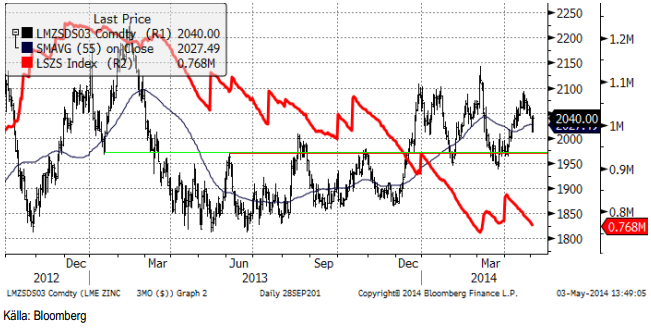
Zink
Zinkpriset har sedan kursrusningen under slutet av förra året, etablerat sig i ett prisintervall med det gamla taket som golv. Golvet finns vid ca 1975 dollar och taket vid 2100 dollar. Den långsiktiga trenden är dock uppåtriktad. Man gör bäst i att försöka köpa certifikat på zink nära golvet på prisintervallet, men generellt sett har vi köprekommendation.
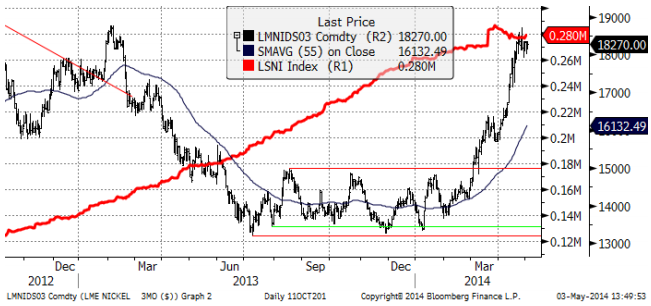
Nickel
Nickelpriset har rusat iväg på ett fenomenalt sätt och nådde för en vecka sedan upp till en gammal toppnivå vid 18500 dollar per ton, senast noterad för drygt ett år sedan. Vi kan inte hitta motiv till en så här stor och snabb prisuppgång, även med hänsyn till Indonesiens exportförbud av obearbetad malm och risken för exportproblem från Ryssland. Vi har haft neutral rekommendation under den senare delen av uppgången och går nu över till säljrekommendation.
Guld
Guldpriset fick stöd av den förnyade oron i Ukraina. Vi kallar det som händer för ”oro”, men det handlar i själva verket om krig mellan Ukraina och Ryssland. Dels har gatudemonstranterna på den pro-ryska sidan toppmoderna versioner av AK-47 och dels har de inte bara knölpåkar utan även luftvärnsmissilsystem och kunskap att skjuta träffsäkert med dem. Årsdagen av Rysslands seger i det andra världskriget infaller i veckan som kommer, vilket kan öka entusiasmen från den sidan. Det kan och borde ge guldmarknaden en ökad lyster.
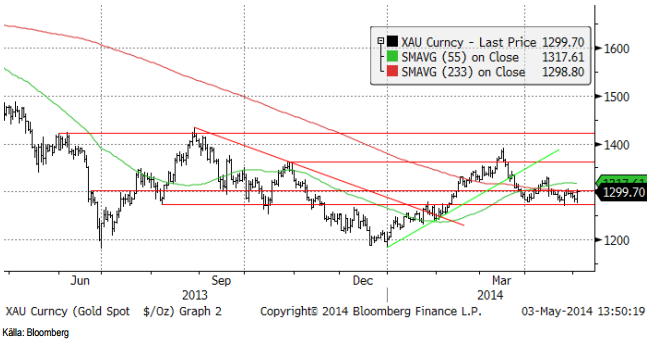
Vi rekommenderar köp av GULD S.
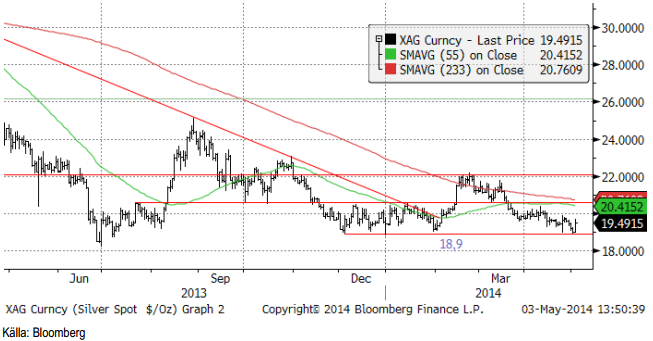
Silver
Silverpriset fann som väntat stöd på 18.9 dollar per finuns. Eftersom silverpriset är lågt i en historisk jämförelse med guldpriset, föredrar vi silver framför guld.
Nedan ser vi ett diagram över priset på guld uttryckt i silver. Det går alltså över 66 finuns silver på varje fin-uns av guld. Som vi ser är det en hög nivå, dvs silver är billigt i förhållande till guld.
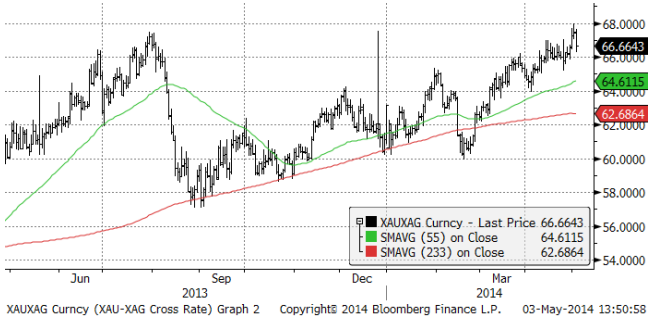
Vi anser att silver är mer köpvärt än guld och skulle vilja köpa på de här nivåerna. Vi rekommenderar köp av SILVER S.
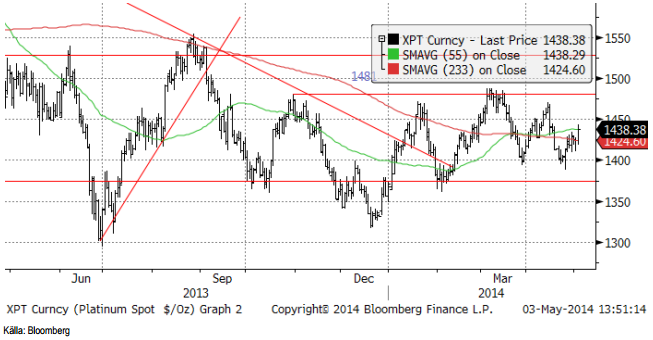
Platina & Palladium
Platina påverkades också av ”oroligheterna” i Ukraina, liksom guld och silver. Till platinas fördel talar också den omöjliga situationen i Sydafrika. Gruvbolagen går inte runt och gruvarbetarna vill ha mer betalt. Det kan bara sluta med att det kommer att produceras mindre platina till ett högre pris. Någon annan utgång finns inte.
Den mycket inflytelserika analysfirman GFMS, som nuförtiden är en del av Reuters, publicerade sin årsvisa Platinum and Palladium Survey i fredags. Rapportens innehåll återspeglar samma sak jag sagt länge i det här veckobrevet – lite drygt hälften av gruvorna går med vinst. En stor del gör det inte. Det är inte en långsiktigt hållbar marknadsbalans. Produktionen måste ner. Därmed kommer priset att stiga.
Priset på palladium har också fortsatt att sega sig uppåt. Arbetsmarknadsstatistiken från USA i fredags var oväntat positiv. Fler personer i sysselsättning innebär sannolikt fler bilar och därmed mer palladium i katalysatorer, totalt sett.
Vi rekommenderar köp av PLATINA S och PALLADIUM S, eller BULL PLATINA X4 S eller BULL PALLAD X4 S.
För den som vill ta ännu mer risk, finns nu även BULL PALLAD X5 S.
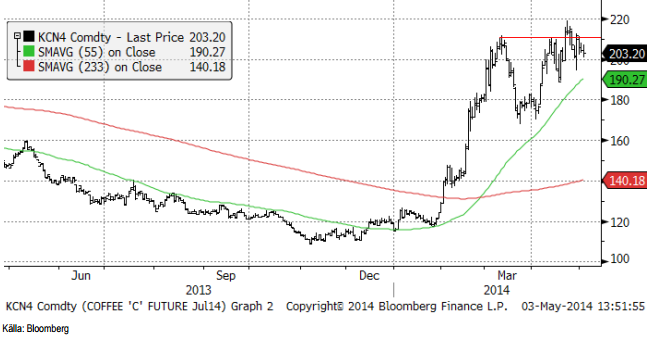
Kaffe
Ur teknisk synvinkel ser kaffemarknaden ut att ha gått in i en konsolieeringsfas, eller en toppformation. För att behålla den stigande pristrenden måste marknaden ta ut toppen på 220 cent per pund. Det ser marknaden inte ut att vara i begrepp att göra.
När allt fokus har varit på torkan i Brasilien har en ny fara för global kaffeproduktion dykt upp. El Niño väntas slå till i juli och enligt sex av sju klimatmodeller väntas den växa i styrka under hösten. På norra halvklotet börjar skörden av kaffe i september och oktober. El Niño skapar torka i länder som Australien, Indonesien och Vietnamn. De två senare är stora producenter av robusta-kaffe. Nedan ser vi hur Southern Oscillation Index har utvecklat sig sedan 1960. Ett SOI > 8.5 innebär La Niña och SOI < -8.5 innebär El Niño.
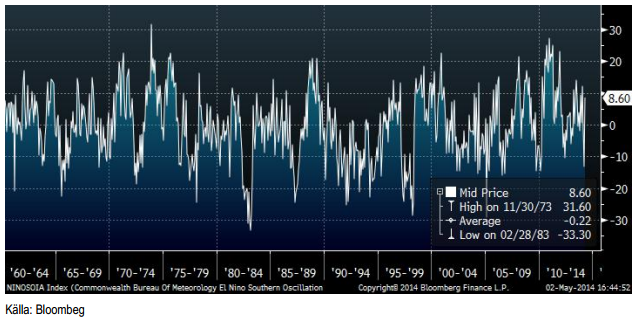
Vi tar dessa noteringar och identifierar när det varit torka före skörd i Indonesien och testar statistiskt för effekten på Indonesiens kaffeproduktion dessa år. Jag väljer Indonesien istället för Vietnam, världens största producent, eftersom Vietnams kaffeproduktion blommade ut ganska sent, efter Vietnamnkrigets slut 1975. Indonesien har haft en ganska stabil produktion.
En statistiskt körning visar att Indonesiens produktion minskar med nästan 5% när det varit El Niño och det estimatet är nästan statistiskt signifikant på 5% nivån. I vart fall tillräckligt för att vi ska ta det som helt säkert att det kommer att bli en mindre produktion i år. Detta var alltså Indonesien, men det ser säkerligen likadant ut för Vietnam.
5% mindre produktion av robusta, utöver ett produktionsbortfall på ca 20% från Brasilien bör ha en ytterligare prisdrivande effekt på marknadspriset, även om det rent tekniskt inte ser så ut just nu.
Vi rekommenderar köp av KAFFE S, men man bör ta stoppen om kaffepriset går under 200 cent.
Kakao
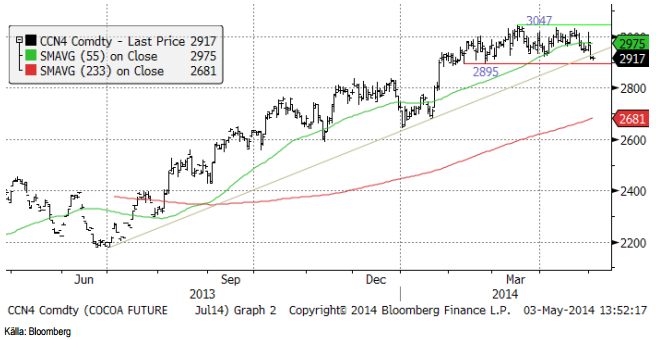
Priset på kakao ligger i ett etablerat prisintervall med botten på 2895 och tak på 3047. Dynamiken verkar vara på nedsidan i prisrörelserna, men i fredags fick marknaden stöd när priset var nära botten på prisintervallet. Vi fortsätter med neutral vy till dess golvet vid 2895 inte bryts.
[box]SEB Veckobrev Veckans råvarukommentar är producerat av SEB Merchant Banking och publiceras i samarbete och med tillstånd på Råvarumarknaden.se[/box]
Disclaimer
The information in this document has been compiled by SEB Merchant Banking, a division within Skandinaviska Enskilda Banken AB (publ) (“SEB”).
Opinions contained in this report represent the bank’s present opinion only and are subject to change without notice. All information contained in this report has been compiled in good faith from sources believed to be reliable. However, no representation or warranty, expressed or implied, is made with respect to the completeness or accuracy of its contents and the information is not to be relied upon as authoritative. Anyone considering taking actions based upon the content of this document is urged to base his or her investment decisions upon such investigations as he or she deems necessary. This document is being provided as information only, and no specific actions are being solicited as a result of it; to the extent permitted by law, no liability whatsoever is accepted for any direct or consequential loss arising from use of this document or its contents.
About SEB
SEB is a public company incorporated in Stockholm, Sweden, with limited liability. It is a participant at major Nordic and other European Regulated Markets and Multilateral Trading Facilities (as well as some non-European equivalent markets) for trading in financial instruments, such as markets operated by NASDAQ OMX, NYSE Euronext, London Stock Exchange, Deutsche Börse, Swiss Exchanges, Turquoise and Chi-X. SEB is authorized and regulated by Finansinspektionen in Sweden; it is authorized and subject to limited regulation by the Financial Services Authority for the conduct of designated investment business in the UK, and is subject to the provisions of relevant regulators in all other jurisdictions where SEB conducts operations. SEB Merchant Banking. All rights reserved.

Some rebound but not much. Brent crude rebounded 1.5% yesterday to $65.47/b. This morning it is inching 0.2% up to $65.6/b. The lowest close last week was on Thursday at $64.11/b.

The curve structure is almost as week as it was before the weekend. The rebound we now have gotten post the message from OPEC+ over the weekend is to a large degree a rebound along the curve rather than much strengthening at the front-end of the curve. That part of the curve structure is almost as weak as it was last Thursday.
We are still on a weakening path. The message from OPEC+ over the weekend was we are still on a weakening path with rising supply from the group. It is just not as rapidly weakening as was feared ahead of the weekend when a quota hike of 500 kb/d/mth for November was discussed.
The Brent curve is on its way to full contango with Brent dipping into the $50ies/b. Thus the ongoing weakening we have had in the crude curve since the start of the year, and especially since early June, will continue until the Brent crude oil forward curve is in full contango along with visibly rising US and OECD oil inventories. The front-month Brent contract will then flip down towards the $60/b-line and below into the $50ies/b.
At what point will OPEC+ turn to cuts? The big question then becomes: When will OPEC+ turn around to make some cuts? At what (price) point will they choose to stabilize the market? Because for sure they will. Higher oil inventories, some more shedding of drilling rigs in US shale and Brent into the 50ies somewhere is probably where the group will step in.
There is nothing we have seen from the group so far which indicates that they will close their eyes, let the world drown in oil and the oil price crash to $40/b or below.
The message from OPEC+ is also about balance and stability. The world won’t drown in oil in 2026. The message from the group as far as we manage to interpret it is twofold: 1) Taking back market share which requires a lower price for non-OPEC+ to back off a bit, and 2) Oil market stability and balance. It is not just about 1. Thus fretting about how we are all going to drown in oil in 2026 is totally off the mark by just focusing on point 1.
When to buy cal 2026? Before Christmas when Brent hits $55/b and before OPEC+ holds its last meeting of the year which is likely to be in early December.
Brent crude oil prices have rebounded a bit along the forward curve. Not much strengthening in the structure of the curve. The front-end backwardation is not much stronger today than on its weakest level so far this year which was on Thursday last week.

The front-end backwardation fell to its weakest level so far this year on Thursday last week. A slight pickup yesterday and today, but still very close to the weakest year to date. More oil from OPEC+ in the coming months and softer demand and rising inventories. We are heading for yet softer levels.

Down to the lowest since early May. Brent crude has fallen sharply the latest four days. It closed at USD 64.11/b yesterday which is the lowest since early May. It is staging a 1.3% rebound this morning along with gains in both equities and industrial metals with an added touch of support from a softer USD on top.
What stands out the most to us this week is the collapse in the Dubai one to three months time-spread.
Dubai is medium sour crude. OPEC+ is in general medium sour crude production. Asian refineries are predominantly designed to process medium sour crude. So Dubai is the real measure of the balance between OPEC+ holding back or not versus Asian oil demand for consumption and stock building.
A sharp weakening of the front-end of the Dubai curve. The front-end of the Dubai crude curve has been holding out very solidly throughout this summer while the front-end of the Brent and WTI curves have been steadily softening. But the strength in the Dubai curve in our view was carrying the crude oil market in general. A source of strength in the crude oil market. The core of the strength.
The now finally sharp decline of the front-end of the Dubai crude curve is thus a strong shift. Weakness in the Dubai crude marker is weakness in the core of the oil market. The core which has helped to hold the oil market elevated.
Facts supports the weakening. Add in facts of Iraq lifting production from Kurdistan through Turkey. Saudi Arabia lifting production to 10 mb/d in September (normal production level) and lifting exports as well as domestic demand for oil for power for air con is fading along with summer heat. Add also in counter seasonal rise in US crude and product stocks last week. US oil stocks usually decline by 1.3 mb/week this time of year. Last week they instead rose 6.4 mb/week (+7.2 mb if including SPR). Total US commercial oil stocks are now only 2.1 mb below the 2015-19 seasonal average. US oil stocks normally decline from now to Christmas. If they instead continue to rise, then it will be strongly counter seasonal rise and will create a very strong bearish pressure on oil prices.
Will OPEC+ lift its voluntary quotas by zero, 137 kb/d, 500 kb/d or 1.5 mb/d? On Sunday of course OPEC+ will decide on how much to unwind of the remaining 1.5 mb/d of voluntary quotas for November. Will it be 137 kb/d yet again as for October? Will it be 500 kb/d as was talked about earlier this week? Or will it be a full unwind in one go of 1.5 mb/d? We think most likely now it will be at least 500 kb/d and possibly a full unwind. We discussed this in a not earlier this week: ”500 kb/d of voluntary quotas in October. But a full unwind of 1.5 mb/d”
The strength in the front-end of the Dubai curve held out through summer while Brent and WTI curve structures weakened steadily. That core strength helped to keep flat crude oil prices elevated close to the 70-line. Now also the Dubai curve has given in.

Brent crude oil forward curves

Total US commercial stocks now close to normal. Counter seasonal rise last week. Rest of year?

Total US crude and product stocks on a steady trend higher.

Analys
OPEC+ will likely unwind 500 kb/d of voluntary quotas in October. But a full unwind of 1.5 mb/d in one go could be in the cards
Down to mid-60ies as Iraq lifts production while Saudi may be tired of voluntary cut frugality. The Brent December contract dropped 1.6% yesterday to USD 66.03/b. This morning it is down another 0.3% to USD 65.8/b. The drop in the price came on the back of the combined news that Iraq has resumed 190 kb/d of production in Kurdistan with exports through Turkey while OPEC+ delegates send signals that the group will unwind the remaining 1.65 mb/d (less the 137 kb/d in October) of voluntary cuts at a pace of 500 kb/d per month pace.
Signals of accelerated unwind and Iraqi increase may be connected. Russia, Kazakhstan and Iraq were main offenders versus the voluntary quotas they had agreed to follow. Russia had a production ’debt’ (cumulative overproduction versus quota) of close to 90 mb in March this year while Kazakhstan had a ’debt’ of about 60 mb and the same for Iraq. This apparently made Saudi Arabia angry this spring. Why should Saudi Arabia hold back if the other voluntary cutters were just freeriding? Thus the sudden rapid unwinding of voluntary cuts. That is at least one angle of explanations for the accelerated unwinding.
If the offenders with production debts then refrained from lifting production as the voluntary cuts were rapidly unwinded, then they could ’pay back’ their ’debts’ as they would under-produce versus the new and steadily higher quotas.
Forget about Kazakhstan. Its production was just too far above the quotas with no hope that the country would hold back production due to cross-ownership of oil assets by international oil companies. But Russia and Iraq should be able to do it.
Iraqi cumulative overproduction versus quotas could reach 85-90 mb in October. Iraq has however steadily continued to overproduce by 3-5 mb per month. In July its new and gradually higher quota came close to equal with a cumulative overproduction of only 0.6 mb that month. In August again however its production had an overshoot of 100 kb/d or 3.1 mb for the month. Its cumulative production debt had then risen to close to 80 mb. We don’t know for September yet. But looking at October we now know that its production will likely average close to 4.5 mb/d due to the revival of 190 kb/d of production in Kurdistan. Its quota however will only be 4.24 mb/d. Its overproduction in October will thus likely be around 250 kb/d above its quota with its production debt rising another 7-8 mb to a total of close to 90 mb.
Again, why should Saudi Arabia be frugal while Iraq is freeriding. Better to get rid of the voluntary quotas as quickly as possible and then start all over with clean sheets.
Unwinding the remaining 1.513 mb/d in one go in October? If OPEC+ unwinds the remaining 1.513 mb/d of voluntary cuts in one big go in October, then Iraq’s quota will be around 4.4 mb/d for October versus its likely production of close to 4.5 mb/d for the coming month..
OPEC+ should thus unwind the remaining 1.513 mb/d (1.65 – 0.137 mb/d) in one go for October in order for the quota of Iraq to be able to keep track with Iraq’s actual production increase.
October 5 will show how it plays out. But a quota unwind of at least 500 kb/d for Oct seems likely. An overall increase of at least 500 kb/d in the voluntary quota for October looks likely. But it could be the whole 1.513 mb/d in one go. If the increase in the quota is ’only’ 500 kb/d then Iraqi cumulative production will still rise by 5.7 mb to a total of 85 mb in October.
Iraqi production debt versus quotas will likely rise by 5.7 mb in October if OPEC+ only lifts the overall quota by 500 kb/d in October. Here assuming historical production debt did not rise in September. That Iraq lifts its production by 190 kb/d in October to 4.47 mb/d (August level + 190 kb/d) and that OPEC+ unwinds 500 kb/d of the remining quotas in October when they decide on this on 5 October.


Brookfield köper bränsleceller för 5 miljarder USD av Bloom Energy för att driva AI-datacenter

Teck Resources kan förse Nordamerika och kanske hela G7 med all germanium som behövs

Leading Edge Materials är på rätt plats i rätt tid

Oljepriset faller efter ny handelskonflikt mellan USA och Kina

Christian Kopfer kommenterar guld, koppar, olja och stål, samt några råvarubolag

Kinas elproduktion slog nytt rekord i augusti, vilket även kolkraft gjorde

Tyskland har så höga elpriser att företag inte har råd att använda elektricitet

Det stigande guldpriset en utmaning för smyckesköpare

OPEC+ missar produktionsmål, stöder oljepriserna

Ett samtal om guld, olja, fjärrvärme och förnybar energi
-
 Nyheter4 veckor sedan
Kinas elproduktion slog nytt rekord i augusti, vilket även kolkraft gjorde
-
Nyheter4 veckor sedan
Tyskland har så höga elpriser att företag inte har råd att använda elektricitet
-
 Nyheter4 veckor sedan
Det stigande guldpriset en utmaning för smyckesköpare
-
 Nyheter3 veckor sedan
OPEC+ missar produktionsmål, stöder oljepriserna
-
 Nyheter3 veckor sedan
Ett samtal om guld, olja, fjärrvärme och förnybar energi
-
Analys4 veckor sedan
Brent crude ticks higher on tension, but market structure stays soft
-
Analys3 veckor sedan
Are Ukraine’s attacks on Russian energy infrastructure working?
-

 Nyheter2 veckor sedan
Guld nära 4000 USD och silver 50 USD, därför kan de fortsätta stiga