

Analys
SEB Jordbruksprodukter, 5 maj 2014


 Vetepriset handlades upp i fredags efter förnyad oro för situationen i Ukraina. Däremot ser väderleksprognoserna för alla veteodlande regioner utom Kansas och Texas bättre ut än på flera år. Egyptens GASC köpte också vete från Ukraina och Ryssland, där riskpremien för Ukraina var 1% på priset. Det visar att marknaden för vete fokuserar allt för mycket på Ukrainas problem (vädret och vetet är i perfekt skick) och för lite på vad som faktiskt påverkar marknadens utbud och efterfrågan – och därmed priset. Diskrepansen mellan det pris marknaden har bildat genom fel fokus å ena sidan och jordnära realiteter å den andra, gör att vi rekommenderar sälj på vete. Vädret är gynnsamt för majs också. Sådden i USA är inte sen och som utvecklingen i vädret ter sig nu, kan sådden t o m bli snabbare avklarad än normalt.
Kinas tillväxt är på många håll i landet egentligen 4.5% i genomsnitt, dvs långt under den lagstadgade tillväxten på 7.5%. Detta visar sig i priset på t ex armeringsjärn i Kina, som är väsentligt lägre än i början av året. Efterfrågan på nya hus har mattats. Detta bör också visa sig i minskad ökning i efterfrågan på mat. Kinas annullering av kontrakt på sojabönor från USA de senaste veckorna kan vara ett tecken på det.
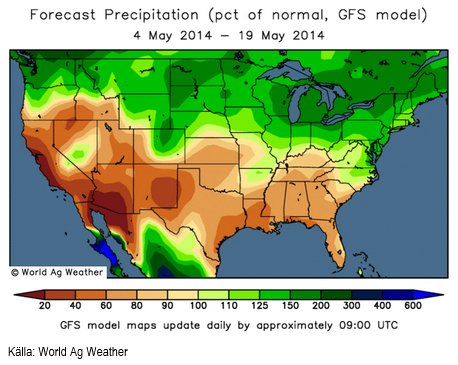
Odlingsväder
Samma områden i USA som sedan tidigare lider av torka, väntas enligt GFS-modellens 2-veckorprognos fortsätta att få väsentligt mindre nederbörd än normalt.
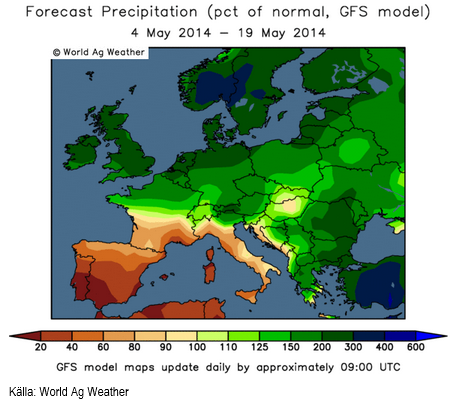
På motsvarande sätt fortsätter Europa, utom Spanien och Portugal att få mer nederbörd än normalt. Det blöta vädret har fått BASF att rapportera högre försäljning av bekämpningsmedel i vår.
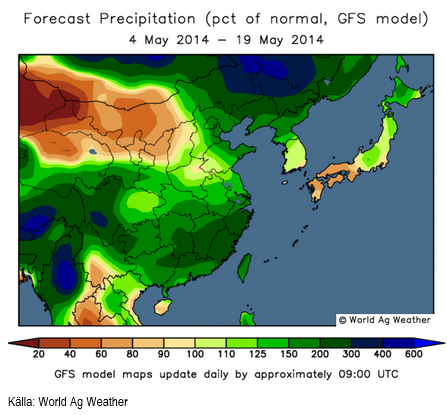
Det har funnits oro på en del håll för torka i Kina, men detta borde gå över om 2-veckorsprognosen enligt nedan slår in.
Vete
Stridigheter i Ukraina mellan pro-ryska gatuprotestanter (med luftvärnsmissiler förutom den sedvanliga gatstenen) och den Ukrainska armén fick handlare att köpa upp vetepriset – igen – i fredags. Det verkar inte spela någon roll hur mycket man påpekar att Ukrainas vete till 75% är höstvete och är i utmärkt skick och bara ett par månader från skörd. Har man så här lite kunskap, förtjänar man att förlora pengar. Jag tror att vetepriset står inför en ordentlig korrektion nedåt nu. Det som spelar roll för vetemarknaden är vädret i april, maj och juni och det ser bra ut överallt i alla fyra viktiga odlingsområden på jorden, utom i Texas och Kansas.
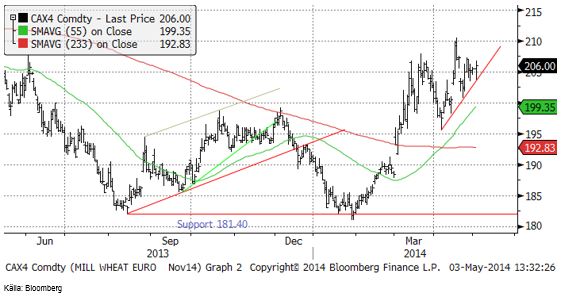
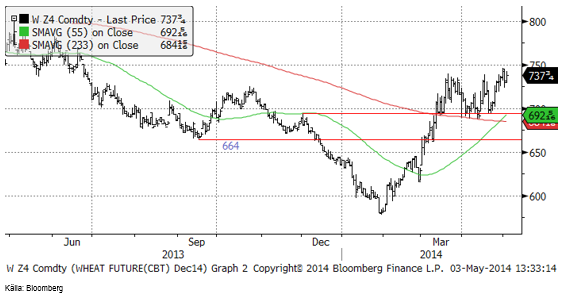
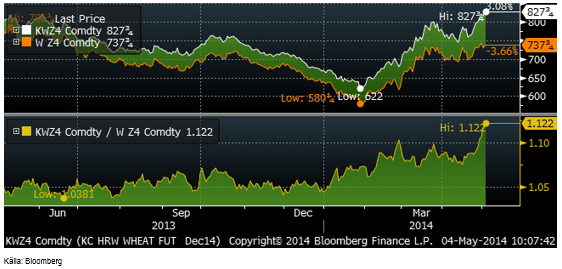
Chicagovetet (december) har handlats upp och ligger nu strax under 750 cent.
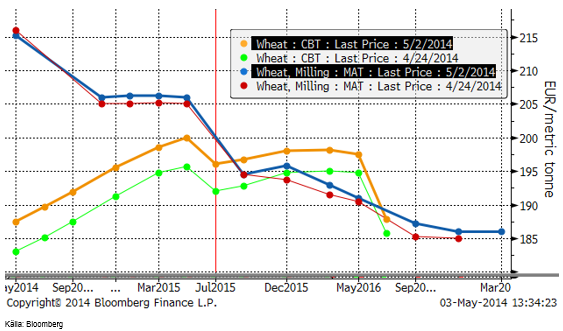
Nedan ser vi terminskurvorna för Chicagovete och Matif i fredags och veckan innan. Som vi ser har det varit en prisuppgång generellt för terminer på Chicagovete, men inte på Matif-vete.
Andelen av USA:s vete i ”good/excellent condition” sjönk med 1% till 33% i måndagens crop condition rapport. Vetet är just nu på samma nivå som samma tid förra året.
The Wheat Quality Council i Colorado gjorde klart sin ”Hard Winter Wheat Tour” av Kansas veteområden den 1 maj. De fann efter 587 fältbesök att årets skörd kan bli 18% lägre på 261 miljoner bushels jämfört med förra årets 319 mbu. Det blir den lägsta produktionen sedan 1996 års 255 mbu.
Informa Economics estimerar i sin senaste prognos den totala veteskörden i USA till 1.496 miljarder bushels. Det är 120 miljoner bushels lägre än den förra prognosen och lägre än förra årets skörd på 1.534 miljarder bushels.
Det var frost i början av maj i Kansas med temperatur mellan 0 och -2 grader Celcius, rapporterar Martell Crop Projections. Fru Martell tillägger att ett ”vanligt” år, hade detta fått rubriker, men i år hamnar det helt i skuggan av den mycket värre torkan.
Detta har fått Hard Red Winter Wheat på Kansas City Board of Trade att dra ifrån Chicagos soft wheat, som vi ser i nedanstående graf. Det kan förefalla märkligt att det dröjde till helt nyligen, i slutet av april, för priset skillnaden att dra iväg. Crop ratings för Kansas har varit tillgängliga i ett par månader och varit i stort sett lika dåliga hela tiden.
Egypten meddelade i fredags att de liksom vid den förra ”tendern” köper vete från Ukraina. GASC köpte 55,000 ton vardera av ryskt och ukrainskt vete, som kommer att levereras under de första tio dagarna i juni. GASC fortsätter alltså att fylla på lagren, så att de räcker till ganska långt efter skörden. Detta var allt de köpte den här gången. Det ukrainska vetet var 3 dollar per ton billigare C&F jämfört med det ryska, vilket kan ge en indikation om hur liten riskpremien för Ukraina är. Alla dessa okunniga handlare som köpte upp vetepriset i fredags borde ta till sig hur liten riskpremien på den fysiska marknaden faktiskt är.
Såsom vädret utvecklar sig i de fyra stora veteproducerande områdena i världen: USA, Kina och EU och Ryssland / Ukraina, är det tydligt att det kommer att bli en stor skörd av vete i år. ”Stor” kanske rentav är ett understatement. USA får en mindre skörd, framförallt av HRW. Det är dock ännu oklart vad det myckna regnandet i Europa kommer att innebära för kvaliteten.
USDA publicerar sin WASDE på fredag klockan 18 CET, som ger årets första estimat för den kommande skörden från det amerikanska jordbruksdepartementet. Det ska bli intressant att se hur pass mycket ”bearish” information de hunnit ta med i sin rapport.
Vi går däremot redan nu över från neutral till sälj på vete.
Maltkorn
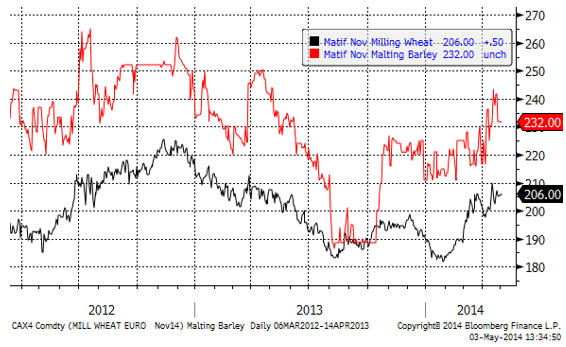
Maltkornsterminernas premie över Matif föll från 34 euro till under 30. Maltkornet för leverans i november stängde i fredags på 232 euro per ton.
Majs
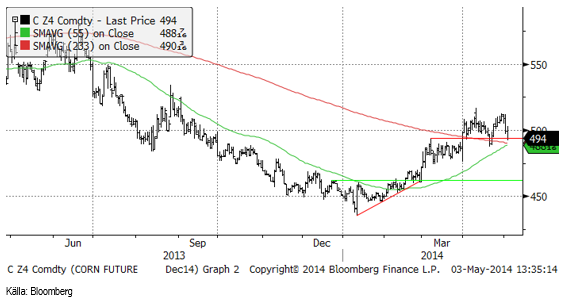
Decemberkontraktet på majs föll ganska kraftigt i torsdags och fredags. Priset stängde på ett tekniskt stöd och frågan är om priset ska fortsätta falla i veckan som kommer. Det finns en hel del som talar för det, då vädret successivt väntas bli varmare och lantbrukarna i USA kan lägga i en högre växel för vårbruket. Tvärt emot situationen för vetet i Kanas och Texas, har de typiska majs-områdena fått normal till över normal nederbörd. Det har varit kallare än normalt i de norra odlingsområdena, men varmare än normalt i de södra. I genomsnitt har det hittills alltså varit ganska bra.
Den andra plantings-rapporten för året, från i måndagen 21 april visade att19% (förra veckan 6%) av majsarealen i USA var sådd per den 25 april. Kommentatorerna var snabba att påpeka att detta är sent, men det är faktiskt inte alarmerande sent. Det är snabbare än både förra året och år 2011.
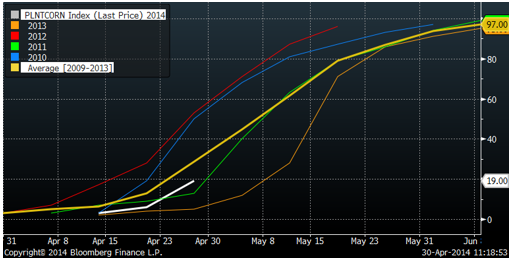
Temperaturen ser ut att gå mot varmare och det är möjligt att 50 – 60% är sått om två veckor. Det är gott och väl på – eller över – normal takt.
Mot den här bakgrunden går vi över från neutral till sälj på majs, liksom för vetet.
Sojabönor
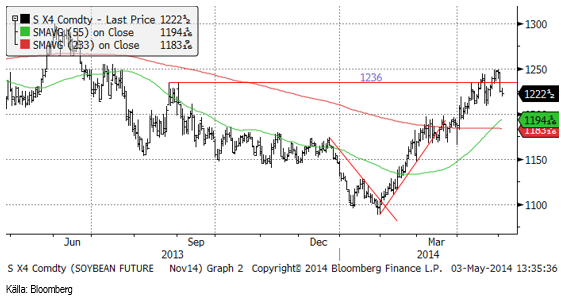
Novemberkontraktet på sojabönor nådde upp till 1250, en teknisk motståndsnivå, men vände ner därifrån och föll i torsdags och fredags ner till 1222 cent. Uppgångsfasen är antagligen avklarad och vi bör kunna få se en rekyl ner mot 1200 cent, enligt den tekniska skolans analys.
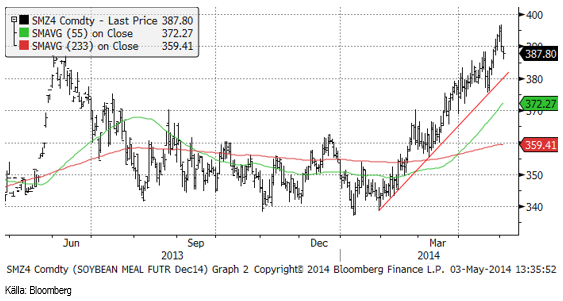
Sojamjölet, som är det som drivit priset på sojabönorna uppåt, har uppe vid den föregående toppen i maj-juni förra året. Vi har svårt att se att den här prisnivån ska bli bestående och rekommenderar sälj.
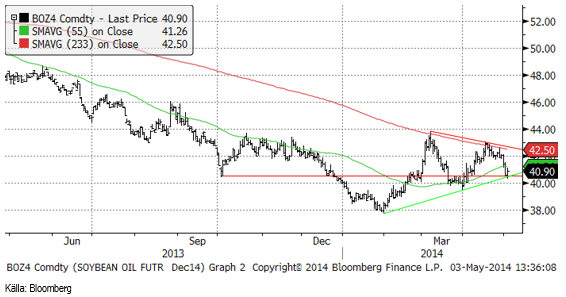
Sojaoljan föll ner till det tekniska stödet strax över 40 dollar. Tekniskt har sojaoljan bildat en ”triangelformation” och då bör man avvakta ett utbrott från den. Just nu ligger priset precis på botten av triangeln. Ett brott på nedsidan kan i första hand ta ner priset till 38 dollar. Den fundamentala information som skulle kunna ges skulden för detta är t ex om det skulle komma bekräftelse på att Ukrainas bönder valt att så solrosor i stället för majs i större utsträckning än vad marknadens aktörer (i väst) haft klart för sig.
Vi skrev förra veckan att uppgången höll på att mattas, men vi behöll neutral rekommendation. Nu tycker vi det är dags att gå över till sälj.
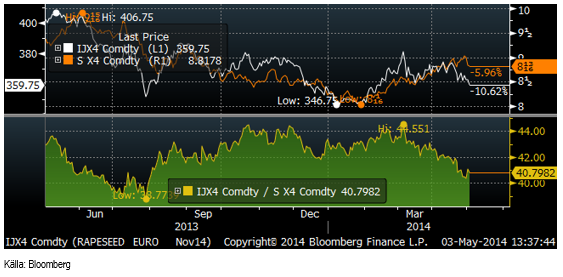
Raps
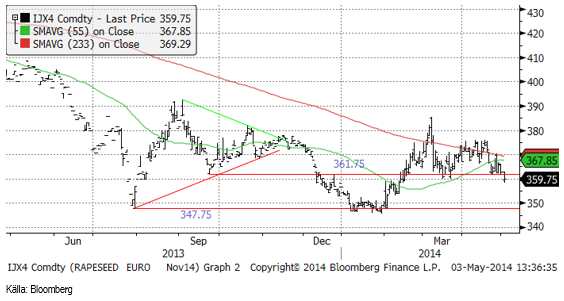
Novemberkontraktet på Matif bröt ett väsentligt tekniskt stöd i fredags innan marknaden stängde och det skickar en varningssignal om att priset kan falla ner till det gamla tekniska stödet vid 350 euro per ton. Det är också kontraktslägsta. Det är alltså möjligt att priset faller ännu lägre, om det vill sig illa.
Skillnaden mellan kanadensisk canola i eurotermer och Matifs rapskontrakt (båda för novemberleverans) har sedan förra veckan minskat från 15% till 13%. Jag tycker fortfarande att spreaden är värd att sälja.
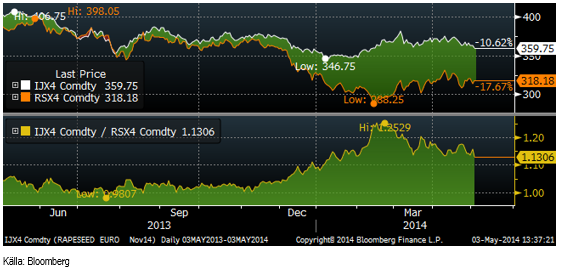
Nedanför ser vi kvoten mellan rapsfrö (november) och sojabönor (november, omräknat till euro. Kvoten ligger kvar på 41, samma som förra veckan.
Jag går tillbaka till säljrekommendation på raps.
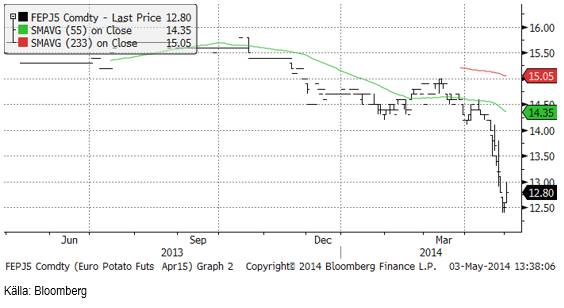
Potatis
Potatis fortsatte prisfallet från förra veckans 13.20 till 12.80 i fredags.
Gris
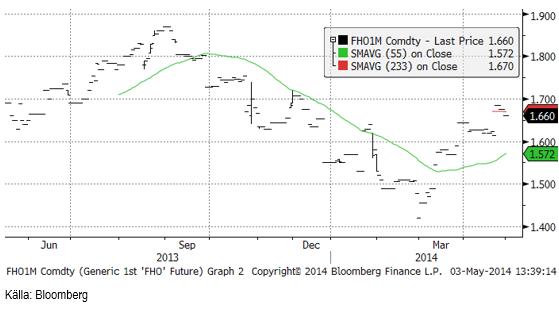
Juni-kontraktet på har rekylerat ner till det tekniska stödet för uppgången. Ett brott av den på nedsidan skulle kunna utlösa ett större kursfall. Inom EU har det talats om ett importförbud för amerikanskt fläskkött med hänvisning till risken för spridning av PED-viruset. Det är ett argument som passar bra i den pressade europeiska grisnäringen.
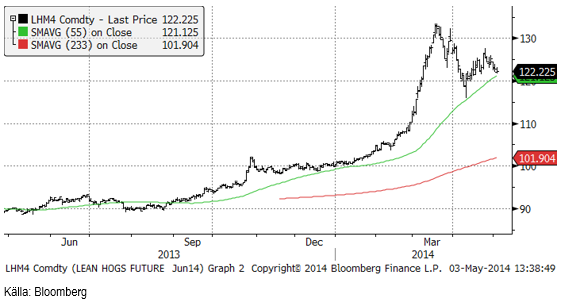
Spotkontraktet på EUREX Hogs backade i veckan med 2 eurocent per Kg till 1.66 euro per Kg.
Mjölk
I onsdags publicerade Eurex de senaste indexnivåerna för Eurex smör och Eurex SMP index. Där noterades ett ganska stort prisfall i mjölk, från 3500 euro per ton till 3378 euro per ton. Även SMP-indexet kom in lägre, men bara med en hårsmån. Terminsmarknaden var kraftigt lägre i USA (beroende på terminsförfall), liksom på Eurex, beroende också på att april månads terminer förföll i tisdags för avräkning mot indexen som publicerades i onsdags. Det är ju alltid terminsförfall tisdagen innan den sista onsdagen varje månad.
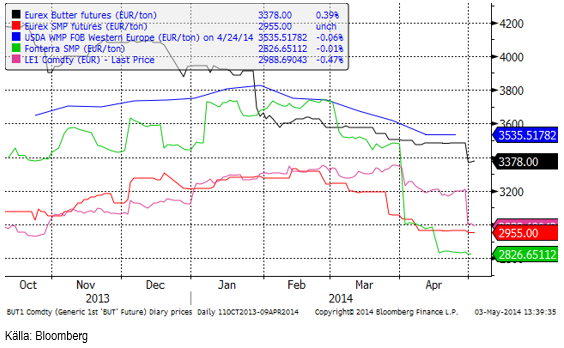
Terminspriserna är lägre, framförallt för att april månads terminskontrakt förföll. Terminsmarknaden förutspår ytterligare prisnedgångar fram till sommaren och därefter en stabilisering.
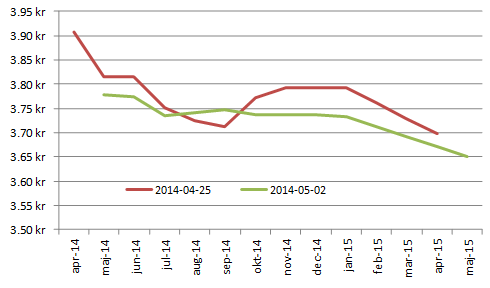
Detta innebär att genomsnittliga priset för ett Kilo mjölkråvara basis Eurex SMP och smörterminer för perioden maj 2014 till och med maj 2015 är 3.73 kronor. Det är en något lägre än förra veckan då det april – april låg på 3.78 kr.
SEB förbättrar börsens köpkurs med 1% (så länge marknaden är på introduktionsstadium och i behov av stöd enligt vår uppfattning). Detta innebär att SEB betalar i genomsnitt 3.76 öre per Kilo per månad maj 2014 – maj 2015.
Socker
Priset på socker ligger kvar i konsolidering mellan 17 och 18.50 cent. Det är ett prisintervall som etablerades i början av förra månaden. I fredags föll priset ganska kraftigt, men fortfarande höll sig priset inom intervallet.
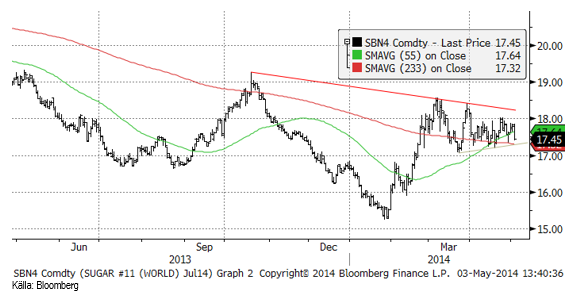
Vi behåller neutral vy på socker.
[box]SEB Veckobrev Jordbruksprodukter är producerat av SEB Commodities Sales desk och publiceras i samarbete och med tillstånd på Råvarumarknaden.se[/box]
Detta marknadsföringsmaterial, framtaget av SEB’s Commodities Sales desk, har upprättats enbart i informationssyfte.
Även om innehållet är baserat på källor som SEB bedömt som tillförlitliga ansvarar SEB inte för fel eller brister i informationen. Den utgör inte oberoende, objektiv investeringsanalys och skyddas därför inte av de bestämmelser som SEB har infört för att förebygga potentiella intressekonflikter. Yttranden från SEB’s Commodities Sales desk kan vara oförenliga med tidigare publicerat material från SEB, då den senare hänvisas uppmanas du att läsa den fullständiga rapporten innan någon åtgärd vidtas.
Dokumentationen utgör inte någon investeringsrådgivning och tillhandahålls till dig utan hänsyn till dina investeringsmål. Du uppmanas att självständigt bedöma och komplettera uppgifterna i denna dokumentation och att basera dina investeringsbeslut på material som bedöms erforderligt. Alla framåtblickande uttalanden, åsikter och förväntningar är föremål för risker, osäkerheter och andra faktorer och kan orsaka att det faktiska resultatet avviker väsentligt från det förväntade. Historisk avkastning är ingen garanti för framtida resultat. Detta dokument utgör inte ett erbjudande att teckna några värdepapper eller andra finansiella instrument. SEB svarar inte för förlust eller skada – direkt eller indirekt, eller av vad slag det vara må – som kan uppkomma till följd av användandet av detta material eller dess innehåll.
Observera att det kan förekomma att SEB, dess ledamöter, dess anställda eller dess moder- och/eller dotterbolag vid olika tillfällen innehar, har innehaft eller kommer att inneha aktier, positioner, rådgivningsuppdrag i samband med corporate finance-transaktioner, investment- eller merchantbankinguppdrag och/eller lån i de bolag/finansiella instrument som nämns i materialet.
Materialet är avsett för mottagaren, all spridning, distribuering mångfaldigande eller annan användning av detta meddelande får inte ske utan SEB:s medgivande. Oaktat detta får SEB tillåta omfördelning av materialet till utvald tredje part i enlighet med gällande avtal. Materialet får inte spridas till fysiska eller juridiska personer som är medborgare eller har hemvist i ett land där sådan spridning är otillåten enligt tillämplig lag eller annan bestämmelse.
Skandinaviska Enskilda Banken AB (publ) är ett [publikt] aktiebolag och står under tillsyn av Finansinspektionen samt de lokala finansiella tillsynsmyndigheter i varje jurisdiktionen där SEB har filial eller dotterbolag.

Selling down on a ”deal”. Brent crude fell 6.2% last week with accelerated weakness towards the end of the week. Close of the week at $87.33/b and low of the week (and on Friday) of $85.8/b. Brent is falling another 4% this morning to $83.7/b on confirmation by Iran that a MoU text has been reached and that it will be signed on Friday this week.

So what is this ”deal” worth? Talk on the desk here this morning is that it is much like ”putting lipstick on a pig” where Trump has to sell this at home as a victory where ”the SoH has reopened”, the nuclear issue will be ironed out over the coming 60 days (or maybe 600 days?) and US consumers are getting a lower gasoline price and maybe US republicans survives the midterm elections.
The importance for Iran is that it emerges as the defacto winner of this war in the eyes of the non-US public world. That Iran now onwards is the ”ruler of the SoH” (combo of geography and new weapons systems like drones) or more softer: ”the guarantor of safe passage through the SoH”.
Iran doesn’t need nuclear weapons any more. Nuclear deterrence doesn’t work any more. Ukraine has made many attacks deep into Russia without being nuked in return. Plenty of Iranian ballistic rockets blasts over Israel but Iran wasn’t nuked in return.
There is no trust between the US and Iran. We don’t know all the details yet of the MoU. But what we do know is that there is no trust between the US and Iran what so ever. This is probably more like a descriptive text on how they can cooperate in a way where both sides keeps tactical leverage. Neither side makes irreversible concessions. Violations can be punished quickly. Cooperation produces immediate benefits.
This is a fragile structure. It can easily break down. There may be details which cannot be overcome. To be seen on Friday. The US has to show that it is willing put enough force behind managing and restraining Israel versus Hezbollah in Lebanon. We have seen that Netanyahu hasn’t listened all that much to Trump’s directives and wishes. This could be a major obstacle.
A gradual reopening is tactically preferable for Iran. A tactical leverage for Iran right now is that global oil stocks have been drawn down towards painful and increasingly dangerous levels with increasing risks for oil price spikes in mid-July to August. This together with US midterm elections on 3 November gives tactical leverage to Iran. Iran probably doesn’t want to fully give up on that leverage. A rapid, full reopening where global stocks are able to refill over the coming 60 days will significantly erode that leverage. If Iran reinstates a closure of the SoH after 60 days (if talks break down again), then the effect won’t be that impactful in terms of prices and the US midterm elections.
So a gradual and partial reopening where global markets gets the oil they need while they are unable to rebuild stocks could be a practical middle way for both parties. Trump can sell it as ”the SoH has reopened” and get affordable gasoline for US consumers. Iran can sell it as ”the SoH has fully reopened, but there is some friction” so flow is only 60-80% of normal.
Not much real demand destruction below $100/b. What we do know is that there is not much real price pain demand destruction for oil globally at an oil price below $100/b. A lot of demand-shock destruction. Fear. But demand should now come roaring back towards normal with fear for exceptionally high prices now is rapidly receding.
Sudden China demand destruction due to EVs? Bullocks. EV share of total Chinese carpool now around 13%. Share of new sales of EVs has reached 50%. This is a very gradual process. It doesn’t make oil demand fall like a rock over night. When EV new sales share reaches 100%, then the gasoline car pool will contract by some 5-10% per year. But that is only gasoline. Sudden reduction in Chinese oil demand is more about shock and risk.
Chinese crude oil imports will come roaring back. At what price? Today’s ”neutral” oil price is $70/b. That is the five year price which has steadily traded around the $70/b mark over the past 3-4 years. With still a risky picture one would think that China and the rest of the world will be big buyers of oil in the range of $70-85/b.
Global demand will likely snap back towards normal, forecasted demand and growth at such prices.
Physical reopening is a gradual process. The physical and practical reopening of the SoH will likely be gradual rather than sudden. And that probably suites Iran tactically as well.
Brent M1 price versus the Brent 5-yr (today’s ”normal” price)

Market is starting to take US/Iran headlines with a pinch of salt. Brent crude rose $2.8/b yesterday to an official close of $112.1/b. But after that it traded as low as $108.05/b before ending late night at around $109.7/b. Through the day it traded in a range of $106.87 – 112.72/b amid a flurry of news or rumors from Iran and the US. ”US temporary sanctions during negotiations” (falls alarm). ”We will bomb Iran” (not anyhow),… etc. While the market is still fluctuating to this kind of news flow, it is starting to take such headlines with a pinch of salt.
We’ll see. Maybe, maybe not. The Brent M1 contract is trading at $110.2/b this morning which very close to the average ticks through yesterday of $110.4/b.
Trump with bearish, verbal intervention whenever Brent trades above $110/b it seems. What seems to be a pattern is that Trump states something like ”very good negotiations going on with Iran”, ”New leaders in Iran are great,..”, ”Great progress in negotiations,…”, ”Deal in sight,..” etc whenever the Brent M1 contract trades above $110/b. An effort to cool the market. These hot air verbal interventions from Trump used to have a heavy bearish impact on prices, but they now seems to have less and less effect unless they are backed by reality.
As far as we can see there has been no real progress in the negotiations between the US and Iran with both sides still standing by their previous demands.
Iran is getting stronger while the cease fire lasts making a return to war for Trump yet harder. Iran is naturally in constant preparation for a return to war given Trump’s steady threats of bombing Iran again. Iran is naturally doing what ever is possible to prepare for a return to war. And every day the cease fire lasts it is better prepared. This naturally makes it more and more difficult and dangerous for the US to return to warring activity versus Iran as the consequences for energy infrastructure in the Persian Gulf will be more and more severe the longer the cease fire lasts. Israel seems to see it this way as well. That the war is not won and that current frozen state of a cease fire gives Iran opportunity to rebuild military and politically.
Global inventories are drawing down day by day. How much? In the meantime the Strait of Hormuz stays closed. There is varying measures and estimates of how much global inventories are drawing down. Our rough estimate, back of the envelope, is that global inventories are drawing down by at least some 10 mb/d or about 300 mb/d in a balance between loss of supply versus demand destruction. Other estimates we see are a monthly draw of 250-270 mb/d. The IEA only ’measured’ a draw in global observable stocks of 117 mb in April with oil on water rising 53 mb while on shore stocks fell 170 mb. But global stocks are hard to measure with large invisible, unmeasured stocks. As such a back of the envelope approach may be better.
Oil products is what the world is consuming. Oil product prices likely to rise while product stocks fall. Strategic Petroleum Reserves (SPR) are predominantly crude oil. Discharging oil from OECD SPR stocks, a sharp reduction in Chinese crude imports and a reduction in global refinery throughput of 6-7 mb/d has helped to keep crude oil markets satisfactorily supplied. But global inventories are drawing down none the less. And oil products is really what the world is consuming. So if global refinery throughput stays subdued, then demand will eventually have to match the supply of oil products. The likely path forward this summer is a steady draw down in jet fuel, diesel and gasoline. Higher prices for these. Then, if possible, higher refinery throughput and higher usage of crude in response to very profitable refinery margins. And lastly sharper draw in crude stocks and higher prices for these. But some 6 mb/d of oil products used to be exported through the Strait of Hormuz. And it may not be so easy to ramp up refinery activity across the world to compensate. Especially as Ukraine continues to damage Russian refineries as well as Russian crude production and export facilities.
Watch oil product stocks and prices as well as Brent calendar 2027. What to watch for this summer is thus oil product inventories falling and oil product premiums to crude rising. Another measure to watch is the Brent crude 2027 contract as it rises steadily day by day as the Strait of Hormuz stays closed and global oil inventories decline. The latter is close to the highest level since the start of the war and keeps rising.
The Brent M1 contract and the Brent 2027 prices and current price of jet fuel in Europe (ARA). All in USD/b

Our back of the envelope calculation of the global shortage created by the closure of the Strait of Hormuz. Note that 3.5 mb/d of discharge from SPR is also a draw. Note also that ’Forced demand loss’ of 2.5 mb/d is probably temporary and will fall back towards zero as logistics are sorted out leaving ’Price demand loss’ to do the job of balancing the market. Thus a shortfall of at least 9 mb/d created by the closure. More if SPR discharge is included and more if Forced demand loss recedes.

Brent is climbing higher. Front-month is at USD 106.3/bl this morning, close to a weekly high and a USD 9/bl jump from Mondays open. This is the move we flagged as a risk earlier in the week: the market shifting from ”a deal is around the corner” to ”this is going to take longer than we thought”.

Analyst Commodities, SEB
During April, rest-of-year Brent remained remarkably stable around USD 90/bl. A stability which rested on one single assumption: the SoH reopens around 1 May. That assumption is now slowly falling apart.
As we highlighted yesterday: every week of delay beyond 1 May adds (theoretically) ish USD 5/bl to the rest-of-year average, as global inventories draw 100 million barrels per week. i.e., a mid-May reopening implies rest-of-year Brent closer to USD 100/bl, and anything pushing into June or July takes us meaningfully higher.
What’s changed in the last 48 hours:
#1: The US military has formally warned that clearing suspected sea mines from SoH could take up to six months. That is a completely different timescale from what the financial market is pricing. Even a political deal tomorrow does not immediately reopen the strait.
#2: Trump has shifted his tone from urgency to ”strategic patience”. In yesterday’s press conference: ”Don’t rush me… I want a great deal.” The market is reading this as a president no longer feeling pressured by timelines, with the naval blockade running in the background.
#3: So far, the military activity is escalating, not de-escalating. Axios reports Iran is laying more mines in SoH. The US 3rd carrier strike group (USS George H.W. Bush) is arriving with two countermine vessels. Trump yesterday ordered the US Navy to destroy any Iranian boats caught laying mines. While CNN reports that the Pentagon is actively drawing up plans to strike Iranian SoH capabilities and individual Iranian military leaders if the ceasefire collapses. i.e., NOT a attitude consistent with an imminent deal!
Spot crude and product prices eased off the early-April highs on a combination of system rerouting and deal optimism. Both now weakening. Goldman estimates April Gulf output is reduced by 14.5 mbl/d, or 57% of pre-war supply, a number that keeps getting worse the longer this drags on.
Demand-side adaptation is ongoing: S. Korea has cut its Middle East crude dependence from 69% to 56% by pulling more from the Americas and Africa, and Japan is kicking off a second round of SPR releases from 1 May. But SPRs are finite.
Ref. to the negotiations, we should not bet on speed. The current Iranian leadership is dominated by genuine hardliners willing to absorb economic pain and run the clock to extract concessions. That is not a setup for a rapid resolution. US/Israeli media briefings keep framing the delay as ”internal Iranian divisions”, the reality is more complicated and points toward weeks and months, not days.
Our point is that the complexity is large, and higher prices have only just started (given a scenario where the negotiations drag out in time). The market spent April leaning on the USD 90/bl rest-of-year assumption; that case is diminishing by the hour. If ”early May reopening” is replaced by ”June, July or later” over the next week or two, both crude and products have meaningful room to reprice higher from here. There is a high risk being short energy and betting on any immediate political resolution(!).


Vattenfalls och Industrikrafts kärnkraftsbolag Videberg Kraft har valt Rolls-Royce SMR
Selling down on a ”deal”

Sommarväder skapar prisrally på elbörsen
Oil product price pain is set to rise as the Strait of Hormuz stays closed into summer

Solkraften pressar elpriserna dagtid
Oil product price pain is set to rise as the Strait of Hormuz stays closed into summer
Sommarväder skapar prisrally på elbörsen
Vattenfalls och Industrikrafts kärnkraftsbolag Videberg Kraft har valt Rolls-Royce SMR
Selling down on a ”deal”
-
Analys4 veckor sedan
Oil product price pain is set to rise as the Strait of Hormuz stays closed into summer
-
Nyheter2 veckor sedan
Sommarväder skapar prisrally på elbörsen
-
 Nyheter2 dagar sedan
Vattenfalls och Industrikrafts kärnkraftsbolag Videberg Kraft har valt Rolls-Royce SMR
-
Analys2 dagar sedan
Selling down on a ”deal”