

Analys
SEB – Råvarukommentarer, 27 maj 2013

Rekommendationer
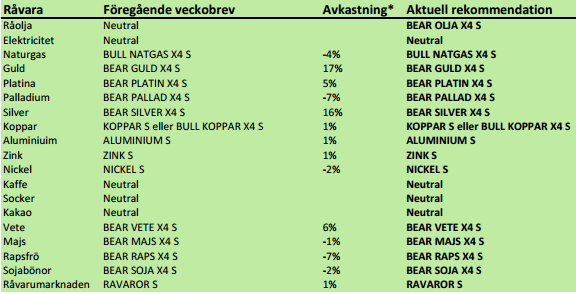
*) Avkastningen avser 1:1 råvarucertifikat där de ingår i rekommendationen. I den aktuella tabellen ovan har jag tagit prisförändringen den senaste veckan sedan det förra veckobrevet publicerades.
Inledning
Inköpschefsindex kom in på sin svagaste nivå på 7 månader och i stort sett alla råvarumarknader präglas av långsiktigt fallande trender. En produktion som kommer ikapp efterfrågan med lagerökningar som följd syns tydligast på spannmålsmarknaden, men samma sak kan anas även på andra marknader, t ex för basmetaller, där lagren varit stigande länge. Vissa marknader har dock fallit under lång tid, och börjar närma sig vad jag tror är bottennivåer. Dit hör t ex kaffe, socker och guld och amerikansk naturgas.
Råolja – Brent
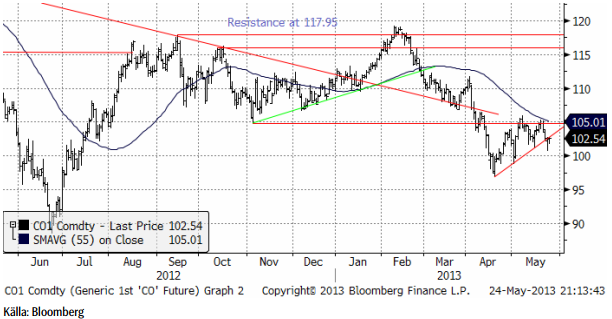
Oljan var har under april och maj rekylerat uppåt och i slutet av förra veckan brutit detta mönster och handlat lägre. Det är en teknisk säljsignal och vi rekommenderar köp av BEAR OLJA X4 S.
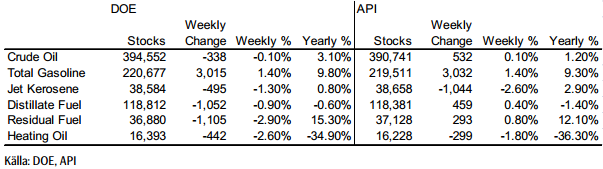
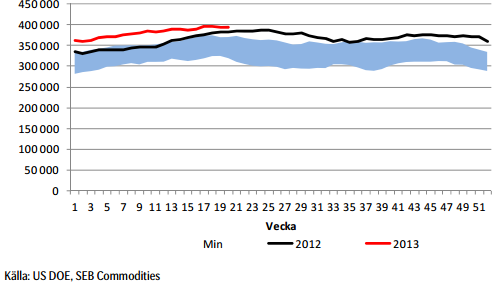
Lagren och lagerförändringarna i USA den senaste rapportveckan (som slutade den 10 maj) ser vi nedan, enligt Department of Energy och American Petroleum Institute.
Nedan ser vi amerikanska råoljelager enligt DOE i tusen fat. Den svarta kurvan är 2012 års lagernivåer vecka för vecka och den lilla röda linjen är 2013 års nivå.
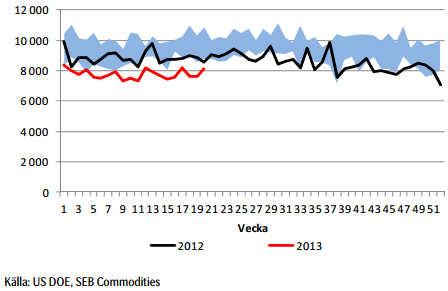
Importen fortsätter att hålla sig under förra årets nivå. En liten ökning av importen noterades i den senaste rapporten.
Slutsatsen är alltså att vi tror att oljepriset faller från den här punkten.
Elektricitet
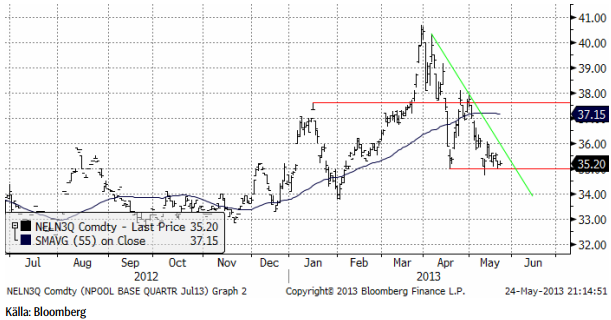
Elen har konsoliderat sig över 35 euro per MWh. Eftersom inget brott åt något håll har skett ligger vi kvar, men följer på i den riktning som utbrottet sker.
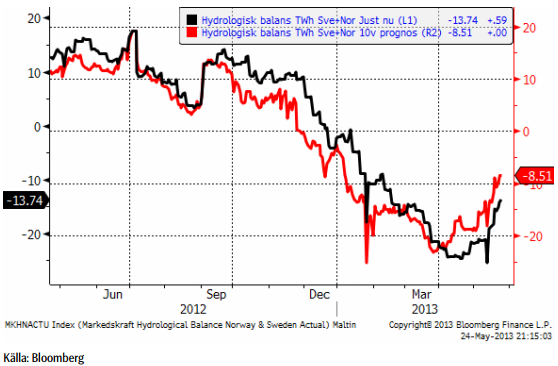
Hydrologisk balans har fortsatt att stiga från -11.93 till -8.51 i tioveckorsprognosen.
Eftersom priset trots allt kommit ner ganska långt, väljer vi att fortsätta med neutral position.
Naturgas
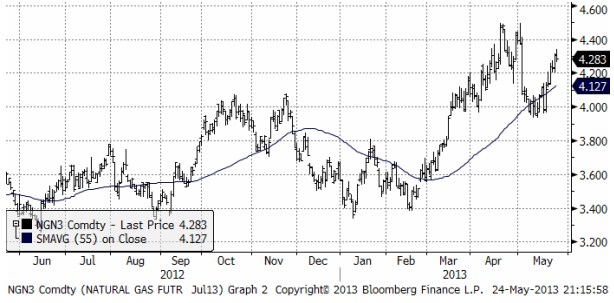
Naturgasen vände upp och är i stadig trend nu. Därför rekommenderas en köpt position, t ex genom BULL NATGAS X4 S.
Guld & Silver
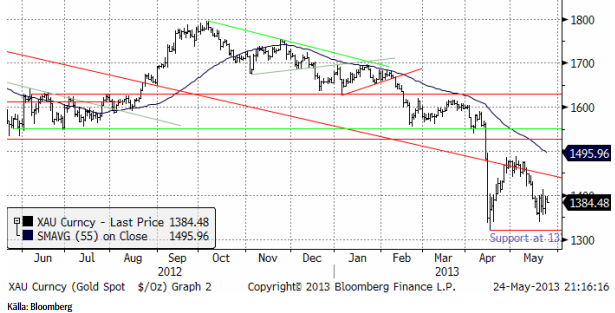
Guldpriset var nere och ”nästan” rörde vid botten från prisfallet i april. Det är ett styrketecken för marknaden att det inte registrerades en ny botten. Trenden är dock fortfarande nedåtriktad och det ”borde” bli en förnyad nedgång mot 1300 i veckan som kommer.
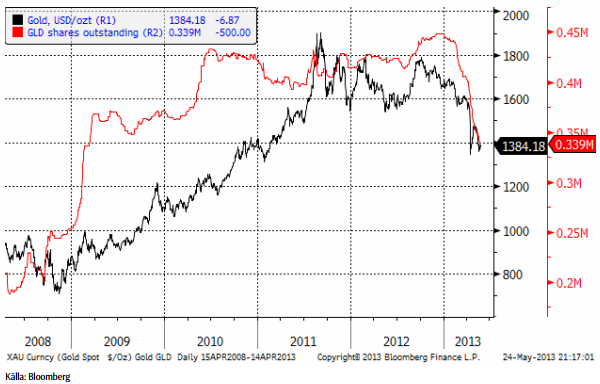
ETF-investerare har fortsatt att likvidera sina innehav i guld, som vi ser i diagrammet nedan.
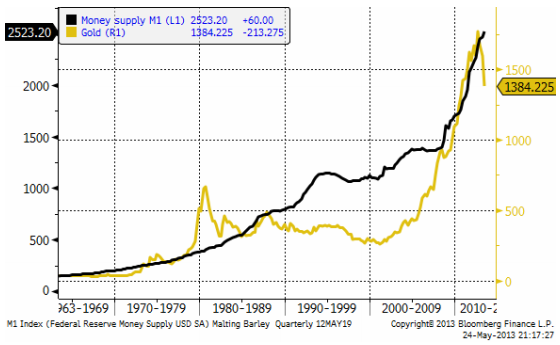
Vad som kan ha utlöst försäljningarna var ”hacket” i kurvan på penningmängden i USA. Samtidigt började FED tala om ett slut på QE. Men som vi ser i grafen nedan, har M1 fortsatt att öka i USA. Man fick kalla fötter hos FED och fortsatte trycka pengar. Det gör att det byggs upp ett latent stöd för guldpriset, bara kursfallet tar slut.
Nedan ser vi kursdiagrammet för silver i dollar per troy ounce. Stödet på 22 dollar håller än så länge. Bryts den nivån finns inget förrän vid 20 dollar, 10% längre ner. Silverpriset var nere och rörde nästan vid 20 och frågan är om det räcker så, eller om priset kommer att gå ner och testa stödet ordentligt.
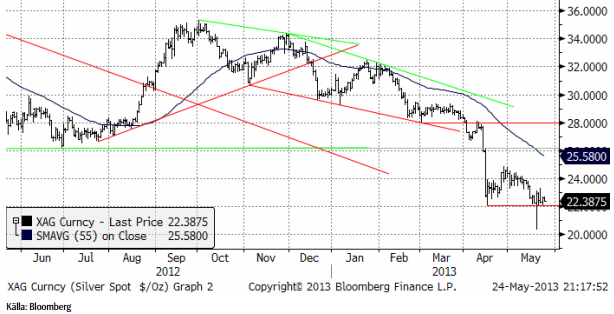
Jag tror att silverpriset kan gå lite lägre från dagens nivå, Trenden är nedåtriktad.
Vi ligger korta guld och silver. Jag tror att det kommer en till vända ner och ligger självklart kvar med köpt position i BEAR GULD X4 S och BEAR SILVER X4 S.
Platina & Palladium
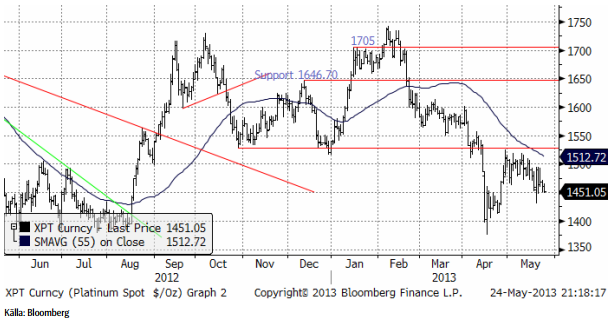
Platina började veckan med att rekylera upp från 1450, men trenden (nedåt) tog över och vid slutet av veckan var priset återigen nere vid 1450. Den här nivån var toppen på konsolideringen efter det kraftiga prisfallet i mitten av april och därför ett visst tekniskt stöd. Marknaden står nu och väger. Antingen får vi se en trendvändning uppåt, eller så fortsätter priset i den fallande pristrenden.
Palladium vände ner vid 750 dollar. Som jag skrev förra veckan, skulle 750 vara en lockande nivå för säljare att lägga sina ordrar. Priset har nu rekylerat ner och det mesta tyder på att prisfallet fortsätter, åtminstone ner mot 710 dollar.
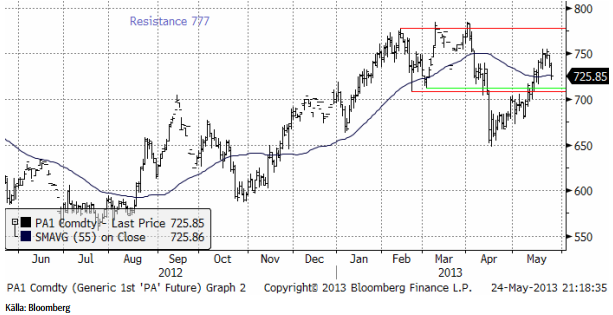
Vi ligger kvar såld både platina och palladium, dvs med BEAR PLATNA X4 S och BEAR PALLAD X4 S.
Basmetaller
Fokus i veckan låg på onsdagens kongressutfrågning av Bernanke´s. Priserna inledde veckan positivt med köp från finansiella aktörer på förväntan om indikationer på en långvarig penningpolitisk stimulans från FED. Turbulensen ökad inför, och under talet. När han fick frågan om tidsaspekten, med svaret att det kan vara aktuellt med ett tillbakadragande de 2-3 nästkommande mötena, började börser och råvaror att falla tillbaka. Kinas PMI kom in svagare (49,6 mot 50,4 månaden före) natten till torsdagen, vilket satte förnyad press. Veckan avslutas i stort sett där den började, med endast marginellt högre priser.
Koppar
Som vi skrivit tidigare har vi haft kopparn under bevakning för att gå från neutral till köp. Tekniskt sett bedömde vi förutsättningarna som goda för en kortsiktig uppgång. Veckan inleddes som väntat starkt med en uppgång till nivåer strax över $7500, upp 3 % på veckan. Kinas PMI dämpade riskaptiten och priset föll ungefär lika mycket dagen efter. Trots tveksamhet under veckan, ser vi tecken på att det negativa stämningsläget kring koppar håller på att svänga om.
Tekniskt sett fokuserar vi på ”dubbelbotten” från april och maj, som ger en potentiell uppgång till $7620, där motståndet sätter in. Nästa nivå är $7800. Den omedelbara pressen på koppar verkar vara över och den nedåtgående trenden är bruten. Den generella trenden får betraktas som mer sidledes för koppar.
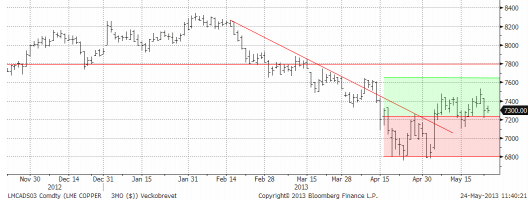
Vi förväntar oss fortsatt hög volatilitet. Vår kortsiktiga bedömning talar för uppsidan och vi rekommenderar därför köp av BULL KOPPAR X2 S eller X4 S.
Aluminium
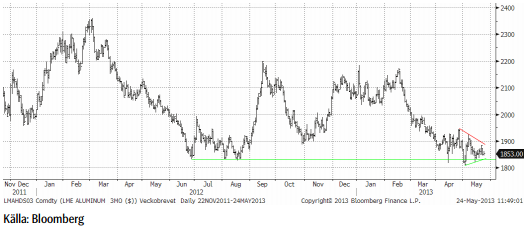
Priset har nu ”testat” stödnivåerna vid $1810-20 vid tre tillfällen, och lyckats studsa upp. Det är ett styrketecken. Vi ser fysiska aktörer som går in och täcker in framtida konsumtion via terminsköp vid varje dipp. Tekniskt orienterade fonder säljer vid varje uppställ. Trenden blir därefter, det rör sig sidledes. Vi ser tecken på att marknaden håller på att bottna ur. Högkostnadsproducenterna, framför allt i Kina, förväntas minska utbudet (ännu mer) om priset långvarigt stannar på nuvarande nivåer.
Långsiktigt är nivån väldigt intressant för kontraktet Aluminium S (utan hävstång).
Zink
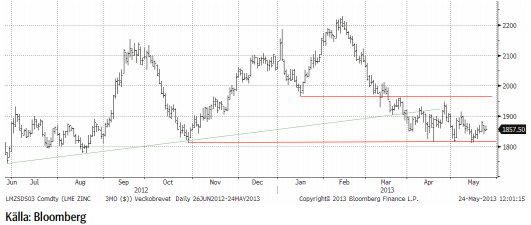
Situationen för zink påminner om den för aluminium, både fundamentalt och tekniskt. Vi bedömer zinken som ”billig” ur ett kostnadsperspektiv och nuvarande nivåer är mycket intressanta på lite längre sikt (6-12 månader). I det perspektivet är Zink S (utan hävstång) att föredra.
Nickel
Nickel följde övriga basmetaller under veckan, upp ca 3 % i mitten av veckan, och sen ner igen. Förutom det makroekonomiska nyhetsflödet är det inte mycket som har förändrats sen förra veckan.
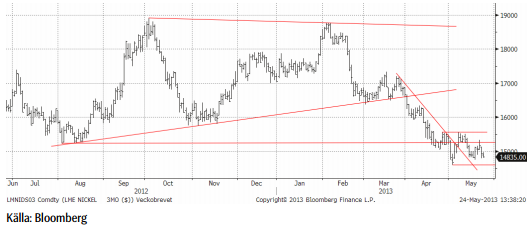
Ur ett tekniskt perspektiv gäller att nivån från i början av månaden $14600 håller, för att undvika en test av lägre nivåer. Det finansiella kollektivet är redan väldigt ”korta” och frågan är hur mycket mer kraft det finns för att pressa priset ytterligare. Det byggs upp ett stort behov av att köpa tillbaka kortpositioner, vilket i sig kan skapa kraftiga rekyler på uppsidan. Vi bedömer nickel som ”billig” ur ett kostnadsperspektiv och nuvarande nivåer är mycket intressanta på lite längre sikt (6-12 månader). I det perspektivet är Nickel S (utan hävstång) att föredra.
[box]SEB Veckobrev Veckans råvarukommentar är producerat av SEB Merchant Banking och publiceras i samarbete och med tillstånd på Råvarumarknaden.se[/box]
Disclaimer
The information in this document has been compiled by SEB Merchant Banking, a division within Skandinaviska Enskilda Banken AB (publ) (“SEB”).
Opinions contained in this report represent the bank’s present opinion only and are subject to change without notice. All information contained in this report has been compiled in good faith from sources believed to be reliable. However, no representation or warranty, expressed or implied, is made with respect to the completeness or accuracy of its contents and the information is not to be relied upon as authoritative. Anyone considering taking actions based upon the content of this document is urged to base his or her investment decisions upon such investigations as he or she deems necessary. This document is being provided as information only, and no specific actions are being solicited as a result of it; to the extent permitted by law, no liability whatsoever is accepted for any direct or consequential loss arising from use of this document or its contents.
About SEB
SEB is a public company incorporated in Stockholm, Sweden, with limited liability. It is a participant at major Nordic and other European Regulated Markets and Multilateral Trading Facilities (as well as some non-European equivalent markets) for trading in financial instruments, such as markets operated by NASDAQ OMX, NYSE Euronext, London Stock Exchange, Deutsche Börse, Swiss Exchanges, Turquoise and Chi-X. SEB is authorized and regulated by Finansinspektionen in Sweden; it is authorized and subject to limited regulation by the Financial Services Authority for the conduct of designated investment business in the UK, and is subject to the provisions of relevant regulators in all other jurisdictions where SEB conducts operations. SEB Merchant Banking. All rights reserved.

Parts of the Brent crude curve dipping into the high $50ies/b. Brent crude fell 2.3% over the week to Friday. It closed the week at $61.29/b, a slight gain on the day, but also traded to a low of $60.14/b that same day and just barely avoided trading into the $50ies/b. This morning it is risk-on in equities which seems to help industrial metals a little higher. But no such luck for oil. It is down 0.8% at $60.8/b. This week looks set for Brent crude to dip its feet in the $50ies/b. The Brent 3mth contract actually traded into the high $50ies/b on Friday.

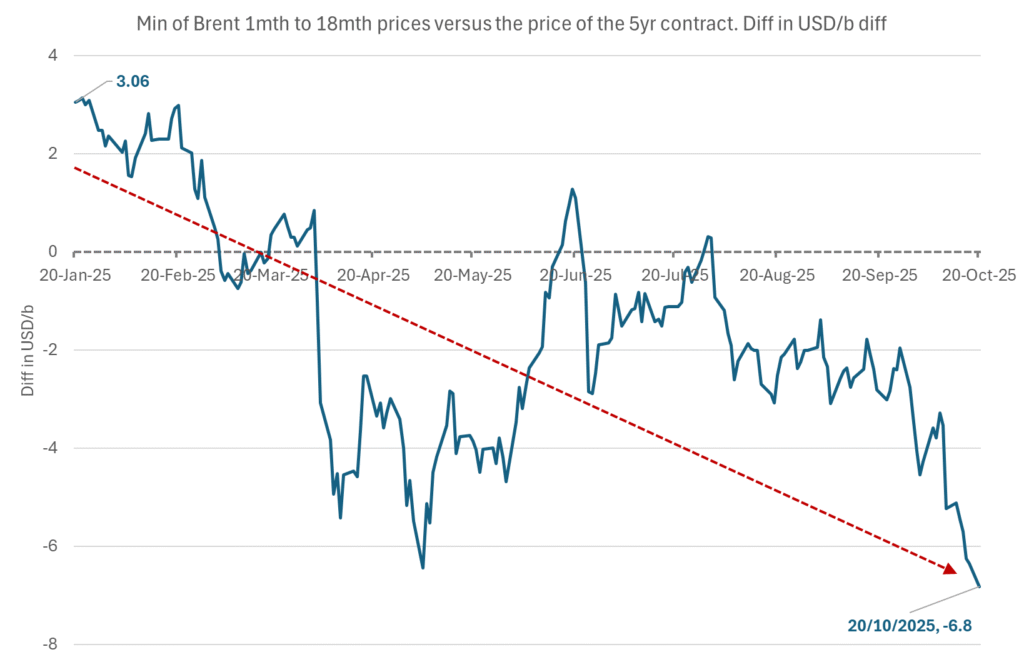
The front-end backwardation has been on a weakening foot and is now about to fully disappear. The lowest point of the crude oil curve has also moved steadily lower and lower and its discount to the 5yr contract is now $6.8/b. A solid contango. The Brent 3mth contract did actually dip into the $50ies/b intraday on Friday when it traded to a low point of $59.93/b.
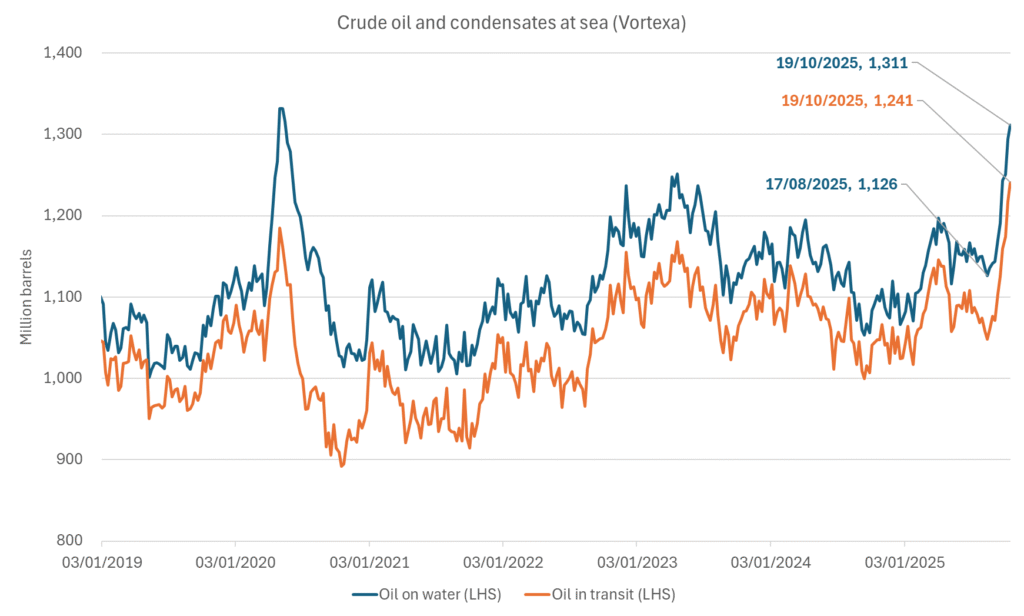
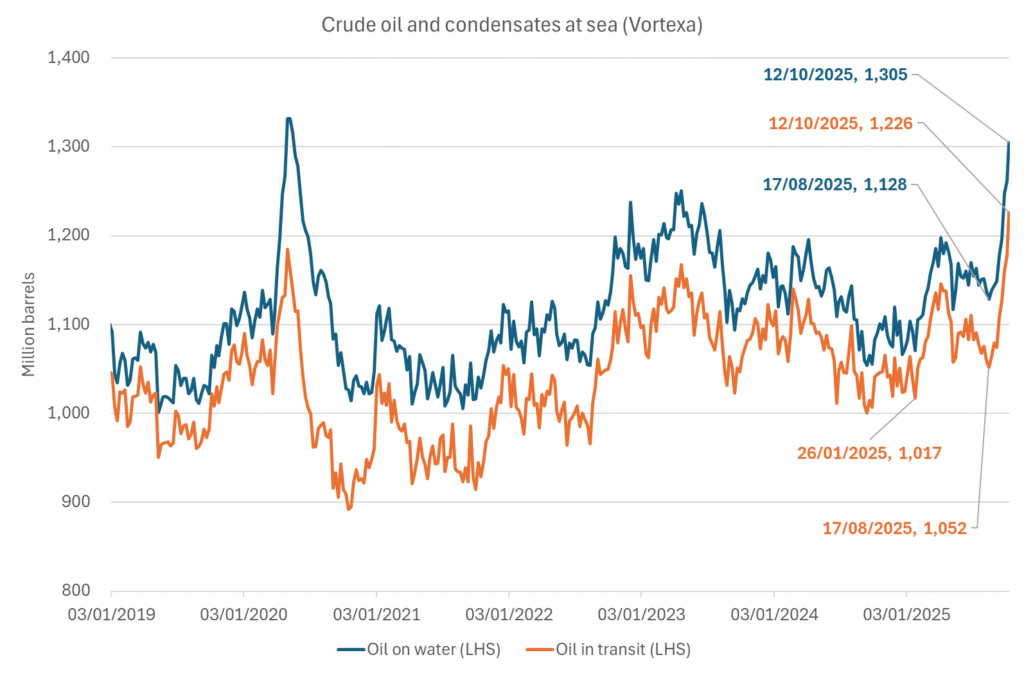
More weakness to come as lots of oil at sea comes to ports. Mid-East OPEC countries have boosted exports along with lower post summer consumption and higher production. The result is highly visibly in oil at sea which increased by 17 mb to 1,311 mb over the week to Sunday. Up 185 mb since mid-August. On its way to discharge at a port somewhere over the coming month or two.
Don’t forget that the oil market path ahead is all down to OPEC+. Remember that what is playing out in the oil market now is all by design by OPEC+. The group has decided that the unwind of the voluntary cuts is what it wants to do. In a combination of meeting demand from consumers as well as taking back market share. But we need to remember that how this plays out going forward is all at the mercy of what OPEC+ decides to do. It will halt the unwinding at some point. It will revert to cuts instead of unwind at some point.
A few months with Brent at $55/b and 40-50 US shale oil rigs kicked out may be what is needed. We think OPEC+ needs to see the exit of another 40-50 drilling rigs in the US shale oil patches to set US shale oil production on a path to of a 1 mb/d year on year decline Dec-25 to Dec-26. We are not there yet. But a 2-3 months period with Brent crude averaging $55/b would probably do it.
Oil on water increased 17 mb over the week to Sunday while oil in transit increased by 23 mb. So less oil was standing still. More was moving.
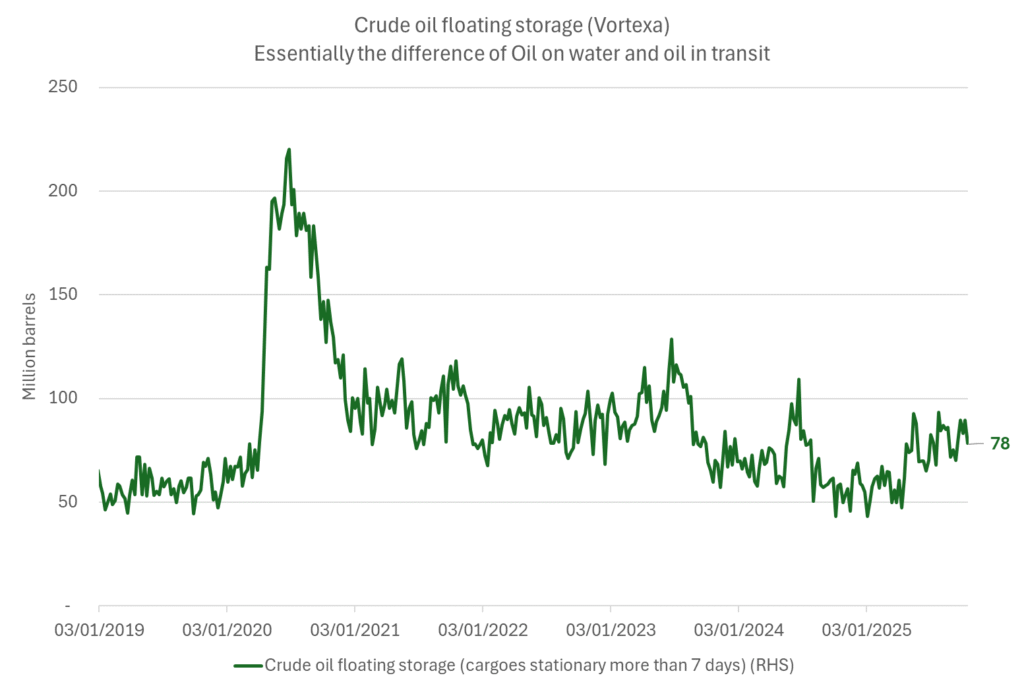
Crude oil floating storage (stationary more than 7 days). Down 11 mb over week to Sunday
The lowest point of the Brent crude oil curve versus the 5yr contract. Weakest so far this year.
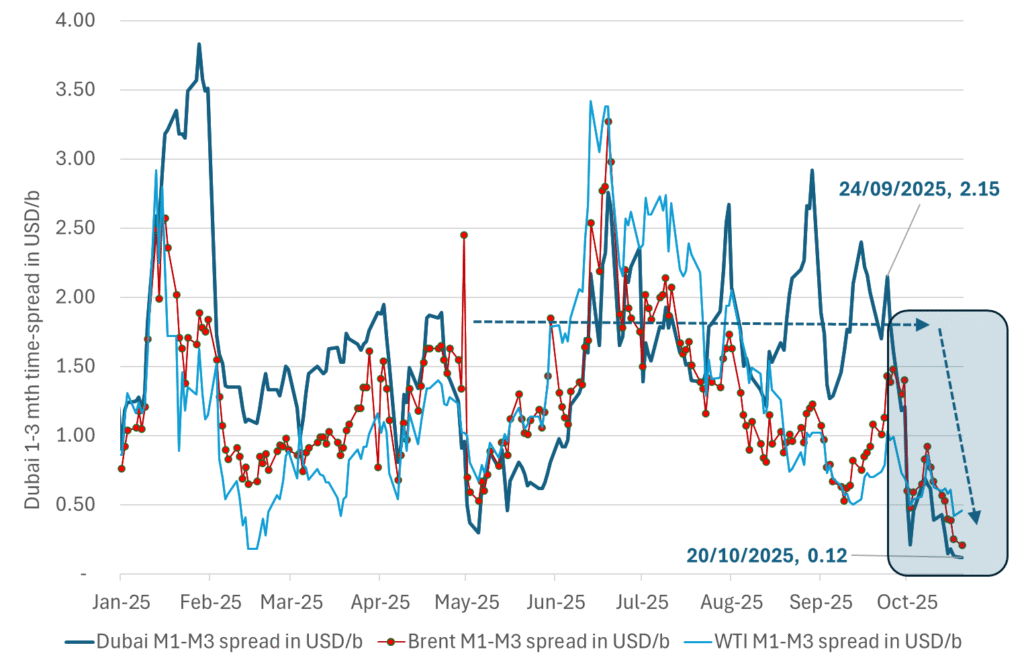
Crude oil 1mth to 3mth time-spreads. Dubai held out strongly through summer, but then that center of strength fell apart in late September and has been leading weakness in crude curves lower since then.
Rebounding along with most markets. But concerns over solidity of Gaza peace may also contribute. Brent crude fell 0.8% yesterday to $61.91/b and its lowest close since May this year. This morning it is bouncing up 0.9% to $62.5/b along with a softer USD amid positive sentiment with both equities and industrial metals moving higher. Concerns that the peace in Gaza may be less solid than what one might hope for also yields some support to Brent. Bets on tech stocks are rebounding, defying fears of trade war. Money moving back into markets. Gold continues upwards its strong trend and a softer dollar helps it higher today as well.
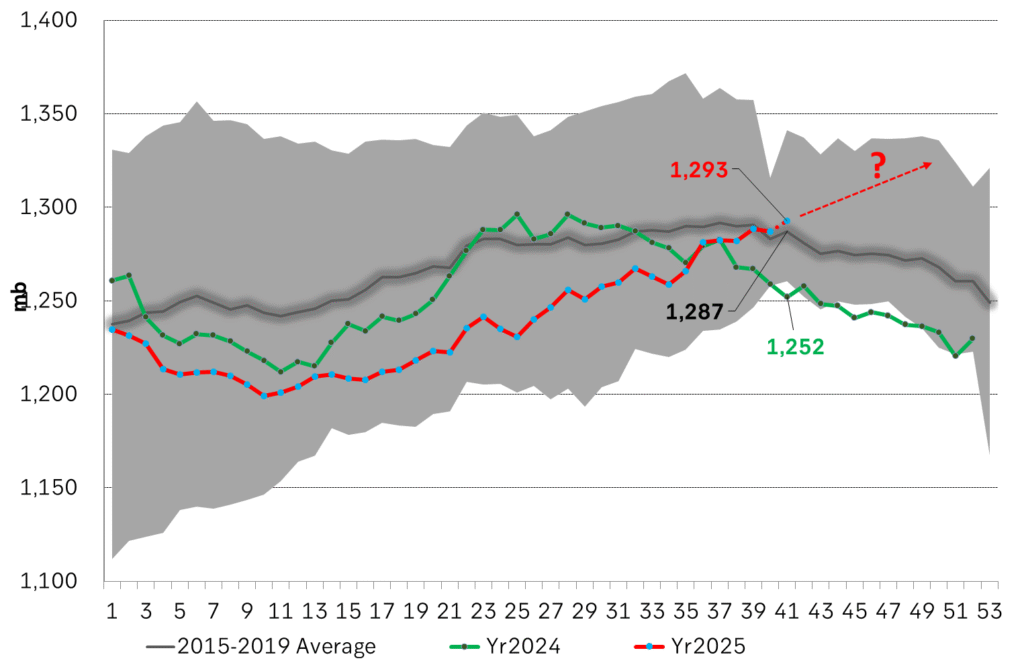
US crude & products probably rose 5.6 mb last week (API) versus a normal seasonal decline of 2.4 mb. The US API last night partial and thus indicative data for US oil inventories. Their data indicates that US crude stocks rose 7.4 mb last week, gasoline stocks rose 3.0 mb while Distillate stocks fell 4.8 mb. Altogether an increase in commercial crude and product stocks of 5.6 mb. Commercial US crude and product stocks normally decline by 2.4 mb this time of year. So seasonally adjusted the US inventories rose 8 mb last week according to the indicative numbers by the API. That is a lot. Also, the counter seasonal trend of rising stocks versus normally declining stocks this time of year looks on a solid pace of continuation. If the API is correct then total US crude and product stocks would stand 41 mb higher than one year ago and 6 mb higher than the 2015-19 average. And if we combine this with our knowledge of a sharp increase in production and exports by OPEC(+) and a large increase in oil at sea, then the current trend in US oil inventories looks set to continue. So higher stocks and lower crude oil prices until OPEC(+) switch to cuts. Actual US oil inventory data today at 18:00 CET.
US commercial crude and product stocks rising to 1293 mb in week 41 if last nights indicative numbers from API are correct.
Crude oil soon coming to a port near you. OPEC has lifted production sharply higher this autumn. At the same time demand for oil in the Middle-East has fallen as we have moved out of summer heat and crude oil burn for power for air-conditioning. The Middle-East oil producers have thus been able to lift exports higher on both accounts. Crude oil and condensates on water has shot up by 177 mb since mid-August. This oil is now on its way to ports around the world. And when they arrive, it will likely help to lift stocks onshore higher. That is probably when we will lose the last bit of front-end backwardation the the crude oil curves. That will help to drive the front-month Brent crude oil price down to the $60/b line and revisit the high $50ies/b. Then the eyes will be all back on OPEC+ when they meet in early November and then again in early December.
Crude oil and condensates at sea have moved straight up by 177 mb since mid-August as OPEC(+) has produced more, consumed less and exported more.
When it starts to move lower it moves rather quickly. Gaza, China, IEA. Brent crude is down 2.1% today to $62/b after having traded as high as $66.58/b last Thursday and above $70/b in late September. The sell-off follows the truce/peace in Gaze, a flareup in US-China trade and yet another bearish oil outlook from the IEA.
A lasting peace in Gaze could drive crude oil at sea to onshore stocks. A lasting peace in Gaza would probably calm down the Houthis and thus allow more normal shipments of crude oil to sail through the Suez Canal, the Red Sea and out through the Bab-el-Mandeb Strait. Crude oil at sea has risen from 48 mb in April to now 91 mb versus a pre-Covid normal of about 50-60 mb. The rise to 91 mb is probably the result of crude sailing around Africa to be shot to pieces by the Houthis. If sailings were to normalize through the Suez Canal, then it could free up some 40 mb in transit at sea moving onshore into stocks.
The US-China trade conflict is of course bearish for demand if it continues.
Bearish IEA yet again. Getting closer to 2026. Credibility rises. We expect OPEC to cut end of 2025. The bearish monthly report from the IEA is what it is, but the closer we get to 2026, the more likely the IEA is of being ball-park right in its outlook. In its monthly report today the IEA estimates that the need for crude oil from OPEC in 2026 will be 25.4 mb/d versus production by the group in September of 29.1 mb/d. The group thus needs to do some serious cutting at the end of 2025 if it wants to keep the market balanced and avoid inventories from skyrocketing. Given that IEA is correct that is. We do however expect OPEC to implement cuts to avoid a large increase in inventories in Q1-26. The group will probably revert to cuts either at its early December meeting when they discuss production for January or in early January when they discuss production for February. The oil price will likely head yet lower until the group reverts to cuts.
Dubai: The Mid-East anchor dragging crude oil lower. Surplus emerging in Mid-East pricing. Crude oil prices held surprisingly strong all through the summer. A sign and a key source of that strength came from the strength in the front-end backwardation of the Dubai crude oil curve. It held out strong from mid-June and all until late September with an average 1-3mth time-spread premium of $1.8/b from mid-June to end of September. The 1-3mth time-spreads for Brent and WTI however were in steady deterioration from late June while their flat prices probably were held up by the strength coming from the Persian Gulf. Then in late September the strength in the Dubai curve suddenly collapsed. Since the start of October it has been weaker than both the Brent and the WTI curves. The Dubai 1-3mth time-spread now only stands at $0.25/b. The Middle East is now exporting more as it is producing more and also consuming less following elevated summer crude burn for power (Aircon) etc.
The only bear-element missing is a sudden and solid rise in OECD stocks. The only thing that is missing for the bear-case everyone have been waiting for is a solid, visible rise in OECD stocks in general and US oil stocks specifically. So watch out for US API indications tomorrow and official US oil inventories on Thursday.
No sign of any kind of fire-sale of oil from Saudi Arabia yet. To what we can see, Saudi Arabia is not at all struggling to sell its oil. It only lowered its Official Selling Prices (OSPs) to Asia marginally for November. A surplus market + Saudi determination to sell its oil to the market would normally lead to a sharp lowering of Saudi OSPs to Asia. Not yet at least and not for November.
The 5yr contract close to fixed at $68/b. Of importance with respect to how far down oil can/will go. When the oil market moves into a surplus then the spot price starts to trade in a large discount to the 5yr contract. Typically $10-15/b below the 5yr contract on average in bear-years (2009, 2015, 2016, 2020). But the 5yr contract is usually pulled lower as well thus making this approach a moving target. But the 5yr contract price has now been rock solidly been pegged to $68/b since 2022. And in the 2022 bull-year (Brent spot average $99/b), the 5yr contract only went to $72/b on average. If we assume that the same goes for the downside and that 2026 is a bear-year then the 5yr goes to $64/b while the spot is trading at a $10-15/b discount to that. That would imply an average spot price next year of $49-54/b. But that is if OPEC doesn’t revert to cuts and instead keeps production flowing. We think OPEC(+) will trim/cut production as needed into 2026 to prevent a huge build-up in global oil stocks and a crash in prices. But for now we are still heading lower. Into the $50ies/b.




Gruvbolaget Boliden överträffade analytikernas förväntningar

Australien och USA investerar 8,5 miljarder USD för försörjningskedja av kritiska mineraler
Brent crude set to dip its feet into the high $50ies/b this week

Vad guldets uppgång egentligen betyder för världen

Spotpriset på guld över 4300 USD och silver över 54 USD

OPEC+ missar produktionsmål, stöder oljepriserna

Goldman Sachs höjer prognosen för guld, tror priset når 4900 USD

Blykalla och amerikanska Oklo inleder ett samarbete
Guld nära 4000 USD och silver 50 USD, därför kan de fortsätta stiga
Are Ukraine’s attacks on Russian energy infrastructure working?
-
 Nyheter4 veckor sedan
OPEC+ missar produktionsmål, stöder oljepriserna
-
 Nyheter2 veckor sedan
Goldman Sachs höjer prognosen för guld, tror priset når 4900 USD
-
 Nyheter3 veckor sedan
Blykalla och amerikanska Oklo inleder ett samarbete
-
 Nyheter3 veckor sedan
Guld nära 4000 USD och silver 50 USD, därför kan de fortsätta stiga
-
Analys4 veckor sedan
Are Ukraine’s attacks on Russian energy infrastructure working?
-
 Nyheter2 veckor sedan
Leading Edge Materials är på rätt plats i rätt tid
-

 Nyheter3 veckor sedan
Ett samtal om guld, olja, koppar och stål
-

 Nyheter2 veckor sedan
Nytt prisrekord, guld stiger över 4000 USD