

Analys
SEB – Råvarukommentarer, 25 juni 2013

Rekommendationer

*) Avkastningen avser 1:1 råvarucertifikat där de ingår i rekommendationen. I den aktuella tabellen ovan har jag tagit prisförändringen den senaste veckan sedan det förra veckobrevet publicerades.
Inledning
Kinas inköpschefsindex för tillverkningsindustrin (PMI) som i maj låg på 50.8, väntas för juni i rapporten som släpps den 1 juli hamna på 50.1. Ett indexvärde >50 indikerar tillväxt. HSBC ”Flash PMI” för Kina, en slags ledande indikator, till den ledande konjunkturindikatorn PMI, som publicerades förra veckan, hamnade dock på 48.3 i förra veckan. Detta betyder att tillväxten i Kinas ekonomi håller på att avta. Kinas PMI ligger nu på den lägsta nivån på nio månader och det går rykten om en ”run on the banks”.
Beskedet från Bernanke och Fed förra onsdagen, att man kan komma att trappa ned obligationsköpen redan senare i år om den amerikanska ekonomin fortsätter att återhämta sig i linje med Feds prognos, satte de finansiella marknaderna i gungning och har gett stora prisrörelser på räntor, valutor, aktier och råvaror. På obligationsmarknaden har amerikanska räntor stigit kraftigt sedan Feds besked och räntan på en 10-årig amerikansk statsobligation ligger i just nu på ca 2.57% jämfört med ungefär 2.20% innan Feds besked i onsdags. Det är den högsta räntenivån sedan mitten på 2011 och uppgången har dragit med sig globala obligationsräntor.
På valutamarknaden följdes Feds besked av en kraftig dollarförstärkning mot flertalet valutor, men främst mot EM- och råvarurelaterade valutor. Även de skandinaviska valutorna har dragits med i rörelserna och försvagades i slutet på veckan mot främst dollarn i marknader med tunn likviditet.
Även guldpriset föll efter Fed och guldet handlas sedan i slutet på veckan under 1 300 dollar, vilket är lägre än botten från den kraftiga nedgången i april. Med minskad riskaptit reagerade också aktiemarknaderna negativ på Feds besked och sålde av under främst onsdagen och torsdagen. Det breda amerikanska aktieindexet S&P500 föll med 2.1% under förra veckan trots en uppgång de första dagarna och en försiktig återhämtning med 0.3% under fredagen. Den här veckan har inletts med nedgångar i Asien (Nikkei -0.4%) samtidigt som trycket på obligationsräntorna består.
I Brasilien har befolkningen startat vad som först såg ut att vara en revolution – riktad mot den socialistiska regeringen. Det började med en spontan urladdning i São Paulo mot höjningen av priset på redan höga bussbiljetter. I skrivande stund pågår protesterna fortfarande, men i mindre omfattning än för en vecka sedan. En lägre efterfrågan på råvaror från andra tillväxtländer, främst Kina, har drabbat råvarulandet Brasilien hårt, i kombination med den styrande presidenten Dilma Rousseffs oförutsägbara ekonomiska detaljpolitik. Priset på järnmalm, socker och kaffe har halverats på två år och priset på soja och majs sjunkit avsevärt sedan i vintras. Till den ekonomiska politikens haverier hör bland annat en skatt på betalningar till landet, ett pristak på bränsle (som drabbar energiföretag, bland annat det nästan kapsejsade flaggskeppet Petrobras), med mera. Inflationen på vanliga konsumentvaror stiger. Minnet av 90-talets inflationstakt på tusentals procent finns kvar. Börsens nedgång övergick i börskrasch för en månad sedan och valutan har rasat. På landets flagga står valspråket ”ordem e progrosso”, [ordning och framsteg] en ironi med det styre som landet har, enligt dem som protesterar. En fallande valuta innebär allt annat lika att inhemsk produktion blir mer lönsam och då ökar den produktionen. Inom jordbruksområdet handlar det om majs, soja, socker och kaffe.
Det här är det sista veckobrevet innan sommaruppehållet. Vi önskar alla en skön och lyckosam sommar i marknaden.
Råolja – Brent
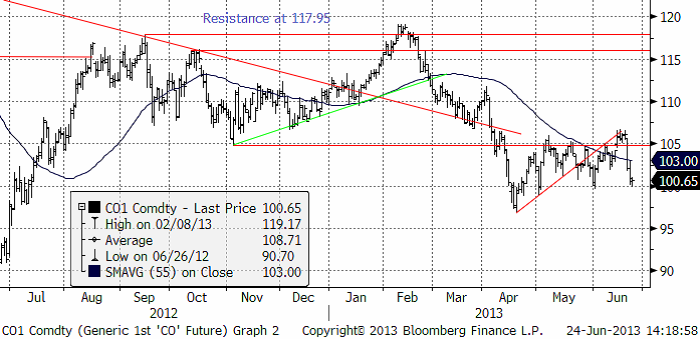
Som nämnt ovan fick Bernankes tal om ett slut på QE och Kinas fallande inköpschefsindex (PMI), marknaden på fall förra veckan. Oljepriset gick ner till 100 dollar, där det finns ett tekniskt stöd.
Det verkar som om ”ingen” har någon insyn i vad som sker i Kina. På en aluminiumkonferens vi deltog i, i Amsterdam i början av förra veckan, lämnades Kina i stort sett utanför diskussionen, därför att ingen hade några konkreta fakta mer än ”7.5% tillväxt” att diskutera.
Norges Storting fattade beslut under måndagen att tillåta E&P i Barents hav, på gränsen till Ryssland. Det antas finnas stora mängder olja och framförallt gas på kontinentalsockeln där, vid mindre än 500 meters havsdjup.
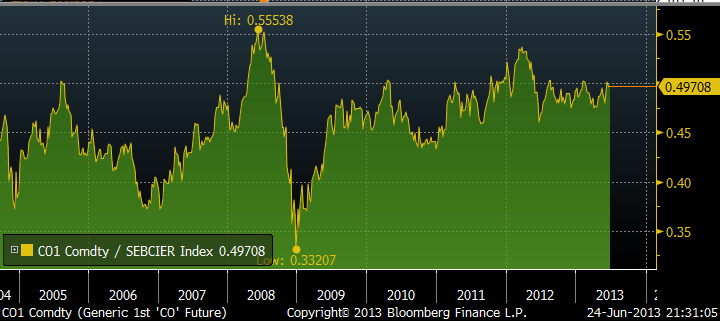
Jämfört med många andra råvaror har oljepriset ännu inte korrigerats nedåt. Nedan ser vi ett diagram över kvoten oljepris / SEB:s råvaruindex. Oljepriset ligger på en ovanligt hög nivå i förhållande till andra råvaror. En kvot på 0.45 (som i diagrammet nedan), en mer ”normal” relation till andra råvarupriser, skulle innebära ett pris på 90 dollar per fat.
Vi väljer att återgå till säljrekommendation på olja och rekommenderar köp av BEAR OLJA X2 S.
Elektricitet
Baissen på elbörsen har fortsatt sedan förra veckobrevet och priset har kommit ner ordentligt. Som vanligt gäller att försöka vara beredd på att köpa, men att vänta på en bekräftelse på att botten är nådd. Vi fortsätter med neutral rekommendation.
Hydrologisk balans backade något när 10-veckors prognos enligt Markedskraft hamnade nådde upp till normal balans (röd kurva nedan).
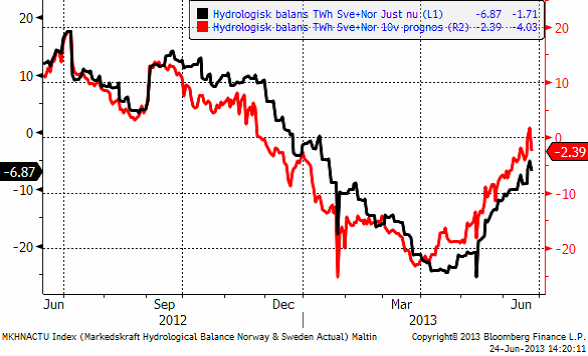
Priset har kommit ner så pass att det börjar bli intressant att köpa el, men rekommendationen blir än så länge ”neutral”.
Naturgas
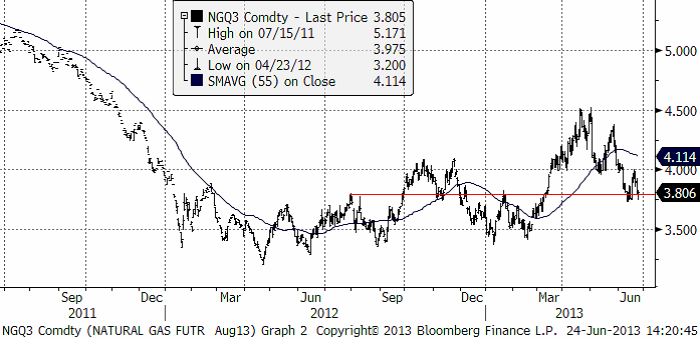
Naturgaspriset har backat ner till 3.80 dollar per MMBtu, där ett tekniskt stöd finns. Vi tror att det kan vara intressant att köpa på den här nivån, men vill gärna se en bekräftelse på att prisfallet har stannat av. Rekommendationen blir därför alltjämt ”neutral”.
Guld och Silver
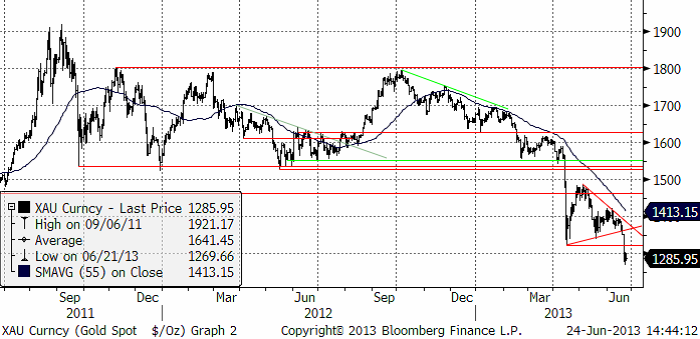
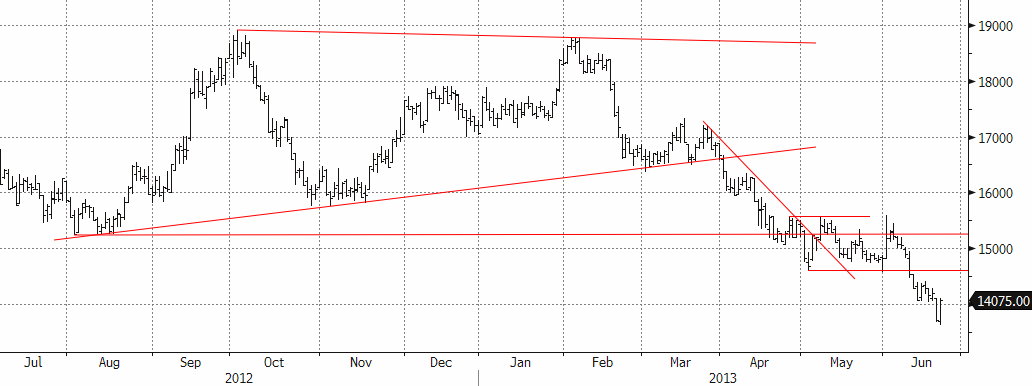
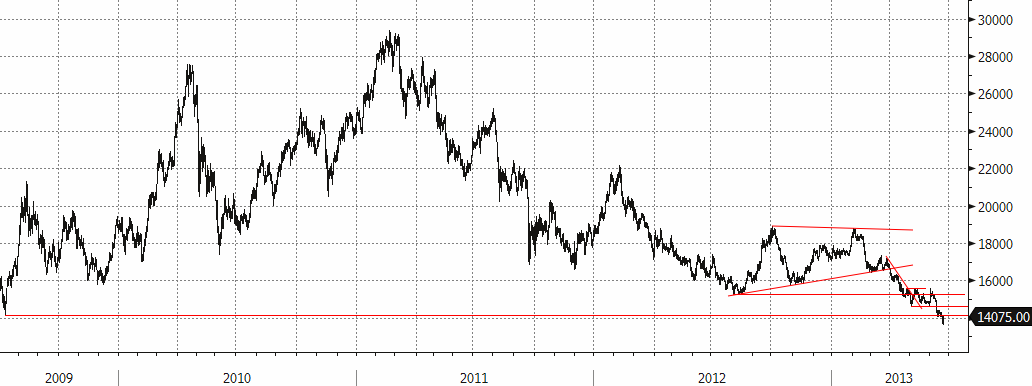
Guldpriset bröt ur triangelformationen på nedsidan och föll rakt genom stödet på 1322 dollar. Tekniskt indikeras nedgång till 1200 eller därunder. Det betyder att den onödiga neutral-rekommendationen vi gav i förra veckobrevet i väntan på utbrott ur triangelformationen, går tillbaka till en säljrekommendation.
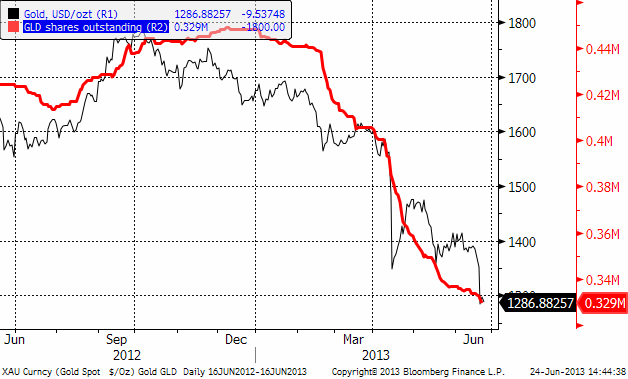
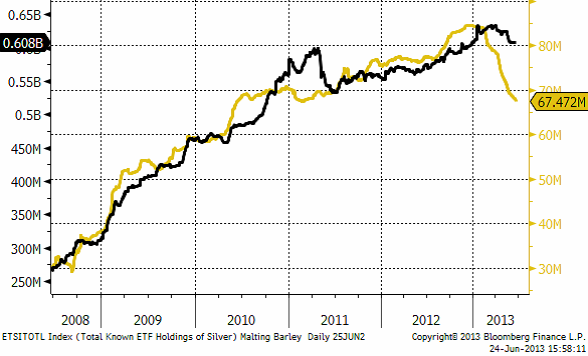
Investerare fortsätter att likvidera sina innehav av Gold Spiders, som vi ser nedan. Det var en mycket kort paus, men när prisfallet fortsatte, fortsatte även likvideringen av guld som investering.
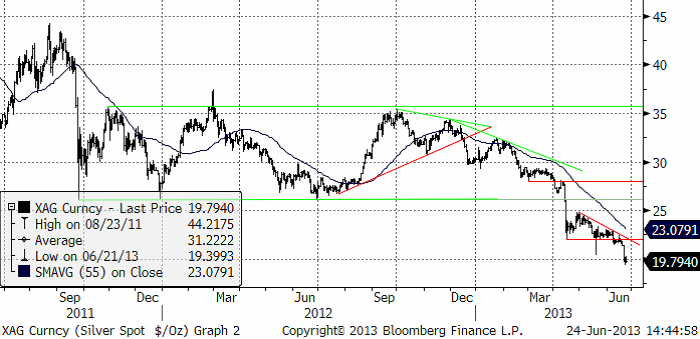
Nedan ser vi kursdiagrammet för silver i dollar per troy ounce. Prisfallet har nu nått under 20 dollar.
Medan ETF:ers innahav av guld har rasat i år från 85 miljoner uns till 76 miljoner uns, har innehavet av silver knappast påverkats alls av baissen. Som mest var det 640 miljoner uns i ETF:er och det har bara minskat till 608 miljoner. Skulle silverinvesterarna få för sig att likvidera kan det få silvermarknaden på ännu mer fall. För att komma ikapp guld-ETF:erna skulle silver-EFT:erna nu behöva minska med 50 miljoner uns.
Förra veckan gick vi något onödigt över till neutral rekommendation i väntan på utbrott ur triangeln, och missade prisfallet som kom. Vi går nu tillbaka till att rekommendera såld position, dvs köp av BEAR GULD X4 S och BEAR SILVER X4 S.
Platina & Palladium
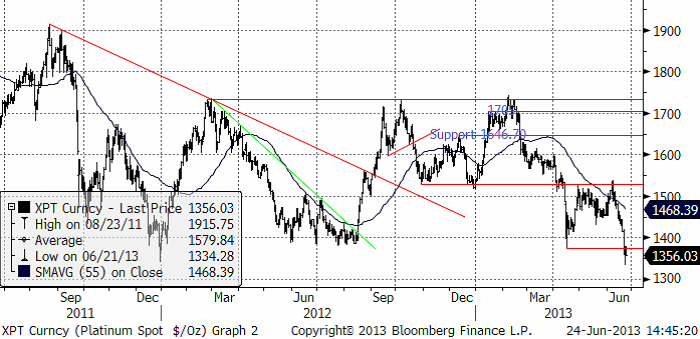
Platina föll kraftigt i veckan som gick. Prisfallet bröt flera tekniska stöd. Tekniskt är platina ”översålt”. Frågan är om det finns några fyndköpare som är modiga nog att ge sig ut och köpa.
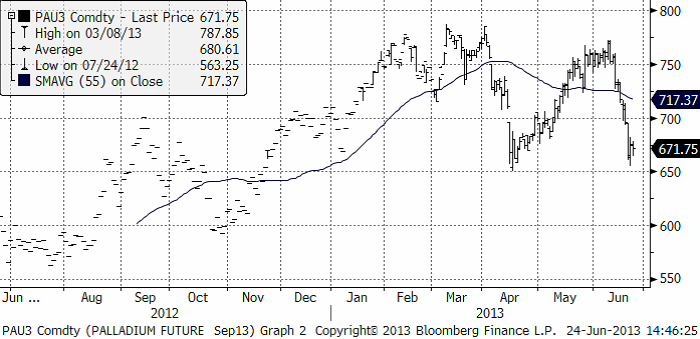
Septemberkontraktet på palladium har fallit till stödet på 650 dollar per troy uns. Prisfallet har hejdats där, åtminstone temporärt, men det ser inte positivt ut och blir det en rekyl uppåt från den här nivån är det sannolikt enbart ett mycket bra tillfälle att köpa BEAR PALLAD X4 S.
Basmetaller
Veckans utveckling på den makroekonomiska scenen har definitivt inte gynnat metaller och andra industriella råvaror. Priserna har fallit på bred front. Basmetaller och olja är ner 3-5 % under veckan. Värst är rasen för de ädla metallerna med guldet i spetsen, som noteras ner 7 %. Silver är värst med ett ras på 9 %. Dollarn har samtidigt stigit, mot kronan ca 4 % vilket gör basmetallerna i princip är oförändrade under veckan räknat i SEK.
Bernankes tal på onsdagskvällen blev utlösande faktor för rasen under torsdagen. Utvecklingen på räntemarknaden i Kina, där korta räntor steg kraftigt i slutet av veckan, gjorde också sitt för att sprida oro. Marknaden förvånas att centralbanken (i Kina) inte släpper till likviditet i större omfattning. Minskade stimulanser från USA och en likviditetssqueeze i Kina är naturligtvis inte bra för metaller (på kort sikt). Som lök på laxen kom de preliminära inköpsindexsiffrorna (Markits) in svagare än väntat både i Kina och US.
Med lite eftertanke så är nog inte allt så nattsvart. Det faktum att FED börjar fundera på ett avslut av stimulanserna och en normalisering av räntemarknaden, är ett tecken på att tillväxten kommer och att arbetsmarknaden förbättras. Således ett tecken på bättre metallefterfrågan på lite sikt. Den amerikanska konjunkturen växer, Europa går åt rätt håll och Kina växer starkt, om än i en lägre takt än tidigare.
Trots det har det negativa stämningsläget gripit tag i marknaden, vilket riskerar att driva ner priserna ännu lägre. Avvaktan är därför på sin plats tills läget klarnat, framför allt gäller det läget i den kinesiska ekonomin.
Koppar
Om vi ser på koppar isolerat, är egentligen nyhetsflödet ganska ”positivt” i den bemärkelsen att utbudet riskerar att påverkas negativt de kommande månaderna. Det finns risk att det blir ”tight”, åtminstone tillfälligt. Grassberggruvan deklarerade force majeure för alla kopparleveranser för två veckor sedan. Gruvan stängdes på order av den Indonesiska regeringen för en översyn efter en rad dödsolyckor på senare tid (de senaste indikationerna tyder på en snarare återgång än tidigare väntat). Ett jordskred tidigare under året vid den stora Binghamgruvan i Utah US, är stängd sedan flera månader. Bristen är inte lika stor på koppar som för några år sedan, men utbudsstörningarna riskerar att få effekt, om de blir långvariga. Kinas importsiffror från förra månaden visar ett ökat intag av koppar. Delvis är det en eftersläpande säsongseffekt efter det kinesiska nyåret, men icke desto mindre en positiv information till marknaden. Det ryktas samtidigt att regeringen är ute och sonderar för att öka de strategiska inköpen (historiskt har Kina varit stor köpare när priset dippar under $7000).
Som vi skrivit tidigare har vi haft kopparn under bevakning för att gå från neutral till köp. Tekniskt sett har vi bedömt förutsättningarna som goda för kortsiktig uppgång. Trots de senaste veckornas tveksamhet, tar vi fasta på indikationer att det negativa stämningsläget kring koppar håller på att svänga om. Som vi skrivit tidigare tyder mycket på att lagren i Kina har betats av, och att avmattningen av importen är relativt snart övergående (vilket veckans siffra tyder på – se graf).
Kinas kopparimport (1000-tals ton)
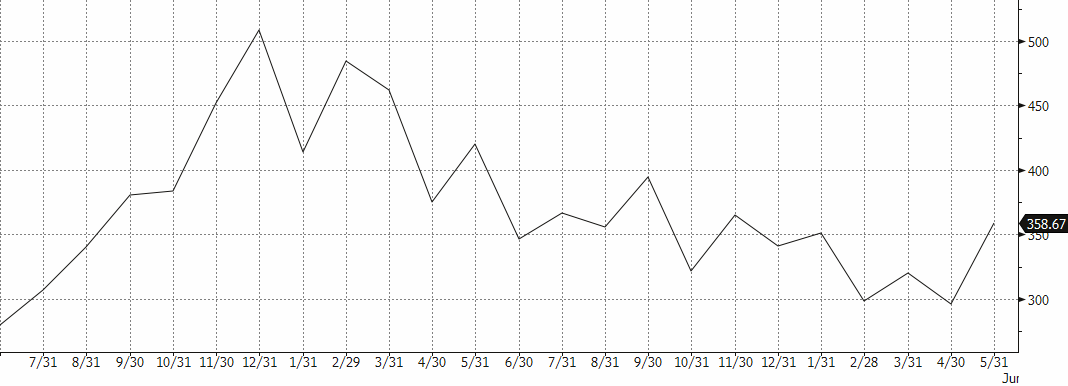
Vi skrev förra veckan att de senaste veckornas svaga utveckling sätter kopparn i ett mer neutralt läge i en sidledes trend. Vi skriv vidare att avvaktan kunde vara på sin plats – ”om priset faller under $7000, är det köpläge igen, framför allt om vi når nivåer kring $6800 igen”. Nu är marknaden där och testar av stödnivåerna. Med tanke på den oroliga situationen på finansmarknaden kan det vara värt att vara fortsatt på sidlinjen och bevaka utvecklingen extra noga under veckan.
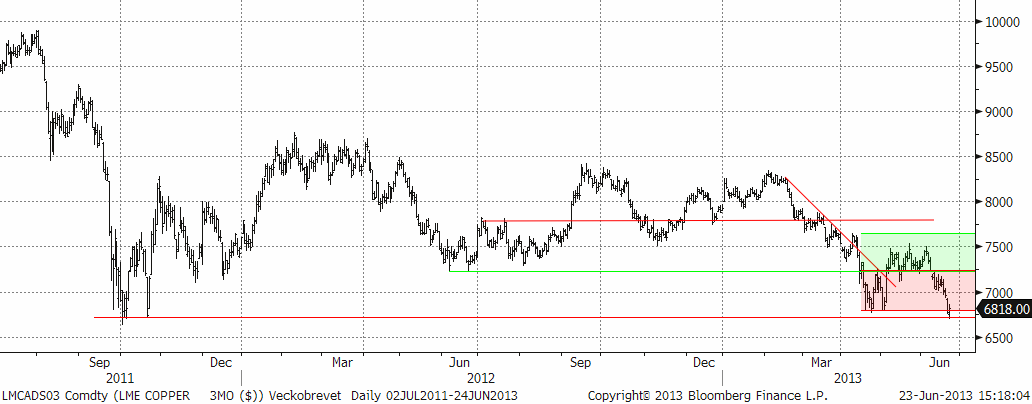
Vi förväntar oss fortsatt hög volatilitet. Vår kortsiktiga bedömning talar för uppsidan och vi rekommenderar därför köp av BULL KOPPAR X2 S eller X4 S.
Aluminium
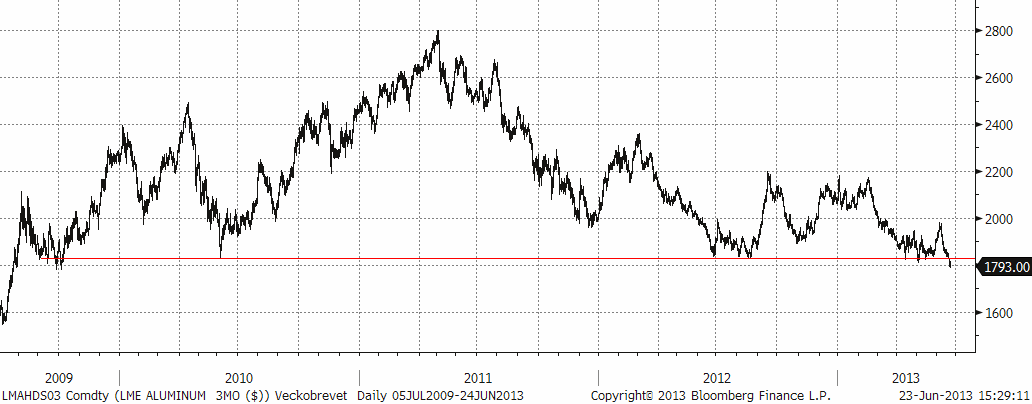
Priset har nu ”testat” stödnivåerna vid $1810-20 vid ett flertal tillfällen, och lyckats studsa upp, vilket vi tolkat som ett styrketecken. Förra veckans utveckling med FEDs kommentarer i kombination med oro för Kinas efterfrågan blev dock för mycket. De finansiella aktörerna fick överhanden och priset pressades under ned psykologiskt viktiga $1800- nivån. De senaste veckornas utveckling är ett tecken på att det är för tidigt att se den stora vändningen för aluminium. Lagren är för stora än så länge och det tar tid att ”beta av”. Vi ser ändå långsiktiga tecken på att marknaden dock succesivt håller på att bottna ur.
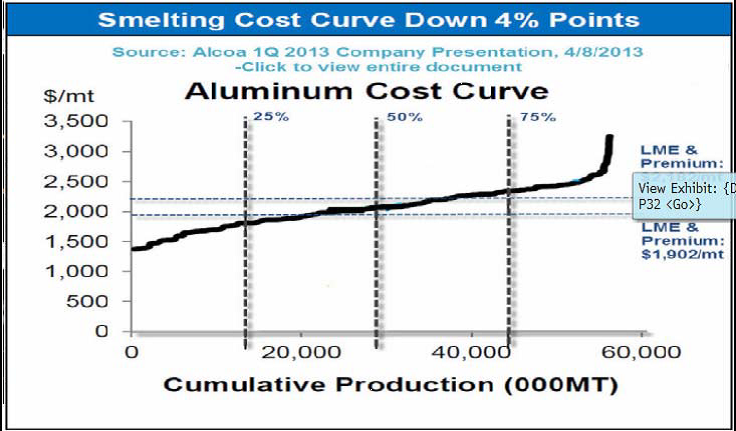
Högkostnadsproducenterna, framför allt i Kina, förväntas minska utbudet (ännu mer) om priset långvarigt stannar på nuvarande nivåer. Den största aluminiumproducenten Chalco, har redan annonserat att de stänger ytterligare produktionskapacitet motsvarande 380 tton. Den senaste prisutvecklingen aktualiserar vikten av produktions-begränsningar. 30-40 % av den globala produktionskapaciteten är enligt Alcoa olönsamt på dagens prisnivå (inklusive fysiska premier). Se grafen nedan.
Långsiktigt är nivån väldigt intressant för kontraktet ALUMINIUM S (utan hävstång). Det rådande läget på den finansiella marknaden manar dock till avvaktan. Det finns risk för ännu lägre pris på kort sikt.
Zink
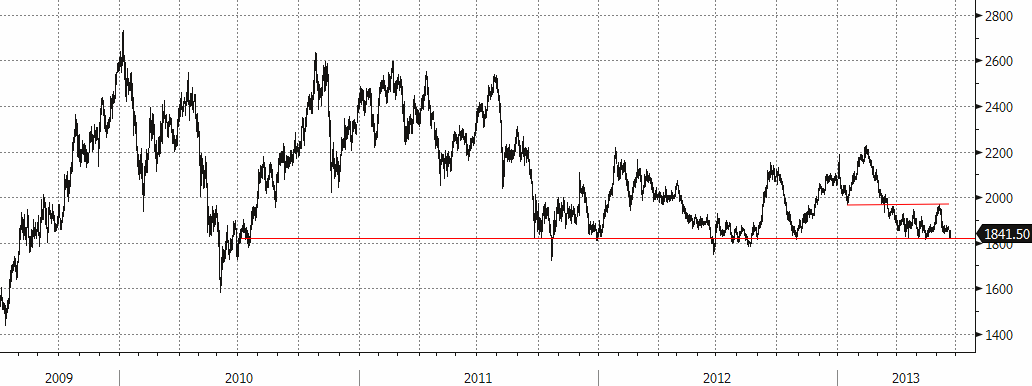
Situationen för zink påminner om den för aluminium, både fundamentalt och tekniskt. Vi bedömer zinken som ”billig” ur ett kostnadsperspektiv och nuvarande nivåer är mycket intressanta på lite längre sikt (6-12 månader). I det perspektivet är ZINK S (utan hävstång) att föredra. Men precis som för övriga metaller kan vi inte räkna bort ytterligare press på kort sikt i linje med det allmänna stämningsläget.
Nickel
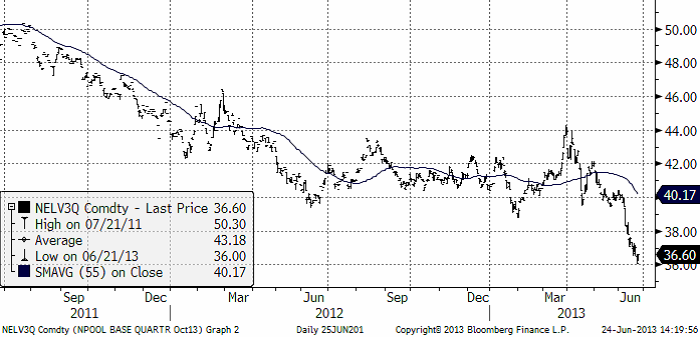
Nickel uppvisar förnyad svaghet. Priset bröt igenom stödet vid $14000 under veckan. Det verkar inte finnas någon hejd på prisfallet. Marknaden debatterar var produktionskostnaden ligger för nickelproduktionen i Kina.
Produktionstekniken av s.k. Nickel Pig Iron i Kina har utvecklats med s.k. Rotary Kiln Electric Furnaces (RKEF) teknik, vilken i genomsnitt sänker hela kostnadskurvan. På Ryans Notes Ferrolegeringskonferens i Amsterdam i förra veckan deklarerades det att nivån sannolikt ligger kring $13000. Samtidigt är de traditionella produktionsteknikerna sannolikt väldigt olönsamma på nuvarande nivåer. Att producenterna i gruvledet har problem, råder det ingen tvekan om. Vi har tidigare rapporterat om produktionsneddragningar i Australien, och det förväntas komma mer.
Klart är att effekten av RKEF-tekniken riskerar att flytta ner nivån där utbudsminskningarna verkligen får effekt. Priset har brutit viktiga stödnivåer, och vi får gå tillbaka till juli 2009 för att hitta lägre priser.3-månaders nickel noterades i $13628 som lägst på midsommarafton, men steg kraftigt mot slutet av dagen för att stänga över $14000. Vi kvarstår med bedömningen att nivåerna är mycket attraktiva på 6-12 månaders sikt. I det perspektivet är NICKEL S (utan hävstång) att föredra. Viss försiktighet rekommenderas på kort sikt med tanke på den senaste utvecklingen på de finansiella marknaderna.
Nickel från juni 2012
Nickel från juni 2008
[box]SEB Veckobrev Veckans råvarukommentar är producerat av SEB Merchant Banking och publiceras i samarbete och med tillstånd på Råvarumarknaden.se[/box]
Disclaimer
The information in this document has been compiled by SEB Merchant Banking, a division within Skandinaviska Enskilda Banken AB (publ) (“SEB”).
Opinions contained in this report represent the bank’s present opinion only and are subject to change without notice. All information contained in this report has been compiled in good faith from sources believed to be reliable. However, no representation or warranty, expressed or implied, is made with respect to the completeness or accuracy of its contents and the information is not to be relied upon as authoritative. Anyone considering taking actions based upon the content of this document is urged to base his or her investment decisions upon such investigations as he or she deems necessary. This document is being provided as information only, and no specific actions are being solicited as a result of it; to the extent permitted by law, no liability whatsoever is accepted for any direct or consequential loss arising from use of this document or its contents.
About SEB
SEB is a public company incorporated in Stockholm, Sweden, with limited liability. It is a participant at major Nordic and other European Regulated Markets and Multilateral Trading Facilities (as well as some non-European equivalent markets) for trading in financial instruments, such as markets operated by NASDAQ OMX, NYSE Euronext, London Stock Exchange, Deutsche Börse, Swiss Exchanges, Turquoise and Chi-X. SEB is authorized and regulated by Finansinspektionen in Sweden; it is authorized and subject to limited regulation by the Financial Services Authority for the conduct of designated investment business in the UK, and is subject to the provisions of relevant regulators in all other jurisdictions where SEB conducts operations. SEB Merchant Banking. All rights reserved.

Market is starting to take US/Iran headlines with a pinch of salt. Brent crude rose $2.8/b yesterday to an official close of $112.1/b. But after that it traded as low as $108.05/b before ending late night at around $109.7/b. Through the day it traded in a range of $106.87 – 112.72/b amid a flurry of news or rumors from Iran and the US. ”US temporary sanctions during negotiations” (falls alarm). ”We will bomb Iran” (not anyhow),… etc. While the market is still fluctuating to this kind of news flow, it is starting to take such headlines with a pinch of salt.

We’ll see. Maybe, maybe not. The Brent M1 contract is trading at $110.2/b this morning which very close to the average ticks through yesterday of $110.4/b.
Trump with bearish, verbal intervention whenever Brent trades above $110/b it seems. What seems to be a pattern is that Trump states something like ”very good negotiations going on with Iran”, ”New leaders in Iran are great,..”, ”Great progress in negotiations,…”, ”Deal in sight,..” etc whenever the Brent M1 contract trades above $110/b. An effort to cool the market. These hot air verbal interventions from Trump used to have a heavy bearish impact on prices, but they now seems to have less and less effect unless they are backed by reality.
As far as we can see there has been no real progress in the negotiations between the US and Iran with both sides still standing by their previous demands.
Iran is getting stronger while the cease fire lasts making a return to war for Trump yet harder. Iran is naturally in constant preparation for a return to war given Trump’s steady threats of bombing Iran again. Iran is naturally doing what ever is possible to prepare for a return to war. And every day the cease fire lasts it is better prepared. This naturally makes it more and more difficult and dangerous for the US to return to warring activity versus Iran as the consequences for energy infrastructure in the Persian Gulf will be more and more severe the longer the cease fire lasts. Israel seems to see it this way as well. That the war is not won and that current frozen state of a cease fire gives Iran opportunity to rebuild military and politically.
Global inventories are drawing down day by day. How much? In the meantime the Strait of Hormuz stays closed. There is varying measures and estimates of how much global inventories are drawing down. Our rough estimate, back of the envelope, is that global inventories are drawing down by at least some 10 mb/d or about 300 mb/d in a balance between loss of supply versus demand destruction. Other estimates we see are a monthly draw of 250-270 mb/d. The IEA only ’measured’ a draw in global observable stocks of 117 mb in April with oil on water rising 53 mb while on shore stocks fell 170 mb. But global stocks are hard to measure with large invisible, unmeasured stocks. As such a back of the envelope approach may be better.
Oil products is what the world is consuming. Oil product prices likely to rise while product stocks fall. Strategic Petroleum Reserves (SPR) are predominantly crude oil. Discharging oil from OECD SPR stocks, a sharp reduction in Chinese crude imports and a reduction in global refinery throughput of 6-7 mb/d has helped to keep crude oil markets satisfactorily supplied. But global inventories are drawing down none the less. And oil products is really what the world is consuming. So if global refinery throughput stays subdued, then demand will eventually have to match the supply of oil products. The likely path forward this summer is a steady draw down in jet fuel, diesel and gasoline. Higher prices for these. Then, if possible, higher refinery throughput and higher usage of crude in response to very profitable refinery margins. And lastly sharper draw in crude stocks and higher prices for these. But some 6 mb/d of oil products used to be exported through the Strait of Hormuz. And it may not be so easy to ramp up refinery activity across the world to compensate. Especially as Ukraine continues to damage Russian refineries as well as Russian crude production and export facilities.
Watch oil product stocks and prices as well as Brent calendar 2027. What to watch for this summer is thus oil product inventories falling and oil product premiums to crude rising. Another measure to watch is the Brent crude 2027 contract as it rises steadily day by day as the Strait of Hormuz stays closed and global oil inventories decline. The latter is close to the highest level since the start of the war and keeps rising.
The Brent M1 contract and the Brent 2027 prices and current price of jet fuel in Europe (ARA). All in USD/b

Our back of the envelope calculation of the global shortage created by the closure of the Strait of Hormuz. Note that 3.5 mb/d of discharge from SPR is also a draw. Note also that ’Forced demand loss’ of 2.5 mb/d is probably temporary and will fall back towards zero as logistics are sorted out leaving ’Price demand loss’ to do the job of balancing the market. Thus a shortfall of at least 9 mb/d created by the closure. More if SPR discharge is included and more if Forced demand loss recedes.

Brent is climbing higher. Front-month is at USD 106.3/bl this morning, close to a weekly high and a USD 9/bl jump from Mondays open. This is the move we flagged as a risk earlier in the week: the market shifting from ”a deal is around the corner” to ”this is going to take longer than we thought”.

Analyst Commodities, SEB
During April, rest-of-year Brent remained remarkably stable around USD 90/bl. A stability which rested on one single assumption: the SoH reopens around 1 May. That assumption is now slowly falling apart.
As we highlighted yesterday: every week of delay beyond 1 May adds (theoretically) ish USD 5/bl to the rest-of-year average, as global inventories draw 100 million barrels per week. i.e., a mid-May reopening implies rest-of-year Brent closer to USD 100/bl, and anything pushing into June or July takes us meaningfully higher.
What’s changed in the last 48 hours:
#1: The US military has formally warned that clearing suspected sea mines from SoH could take up to six months. That is a completely different timescale from what the financial market is pricing. Even a political deal tomorrow does not immediately reopen the strait.
#2: Trump has shifted his tone from urgency to ”strategic patience”. In yesterday’s press conference: ”Don’t rush me… I want a great deal.” The market is reading this as a president no longer feeling pressured by timelines, with the naval blockade running in the background.
#3: So far, the military activity is escalating, not de-escalating. Axios reports Iran is laying more mines in SoH. The US 3rd carrier strike group (USS George H.W. Bush) is arriving with two countermine vessels. Trump yesterday ordered the US Navy to destroy any Iranian boats caught laying mines. While CNN reports that the Pentagon is actively drawing up plans to strike Iranian SoH capabilities and individual Iranian military leaders if the ceasefire collapses. i.e., NOT a attitude consistent with an imminent deal!
Spot crude and product prices eased off the early-April highs on a combination of system rerouting and deal optimism. Both now weakening. Goldman estimates April Gulf output is reduced by 14.5 mbl/d, or 57% of pre-war supply, a number that keeps getting worse the longer this drags on.
Demand-side adaptation is ongoing: S. Korea has cut its Middle East crude dependence from 69% to 56% by pulling more from the Americas and Africa, and Japan is kicking off a second round of SPR releases from 1 May. But SPRs are finite.
Ref. to the negotiations, we should not bet on speed. The current Iranian leadership is dominated by genuine hardliners willing to absorb economic pain and run the clock to extract concessions. That is not a setup for a rapid resolution. US/Israeli media briefings keep framing the delay as ”internal Iranian divisions”, the reality is more complicated and points toward weeks and months, not days.
Our point is that the complexity is large, and higher prices have only just started (given a scenario where the negotiations drag out in time). The market spent April leaning on the USD 90/bl rest-of-year assumption; that case is diminishing by the hour. If ”early May reopening” is replaced by ”June, July or later” over the next week or two, both crude and products have meaningful room to reprice higher from here. There is a high risk being short energy and betting on any immediate political resolution(!).
Down on Friday. Up on Monday. The Brent June crude oil contract traded down 5.1% last week to a close of $90.38/b. It reached a high of $103.87/b last Monday and a low of $86.09/b on Friday as Iran announced that the Strait of Hormuz was fully open for transit. That quickly changed over the weekend as the US upheld its blockade of Iranian oil exports while Iran naturally responded by closing the SoH again. The US blew a hole in the engine room of the Iranian ship TOUSKA and took custody of the ship on Sunday. Brent crude is up 5.6% this morning to $95.4/b.
The cease-fire is expiring tomorrow. The US has said it will send a delegation for a second round of negotiations in Islamabad in Pakistan. But Iran has for now rejected a second round of talks as it views US demands as unrealistic and excessive while the US is also blocking the Strait of Hormuz.
While Brent is up 5% this morning, the financial market is still very optimistic that progress will be made. That talks will continue and that the SoH will fully open by the start of May which is consistent with a rest-of-year average Brent crude oil price of around $90/b with the market now trading that balance at around $88/b.
Financial optimism vs. physical deterioration. We have a divergence where the financial market is trading negotiations, improvements and resolution while at the same time the physical market is deteriorating day by day. Physical oil flows remain constrained by disrupted flows, longer voyage times and elevated freight and insurance costs.
Financial markets are betting that a US/Iranian resolution will save us in time from violent shortages down the road. But every day that the SoH remains closed is bringing us closer to a potentially very painful point of shortages and much higher prices.
The US blockade is also a weapon of leverage against its European and Asian allies. When Iran closed the SoH it held the world economy as a hostage against the US. The US blockade of the SoH is of course blocking Iranian oil exports. But it is also an action of disruption directed towards Europe and Asia. The US has called for the rest of the world to engaged in the war with Iran: ”If you want oil from the Persian Gulf, then go and get it”. A risk is that the US plays brinkmanship with the global oil market directed towards its European and Asian allies and maybe even towards China to force them to engage and take part. Maybe unthinkable. But unthinkable has become the norm with Trump in the White House.


Sommarväder skapar prisrally på elbörsen
Oil product price pain is set to rise as the Strait of Hormuz stays closed into summer

Solkraften pressar elpriserna dagtid

Michel Gubel ger sin syn på oljemarknaden