

Analys
SEB – Råvarukommentarer, 20 maj 2013

Rekommendationer
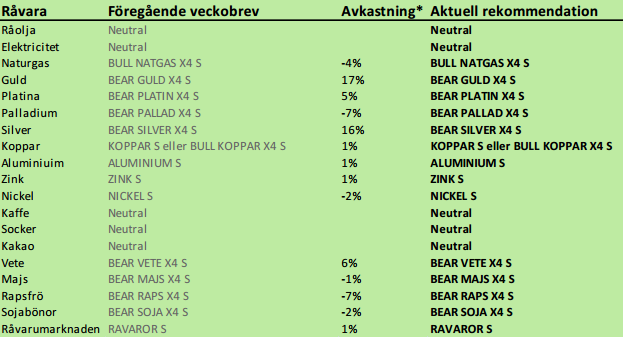
*) Avkastningen avser 1:1 råvarucertifikat där de ingår i rekommendationen. I den aktuella tabellen ovan har jag tagit prisförändringen den senaste veckan sedan det förra veckobrevet publicerades.
Inledning
Råvarumarknaden har fortsatt att vara svag i veckan som gick. WASDE-rapporten börjar sjunka in hos “ags” marknaden. Sådden av majs väntas ha tagit ett rekordstort kliv framåt, vilket kommer att visa sig på måndagskvällen, när USDA publicerar siffrorna. Guldmarknaden följer ett klassist mönster för en kraschande marknad. Jag tror inte att prisfallet är över än.
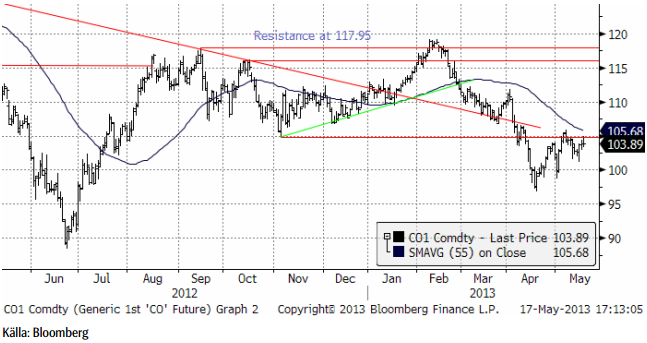
Råolja – Brent
Oljan var upp vid tidigare stödet (nu motståndet) vid 105 dollar. Priset orkade inte igenom och då brukar prisfall följa. Stöd finns vid 100 dollar, men trenden är nedåtriktad i det korta perspektivet. I det långa perspektivet saknas trend för råoljan.
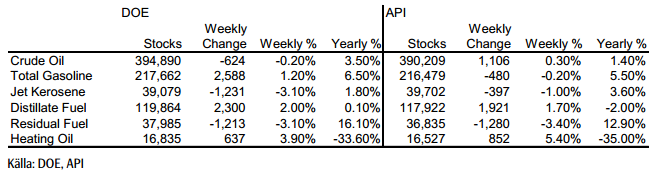
Lagren och lagerförändringarna i USA den senaste rapportveckan (som slutade den 10 maj) ser vi nedan, enligt Department of Energy och American Petroleum Institute.
Nedan ser vi amerikanska råoljelager enligt DOE i tusen fat. Den svarta kurvan är 2012 års lagernivåer vecka för vecka och den lilla röda linjen är 2013 års nivå.
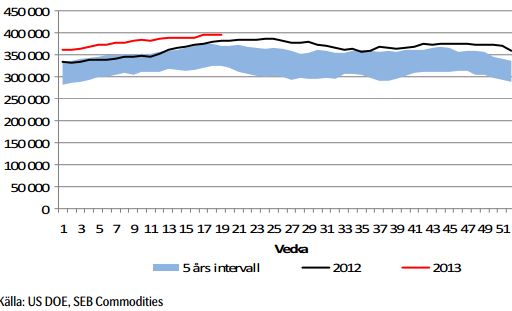
Importen fortsätter att hålla sig under förra årets nivå. Veckans notering var nästan oförändrad från veckan innan.
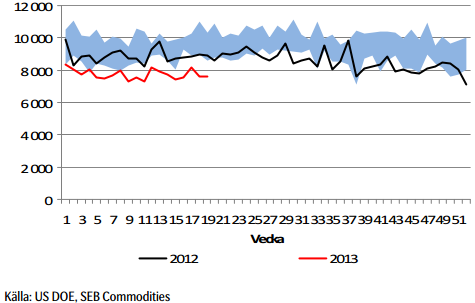
Vi fortsätter att ligga neutralt för att förhoppningsvis kunna komma in billigare i OLJA S om priset går ner till 100 dollar eller lägre igen.
Elektricitet
Terminen gick i veckan upp och ”stängde gapet”, det hopp nedåt i priserna som inträffade för en dryg vecka sedan. När sådant är avklarat brukar prisfallet fortsätta i den ursprungliga riktningen, i det här fallet alltså nedåt.
Hydrologisk balans har fortsatt att stiga.
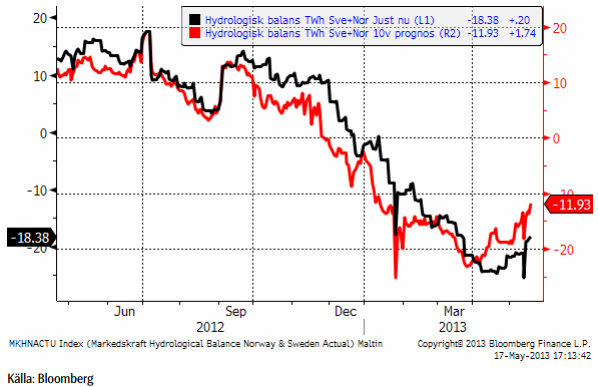
Eftersom priset trots allt kommit ner ganska långt, väljer vi att fortsätta med neutral position.
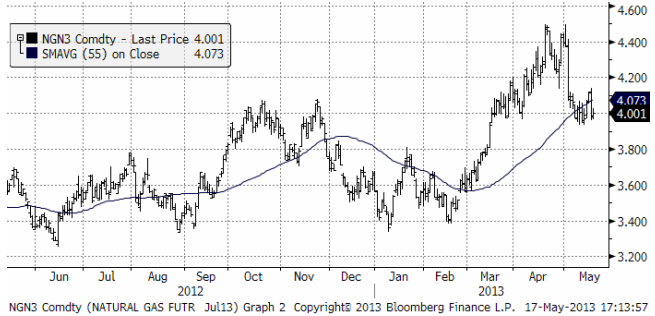
Naturgas
Tekniskt är läget osäkert, mitt emellan den övre delen och den undre delen av den senaste tidens kursintervall. Vi väljer att gå över till neutral position.
Guld & Silver
Guldpriset följer ett välkänt mönster för en kraschande marknad. Först ett kraftigt fall (i april), fyndköpare, och så säljläge igen och ett nytt prisfall som börjar lite försiktigt och sedan blir allt mer panikartat. Vi är nu nästan framme vid den punkt då paniken ska börja gripa de som har för mycket guld i sina portföljer. Sannolikheten är väldigt stor att det initiala prisfallets botten i april på 1322 dollar / ozt ska nås. Om paniken infinner sig i veckan kan prisfallet bli ännu större.
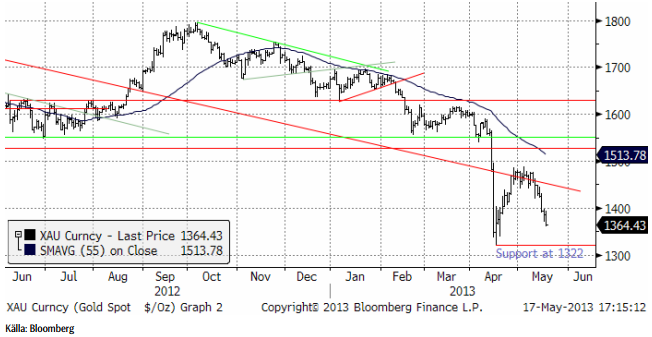
17 analytiker som tillfrågats av Bloomberg tror att priset faller i veckan som kommer. Endast 8 tror att priset stiger.
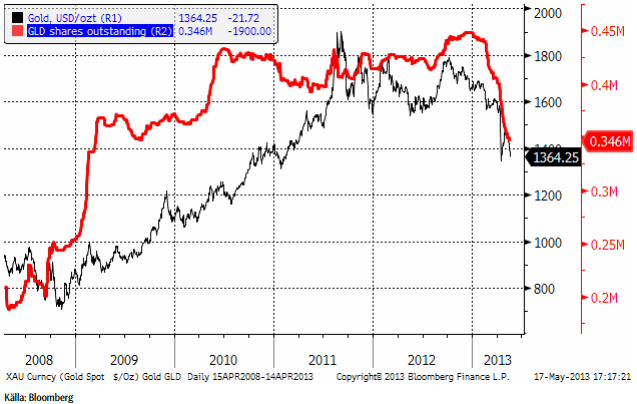
April månads fyndköpare av mynt som gjorde att the US Mint, med flera nådde försäljningsrekord, har tömt ut sina resurser. Maj ser ut att endast nå 65% av april månads försäljning enligt the US Mint. Samtidigt fortsätter ETP-innehavare dumpa sina innehav. Nedan ser vi guldpriset och antal utestående GLD-depåbevis (röd kurva).
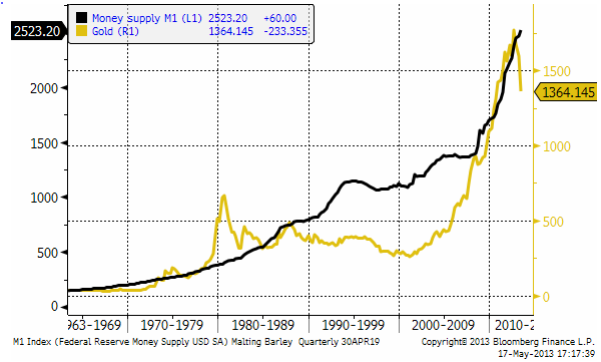
Vad som kan ha utlöst försäljningarna var ”hacket” i kurvan på penningmängden i USA. Samtidigt började FED tala om ett slut på QE. Men som vi ser i grafen nedan, har M1 fortsatt att öka i USA. Man fick kalla fötter hos FED och fortsatte trycka pengar. Det gör att det byggs upp ett latent stöd för guldpriset, bara kursfallet tar slut.
Nedan ser vi kursdiagrammet för silver i dollar per troy ounce. Stödet på 22 dollar håller än så länge. Bryts den nivån finns inget förrän vid 20 dollar, 10% längre ner.
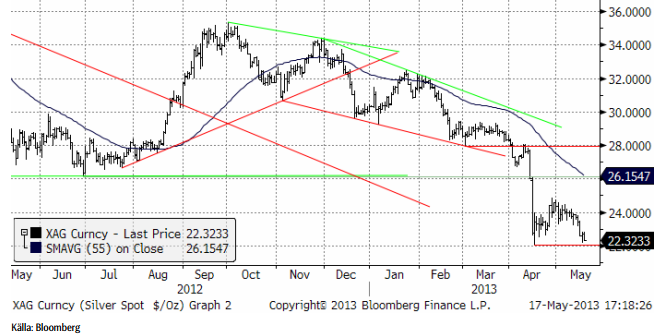
Jag tror att silverpriset kan gå lite lägre från dagens nivå, ner mot 22 eller 20 dollar.
Vi ligger korta guld och silver. Jag tror att det kommer en till vända ner och ligger självklart kvar med köpt position i BEAR GULD X4 S och BEAR SILVER X4 S.
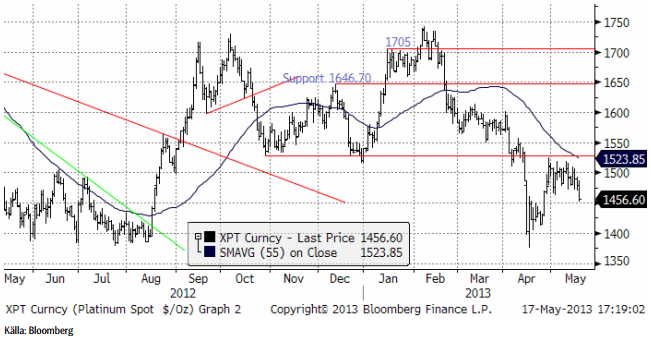
Platina & Palladium
Platinapriset föll i fredags ner till den övre delen av konsolideringen efter prisfallet i april, till 1450. Det är en nivå där det kan finnas tillräckligt stöd för att hejda prisfallet, men dynamiken är ändå på nedsidan.
Palladium fortsätter att sega sig upp från förra veckans 710 dollar till 735 dollar. 750 dollar är en nivå där många nog tycker att det är allt för frestande för att inte sälja.
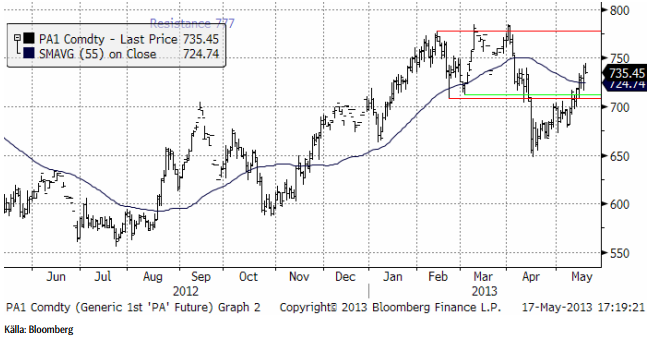
Vi ligger kvar såld både platina och palladium, dvs med BEAR PLATNA X4 S och BEAR PALLAD X4 S.
Basmetaller
Den internationella konjunkturen står och tvekar, och så även de industriella råvarorna. Råvarumarknaderna har under våren präglats av frågetecken kring Kina, där ekonomin inte riktigt tar den fart som väntats under de säsongsmässigt starka 2:a kvartalet. Den andra stora råvarukonsumenten, USA visar positiva tecken, men även där har tveksamhet kring konjunkturen smugit sig på marknaden. Veckans statistikskörd spädde på osäkerheten: 1. antalet personer med arbetslöshetsunderstöd steg rejält, 2. husmarknaden var svagare än väntat, 3. inflationstrycket (KPI) är svagt och 4. industriaktiviteten tvekar (Philly Fed). Samtidigt har marknaden svårt för fotnedsättning: ska Fed påbörja exitpolitiken under hösten och fasa ut värdepappersköpen på $ 85 mdr/mån? Flera Fedtal tolkas som att exitplaner övervägs – vilket ger dollarstöd, en faktor som verkar hämmande på de dollarnoterade råvarorna. Våra makroekonomer räknar dock med att Fed fortsätter året ut.
Basmetallerna låg i startgroparna för en uppgång inför veckan. Men riskaptiten infann sig inte. Kortsiktiga aktörer som positionerat sig för uppgång fick kalla fötter och sålde istället. Veckan slutar med en nedgång på 1-2 % för de stora metallerna. Nickel sticker ut med ett prisfall på 4 %.
Koppar
Som vi skrivit tidigare har vi haft kopparn under bevakning för att gå från neutral till köp. Tekniskt sett bedömde vi förutsättningarna som goda för en kortsiktig uppgång. Trots veckans tillbakagång (1,4 %), ser vi tecken på att det negativa stämningsläget kring koppar håller på att svänga om.
I förra veckan redovisade vi Kinas kopparimport som kom in fortsatt svagt i april. I nedanstående diagram ser vi förändringen på årsbasis. Den negativa förändringen avtar och enligt det cykliska mönstret förväntar vi oss en positiv utveckling under de närmsta månaderna.
Procentuell förändring av kopparimporten (årsbasis)
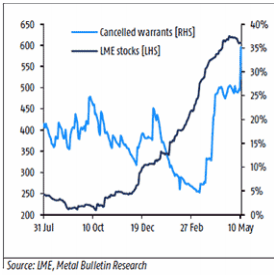
Ett annat tecken är förändringen av LME-lagret. Vi ser både lagerminskningar och en ökning av ”cancelled warrants”. Det senare är statistik på mängden material som är på väg att plockas ur lager. Uttagen sker i Sydkorea och tyder på ökad efterfrågan – sannolikt med destination Kina. Detta stämmer överens med den förväntade ökningen av importen till Kina. Kineserna brukar utnyttja prisskillnaden mellan LME och Shanghai, som nu efter prisnedgången är till LME:s fördel.
Tekniskt sett fokuserar vi på ”dubbelbotten” från april och maj, som ger en potentiell uppgång till $7620, där motståndet sätter in. Nästa nivå är $7800. Den omedelbara pressen på koppar verkar vara över och den nedåtgående trenden är bruten. Den generella trenden får betraktas som mer sidledes för koppar.
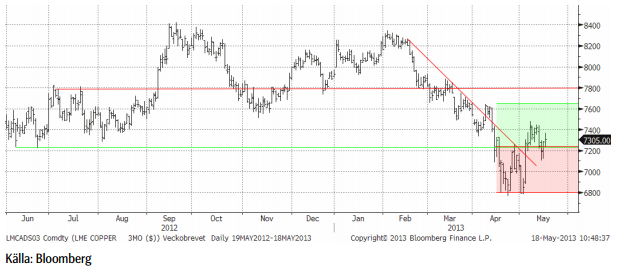
Vi förväntar oss fortsatt hög volatilitet. Vår kortsiktiga bedömning talar för uppsidan och vi rekommenderar därför köp av BULL KOPPAR X2 S eller X4 S.
Aluminium
Priset har nu ”testat” stödnivåerna vid $1810-20 vid tre tillfällen, och lyckats studsa upp. Det är ett styrketecken. Vi ser fysiska aktörer som går in och täcker in framtida konsumtion via terminsköp vid varje dipp. Tekniskt orienterade fonder säljer vid varje uppställ. Trenden blir därefter, det rör sig sidledes. Vi ser tecken på att marknaden håller på att bottna ur. Högkostnadsproducenterna, framför allt i Kina, förväntas minska utbudet (ännu mer) om priset långvarigt stannar på nuvarande nivåer.
Långsiktigt är nivån väldigt intressant för kontraktet Aluminium S (utan hävstång).
Zink
Situationen för zink påminner om den för aluminium, både fundamentalt och tekniskt. Vi bedömer zinken som ”billig” ur ett kostnadsperspektiv och nuvarande nivåer är mycket intressanta på lite längre sikt (6-12 månader). I det perspektivet är Zink S (utan hävstång) att föredra.
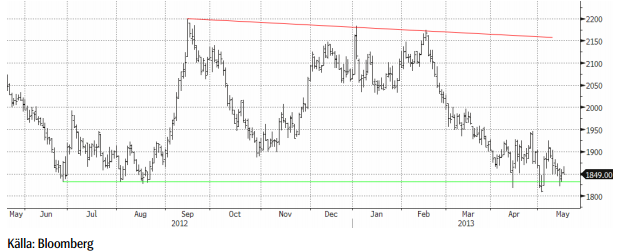
Nickel
Nickel uppvisade förnyad svaghet i veckan och faller med 4 %. Trots väldigt goda efterfrågeutsikter på sikt, där den rostfria- och specialstålproduktionen förväntas öka med fortsatt utbyggnad av olje- och gasproduktion och specialstål till flygindustrin, ”lider” nickelmarknaden av ett överskott. Produktionstekniken av s.k. Nickel Pig Iron i Kina har utvecklats med s.k. Rotary Kiln Electric Furnaces (RKEF) teknik, vilken i genomsnitt sänker hela kostnadskurvan. Samtidigt får högkostnadsproducenterna i gruvledet problem på nuvarande nivåer. Vi har tidigare rapporterat om produktionsneddragningar i Australien, och det förväntas komma mer.
Effekten av RKEF-tekniken riskerar att flytta ner nivån där utbudsminskningarna verkligen får effekt. Priset har brutit viktiga stödnivåer, och vi får gå tillbaka till juli 2009 för att hitta lägre priser. I det perspektivet kommer nästa stora stödnivå in kring $14000. Vi är inte så långt därifrån och vi bedömer nivåerna från dagens pris kring $14800 ned mot nivån som väldigt attraktiva på 6-12 månaders sikt. I det perspektivet är Nickel S (utan hävstång) att föredra.
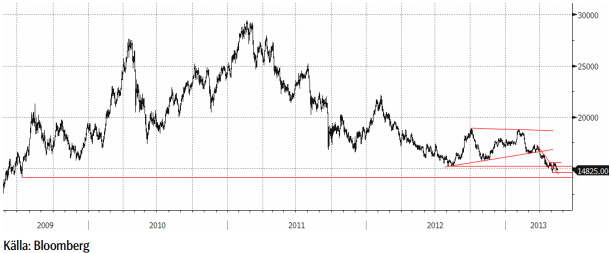
Nickel 2009-2013
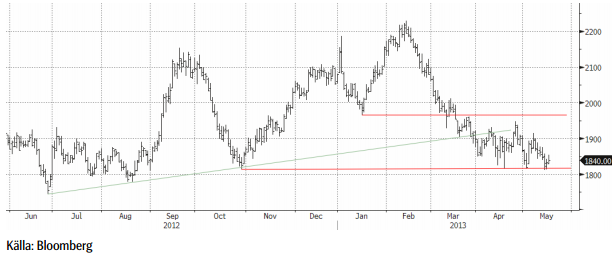
Nickel på kort sikt
För veckan, och ur ett tekniskt perspektiv, gäller det att nivån från i början av månaden $14600 håller, för att undvika en test av lägre nivåer. Det finansiella kollektivet är väldigt ”korta” och frågan är hur mycket mer kraft det finns för att pressa priset ytterligare. Det byggs upp ett stort behov av att köpa tillbaka kortpositioner, vilket i sig kan skapa kraftiga rekyler på uppsidan.
Kaffe
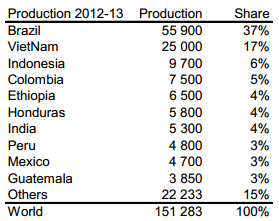
Årets skörd i år i Brasilien är en mellanårsskörd för arabica. Conab i Brasilien publicerade en rapport den 14 maj på 48.59 miljoner säckar (à 60 kg). Enligt Conabs statistikserie blir det den största skörden någonsin för Brasilien. Om man jämför med det amerikanska jordbruksdepartementets tidsserie är skörden något lägre än 2011/12.
Nedan ser vi Brasiliens produktion i 1000 säckar. Den sista noteringen, för 2013/14, är hämtad från Conabs prognos. Resten är USDA:s data.
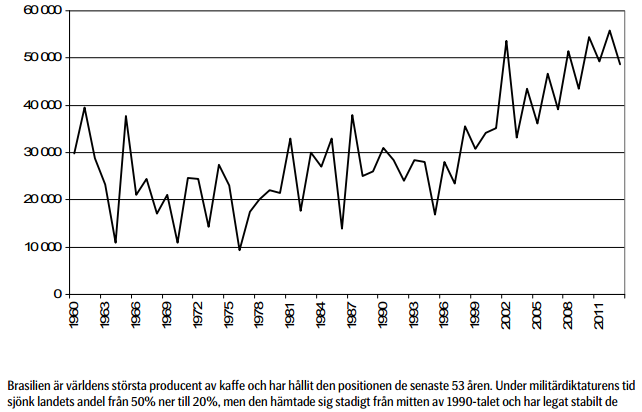
Brasilien är världens största producent av kaffe och har hållit den positionen de senaste 53 åren. Under militärdiktaturens tidsjönk landets andel från 50% ner till 20%, men den hämtade sig stadigt från mitten av 1990-talet och har legat stabilt de senaste 13 åren. Vietnam producerar uteslutande den sämre kaffesorten robusta. Den odlas också i delstaten Espirito-Santo i nordöstra Brasilien. Just den delen av Brasilien har varit ovanligt torrt, vilket kan ge lite mindre skörd av robusta.
The International Coffee Organisation har nyligen publicerat en rapport om kaffeblads rosten (roya). De väntar sig att den ska ha långvarig negativ effekt på produktionen. Däri ligger kanske fröet för nästa uppgång, men just nu är trenden nedåt. Marknadens försök att handla upp priset misslyckades.
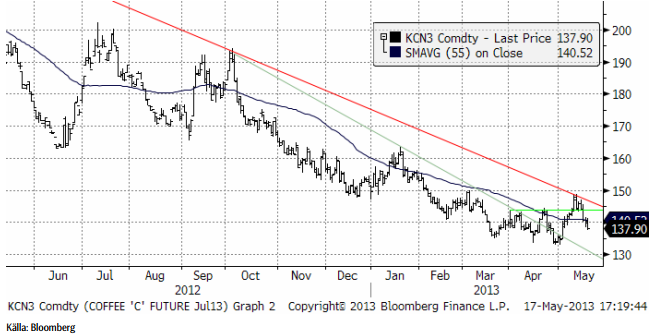
Sedan mars månad har däremot inte priset fallit som tidigare. Vi har först sett lägre bottnar, men uppgångarna har varit lika högre som föregående eller högre. Kanske håller något på att hända i kaffemarknaden.
Vi tror man kan försöka sig på att köpa kaffe för lite längre sikt, t ex KAFFE S. En stopp-loss på 132 (basis juli-kontraktet) bör man dock ha.
Socker
Marknadsföringsårets 2013/14 skörd av sockerrör har börjat i Centro-Sud i Brasilien. Hittills i maj har vädret varit gynnsamt för skördearbetet. Cepea rapporterar att köpare är avvaktande, eftersom det finns en förväntan om lägre priser när ”crushen” kommit längre.
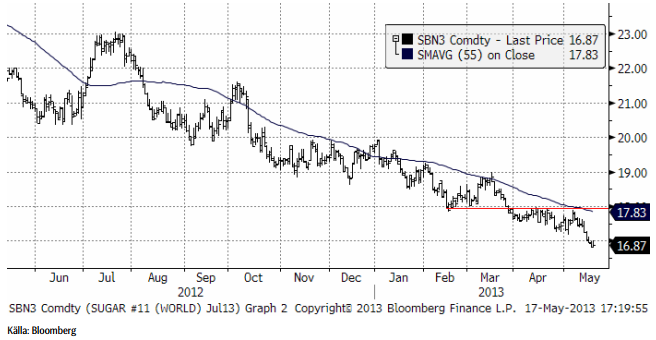
Vi fortsätter med neutral rekommendation.
[box]SEB Veckobrev Veckans råvarukommentar är producerat av SEB Merchant Banking och publiceras i samarbete och med tillstånd på Råvarumarknaden.se[/box]
Disclaimer
The information in this document has been compiled by SEB Merchant Banking, a division within Skandinaviska Enskilda Banken AB (publ) (“SEB”).
Opinions contained in this report represent the bank’s present opinion only and are subject to change without notice. All information contained in this report has been compiled in good faith from sources believed to be reliable. However, no representation or warranty, expressed or implied, is made with respect to the completeness or accuracy of its contents and the information is not to be relied upon as authoritative. Anyone considering taking actions based upon the content of this document is urged to base his or her investment decisions upon such investigations as he or she deems necessary. This document is being provided as information only, and no specific actions are being solicited as a result of it; to the extent permitted by law, no liability whatsoever is accepted for any direct or consequential loss arising from use of this document or its contents.
About SEB
SEB is a public company incorporated in Stockholm, Sweden, with limited liability. It is a participant at major Nordic and other European Regulated Markets and Multilateral Trading Facilities (as well as some non-European equivalent markets) for trading in financial instruments, such as markets operated by NASDAQ OMX, NYSE Euronext, London Stock Exchange, Deutsche Börse, Swiss Exchanges, Turquoise and Chi-X. SEB is authorized and regulated by Finansinspektionen in Sweden; it is authorized and subject to limited regulation by the Financial Services Authority for the conduct of designated investment business in the UK, and is subject to the provisions of relevant regulators in all other jurisdictions where SEB conducts operations. SEB Merchant Banking. All rights reserved.

Down 4.4% last week with more from OPEC+, a possible truce in Ukraine and weak US data. Brent crude fell 4.4% last week with a close of the week of USD 66.59/b and a range of USD 65.53-69.98/b. Three bearish drivers were at work. One was the decision by OPEC+ V8 to lift its quotas by 547 kb/d in September and thus a full unwind of the 2.2 mb/d of voluntary cuts. The second was the announcement that Trump and Putin will meet on Friday 15 August to discuss the potential for cease fire in Ukraine (without Ukraine). I.e. no immediate new sanctions towards Russia and no secondary sanctions on buyers of Russian oil to any degree that matters for the oil price. The third was the latest disappointing US macro data which indicates that Trump’s tariffs are starting to bite. Brent is down another 1% this morning trading close to USD 66/b. Hopes for a truce on the horizon in Ukraine as Putin meets with Trump in Alaska in Friday 15, is inching oil lower this morning.

Trump – Putin meets in Alaska. The potential start of a process. No disruption of Russian oil in sight. Trump has invited Putin to Alaska on 15 August to discuss Ukraine. The first such invitation since 2007. Ukraine not being present is bad news for Ukraine. Trump has already suggested ”swapping of territory”. This is not a deal which will be closed on Friday. But rather a start of a process. But Trump is very, very unlikely to slap sanctions on Russian oil while this process is ongoing. I.e. no disruption of Russian oil in sight.
What OPEC+ is doing, what it is saying and what we are hearing. OPEC+ V8 is done unwinding its 2.2 mb/d in September. It doesn’t mean production will increase equally much. Since it started the unwind and up to July (to when we have production data), the increase in quotas has gone up by 1.4 mb/d, while actual production has gone up by less than 0.7 mb/d. Some in the V8 group are unable to increase while others, like Russia and Iraq are paying down previous excess production debt. Russia and Iraq shouldn’t increase production before Jan and Mar next year respectively.
We know that OPEC+ has spare capacity which it will deploy back into the market at some point in time. And with the accelerated time-line for the redeployment of the 2.2 mb/d voluntary cuts it looks like it is happening fast. Faster than we had expected and faster than OPEC+ V8 previously announced.
As bystanders and watchers of the oil market we naturally combine our knowledge of their surplus spare capacity with their accelerated quota unwind and the combination of that is naturally bearish. Amid this we are not really able to hear or believe OPEC+ when they say that they are ready to cut again if needed. Instead we are kind of drowning our selves out in a combo of ”surplus spare capacity” and ”rapid unwind” to conclude that we are now on a highway to a bear market where OPEC+ closes its eyes to price and blindly takes back market share whatever it costs. But that is not what the group is saying. Maybe we should listen a little.
That doesn’t mean we are bullish for oil in 2026. But we may not be on a ”highway to bear market” either where OPEC+ is blind to the price.
Saudi OSPs to Asia in September at third highest since Feb 2024. Saudi Arabia lifted its official selling prices to Asia for September to the third highest since February 2024. That is not a sign that Saudi Arabia is pushing oil out the door at any cost.
Saudi Arabia OSPs to Asia in September at third highest since Feb 2024

Lower as OPEC+ keeps fast-tracking redeployment of previous cuts. Brent closed down 1.3% yesterday to USD 68.76/b on the back of the news over the weekend that OPEC+ (V8) lifted its quota by 547 kb/d for September. Intraday it traded to a low of USD 68.0/b but then pushed higher as Trump threatened to slap sanctions on India if it continues to buy loads of Russian oil. An effort by Donald Trump to force Putin to a truce in Ukraine. This morning it is trading down 0.6% at USD 68.3/b which is just USD 1.3/b below its July average.
Only US shale can hand back the market share which OPEC+ is after. The overall picture in the oil market today and the coming 18 months is that OPEC+ is in the process of taking back market share which it lost over the past years in exchange for higher prices. There is only one source of oil supply which has sufficient reactivity and that is US shale. Average liquids production in the US is set to average 23.1 mb/d in 2025 which is up a whooping 3.4 mb/d since 2021 while it is only up 280 kb/d versus 2024.
Taking back market share is usually a messy business involving a deep trough in prices and significant economic pain for the involved parties. The original plan of OPEC+ (V8) was to tip-toe the 2.2 mb/d cuts gradually back into the market over the course to December 2026. Hoping that robust demand growth and slower non-OPEC+ supply growth would make room for the re-deployment without pushing oil prices down too much.
From tip-toing to fast-tracking. Though still not full aggression. US trade war, weaker global growth outlook and Trump insisting on a lower oil price, and persistent robust non-OPEC+ supply growth changed their minds. Now it is much more fast-track with the re-deployment of the 2.2 mb/d done already by September this year. Though with some adjustments. Lifting quotas is not immediately the same as lifting production as Russia and Iraq first have to pay down their production debt. The OPEC+ organization is also holding the door open for production cuts if need be. And the group is not blasting the market with oil. So far it has all been very orderly with limited impact on prices. Despite the fast-tracking.
The overall process is nonetheless still to take back market share. And that won’t be without pain. The good news for OPEC+ is of course that US shale now is cooling down when WTI is south of USD 65/b rather than heating up when WTI is north of USD 45/b as was the case before.
OPEC+ will have to break some eggs in the US shale oil patches to take back lost market share. The process is already in play. Global oil inventories have been building and they will build more and the oil price will be pushed lower.
A Brent average of USD 60/b in 2026 implies a low of the year of USD 45-47.5/b. Assume that an average Brent crude oil price of USD 60/b and an average WTI price of USD 57.5/b in 2026 is sufficient to drive US oil rig count down by another 100 rigs and US crude production down by 1.5 mb/d from Dec-25 to Dec-26. A Brent crude average of USD 60/b sounds like a nice price. Do remember though that over the course of a year Brent crude fluctuates +/- USD 10-15/b around the average. So if USD 60/b is the average price, then the low of the year is in the mid to the high USD 40ies/b.
US shale oil producers are likely bracing themselves for what’s in store. US shale oil producers are aware of what is in store. They can see that inventories are rising and they have been cutting rigs and drilling activity since mid-April. But significantly more is needed over the coming 18 months or so. The faster they cut the better off they will be. Cutting 5 drilling rigs per week to the end of the year, an additional total of 100 rigs, will likely drive US crude oil production down by 1.5 mb/d from Dec-25 to Dec-26 and come a long way of handing back the market share OPEC+ is after.
The OPEC+ subgroup V8 this weekend decided to fully unwind their voluntary cut of 2.2 mb/d. The September quota hike was set at 547 kb/d thereby unwinding the full 2.2 mb/d. This still leaves another layer of voluntary cuts of 1.6 mb/d which is likely to be unwind at some point.
Higher quotas however do not immediately translate to equally higher production. This because Russia and Iraq have ”production debts” of cumulative over-production which they need to pay back by holding production below the agreed quotas. I.e. they cannot (should not) lift production before Jan (Russia) and March (Iraq) next year.
Argus estimates that global oil stocks have increased by 180 mb so far this year but with large skews. Strong build in Asia while Europe and the US still have low inventories. US Gulf stocks are at the lowest level in 35 years. This strong skew is likely due to political sanctions towards Russian and Iranian oil exports and the shadow fleet used to export their oil. These sanctions naturally drive their oil exports to Asia and non-OECD countries. That is where the surplus over the past half year has been going and where inventories have been building. An area which has a much more opaque oil market. Relatively low visibility with respect to oil inventories and thus weaker price signals from inventory dynamics there.
This has helped shield Brent and WTI crude oil price benchmarks to some degree from the running, global surplus over the past half year. Brent crude averaged USD 73/b in December 2024 and at current USD 69.7/b it is not all that much lower today despite an estimated global stock build of 180 mb since the end of last year and a highly anticipated equally large stock build for the rest of the year.
What helps to blur the message from OPEC+ in its current process of unwinding cuts and taking back market share, is that, while lifting quotas, it is at the same time also quite explicit that this is not a one way street. That it may turn around make new cuts if need be.
This is very different from its previous efforts to take back market share from US shale oil producers. In its previous efforts it typically tried to shock US shale oil producers out of the market. But they came back very, very quickly.
When OPEC+ now is taking back market share from US shale oil it is more like it is exerting a continuous, gradually increasing pressure towards US shale oil rather than trying to shock it out of the market which it tried before. OPEC+ is now forcing US shale oil producers to gradually back off. US oil drilling rig count is down from 480 in Q1-25 to now 410 last week and it is typically falling by some 4-5 rigs per week currently. This has happened at an average WTI price of about USD 65/b. This is very different from earlier when US shale oil activity exploded when WTI went north of USD 45/b. This helps to give OPEC+ a lot of confidence.
Global oil inventories are set to rise further in H2-25 and crude oil prices will likely be forced lower though the global skew in terms of where inventories are building is muddying the picture. US shale oil activity will likely decline further in H2-25 as well with rig count down maybe another 100 rigs. Thus making room for more oil from OPEC+.


Bönder i USA får hela tiden ut mer majs per hektar

NKT tillverkar elkablar som kan överföra 1 GW, har orderstock på 10 miljarder euro

CATL pausar stor litiumgruva, kan ge prishöjningar på marknaden

Omgående mångmiljardfiasko för Equinors satsning på Ørsted och vindkraft
What OPEC+ is doing, what it is saying and what we are hearing

USA inför 93,5 % tull på kinesisk grafit

Fusionsföretag visar hur guld kan produceras av kvicksilver i stor skala – alkemidrömmen ska bli verklighet

Westinghouse planerar tio nya stora kärnreaktorer i USA – byggstart senast 2030

Kopparpriset i fritt fall i USA efter att tullregler presenterats

Ryska militären har skjutit ihjäl minst 11 guldletare vid sin gruva i Centralafrikanska republiken
-
 Nyheter4 veckor sedan
USA inför 93,5 % tull på kinesisk grafit
-
 Nyheter3 veckor sedan
Fusionsföretag visar hur guld kan produceras av kvicksilver i stor skala – alkemidrömmen ska bli verklighet
-
 Nyheter4 veckor sedan
Westinghouse planerar tio nya stora kärnreaktorer i USA – byggstart senast 2030
-
 Nyheter2 veckor sedan
Kopparpriset i fritt fall i USA efter att tullregler presenterats
-
 Nyheter3 veckor sedan
Ryska militären har skjutit ihjäl minst 11 guldletare vid sin gruva i Centralafrikanska republiken
-
 Nyheter2 veckor sedan
Lundin Gold rapporterar enastående borrresultat vid Fruta del Norte
-
 Nyheter2 veckor sedan
Stargate Norway, AI-datacenter på upp till 520 MW etableras i Narvik
-

 Nyheter4 veckor sedan
Kina skärper kontrollen av sällsynta jordartsmetaller, vill stoppa olaglig export