

Analys
SEB – Råvarukommentarer, 13 maj 2013

Rekommendationer
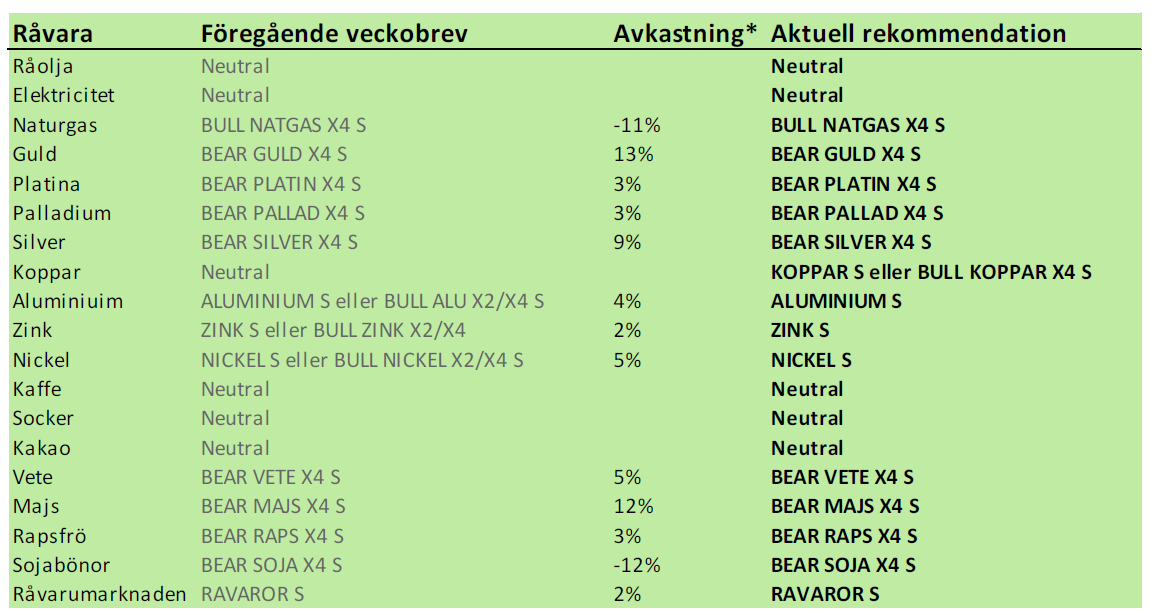
*) Avkastningen avser 1:1 råvarucertifikat där de ingår i rekommendationen. I den aktuella tabellen ovan har jag tagit prisförändringen den senaste veckan sedan det förra veckobrevet publicerades.
Inledning
I fredags publicerade det amerikanska jordbruksdepartementet USDA estimat för produktion och utgående lager för 2013/14 för första gången. Produktionen och utgående lager väntas öka mycket för vete, majs och sojabönor. Rapportens siffror motiverar ca 20% lägre pris på var och en av dessa råvaror. Vi har ganska länge haft säljrekommendation, men upprepar rekommendationen att köpa BEAR på vete, majs, sojabönor och raps.
Marknaden för ädelmetaller ser också ut att stå med hälen på trampolinen. Ett prisfall ser alltså oundvikligt ut.
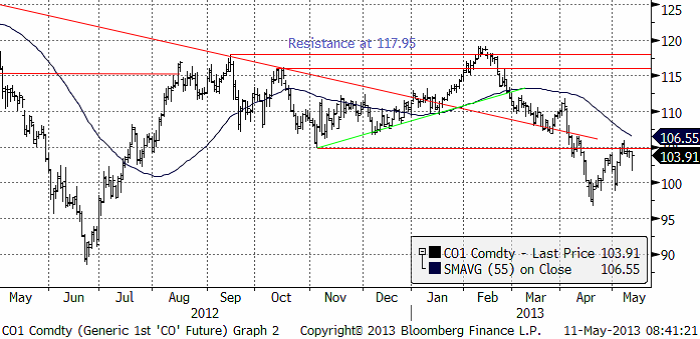
Råolja – Brent
Oljan var upp vid tidigare stödet (nu motståndet) vid 105 dollar. Priset orkade inte igenom och då brukar prisfall följa. Stöd finns vid 100 dollar, men trenden är nedåtriktad i det korta perspektivet. I det långa perspektivet saknas trend för råoljan.
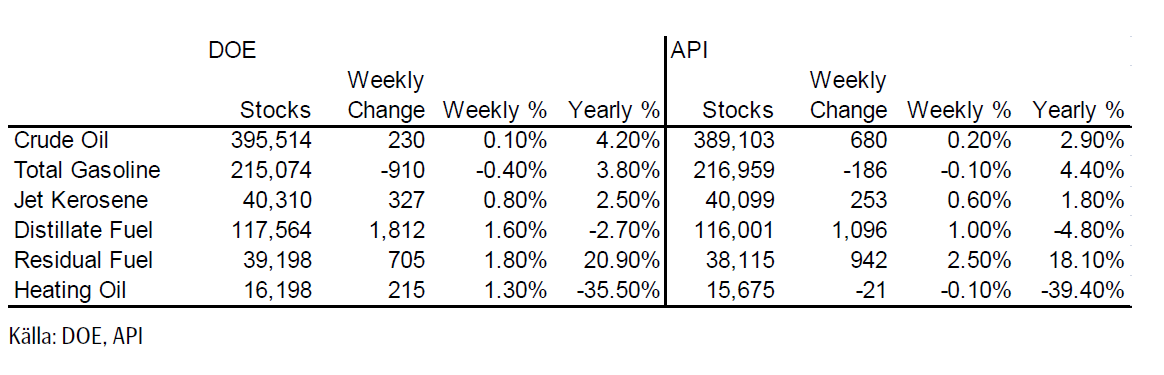
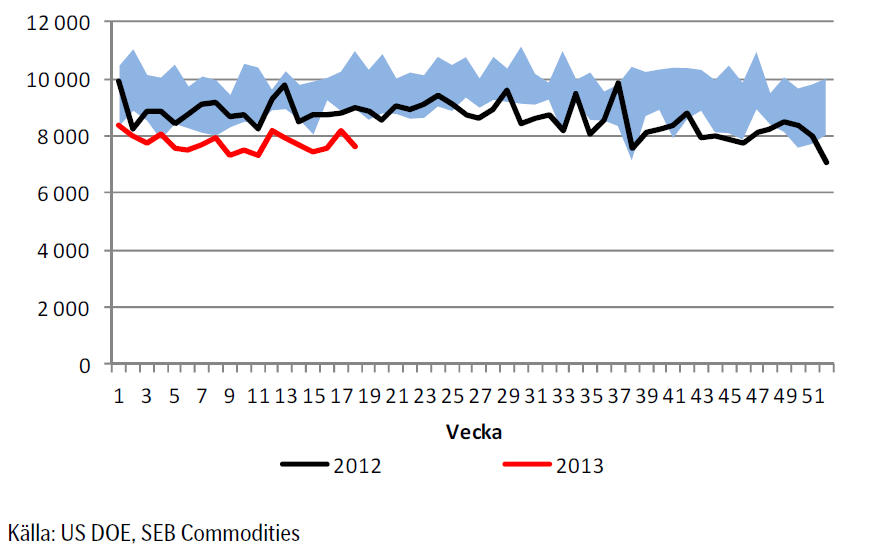
Lagren och lagerförändringarna i USA den senaste rapportveckan ser vi nedan, enligt Department of Energy och American Petroleum Institute.
Nedan ser vi amerikanska råoljelager enligt DOE i tusen fat. Den svarta kurvan är 2012 års lagernivåer vecka för vecka och den lilla röda linjen är 2013 års nivå.
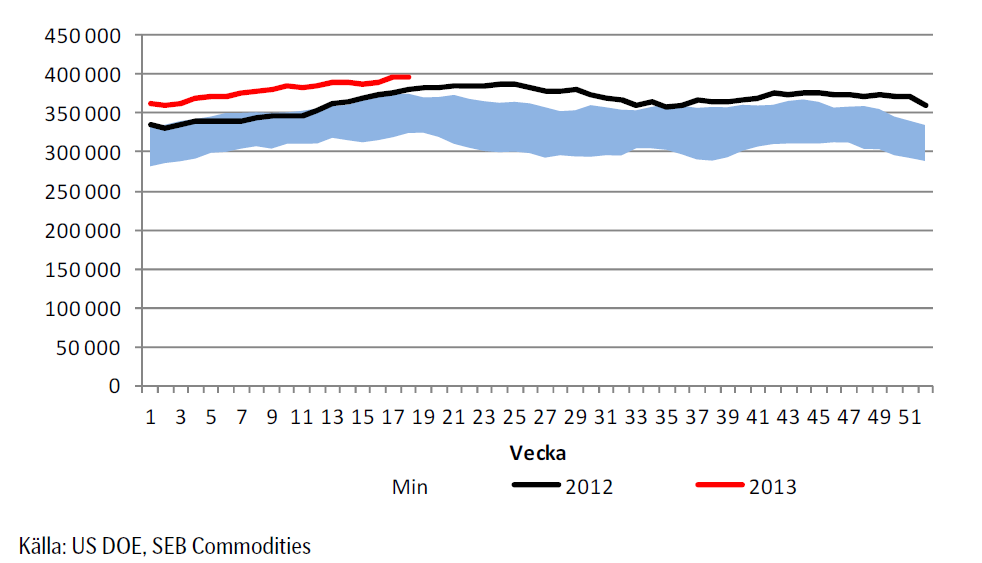
Importen fortsätter att hålla sig under förra årets nivå. Veckans notering var ett nedåthopp.
Vi fortsätter att ligga neutralt för att förhoppningsvis kunna komma in billigare i OLJA S om priset går ner till 100 dollar eller lägre igen.
Elektricitet
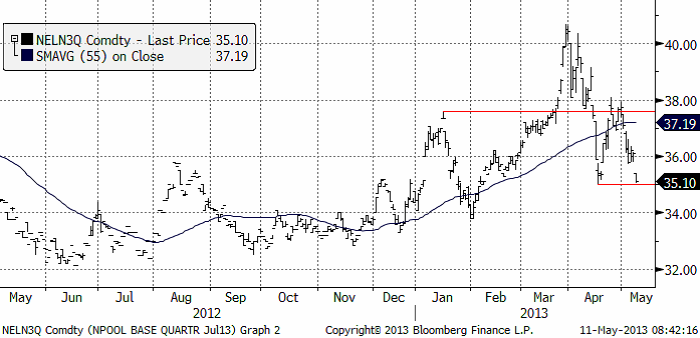
Priset ”gappade” ner i fredags, men höll sig över den tekniska stödnivån på 35 euro per MWh. Bryts den finns stöd redan på 34 euro, vilket gör att de köpsugna i marknaden kan känna sig motiverade att riskera 1 euro och köpa på 35 euro. ”Gap” brukar också ”stängas”, vilket i det här fallet skulle innebära en uppgång mot 36 euro. Det är ett svårt läge och vi fortsätter med neutral rekommendation.
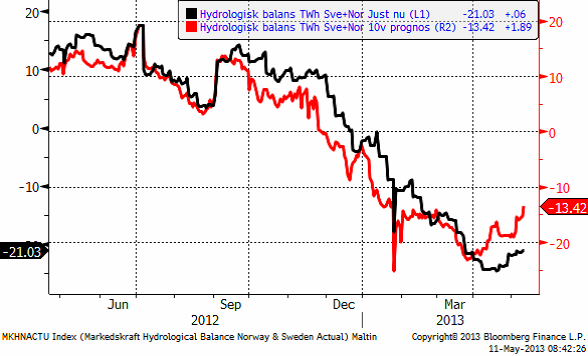
Hydrologisk balans har fortsatt att stiga.
Naturgas
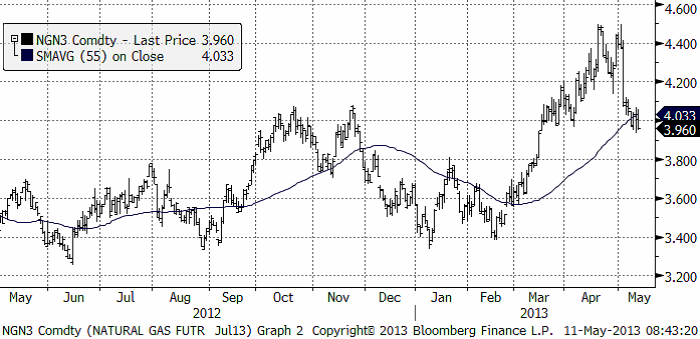
Rekylen nedåt i naturgaspriset fortsatte i makligare takt förra veckan. Jag tror att den långsiktiga trenden är uppåtriktad, och tror att det kan vara en bra idé att köpa på den här nivån. Stöd finns på 3.80 och på 3.60. Om man lyckas köpa på de nivåerna har man så klart en bättre position än om man köper på 3.96. Jag tror i vart fall inte att man ska ta ens kortsiktiga positioner för nedgång, utan försöka komma in på den långa sidan.
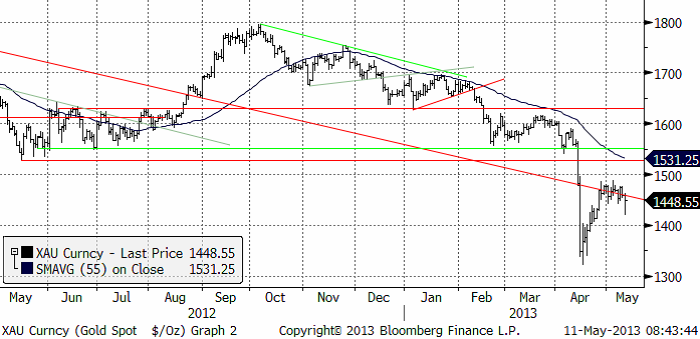
Guld och Silver
Guldpriset har rekylerat färdigt, tror vi. Vi tror att man ska sälja guld nu, därför att vi tror att det kommer ett kursfall till. Det brukar alltid komma två kursfall med en rekyl emellan, när man haft en så kraftig teknisk säljsignal som vi fick i guld i början på april. När det kursfallet är klart tror jag man kan börja köpa guld igen.
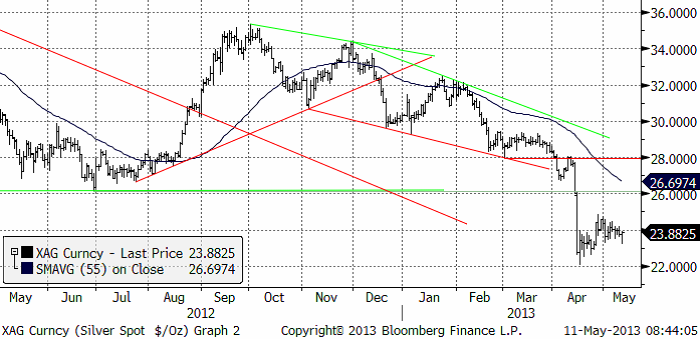
Nedan ser vi kursdiagrammet för silver i dollar per troy ounce.
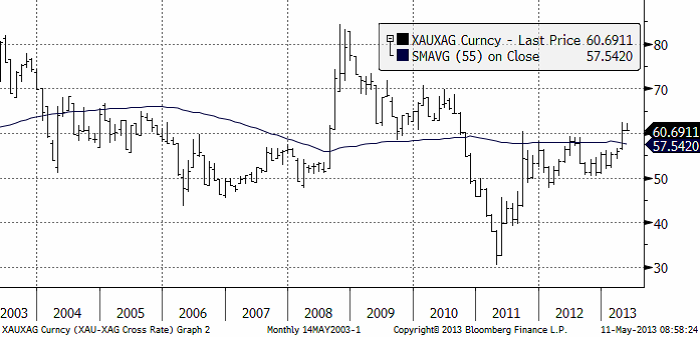
I diagrammet nedan ser vi priset på guld dividerat med priset på silver. Under 2011 rusade priset på silver på ganska osannolika spekulationer om att en stor bank hade sålt mer ”pappers-silver” än vad som fanns fysiskt att tillgå i världen (till och med). De som trodde på detta har med rätta straffats ganska hårt. I förhållande till guldpriset, har silverpriset halverats. Som vi ser har silverpriset kommit ner till rimliga nivåer i förhållande till guld. De senaste tio årens genomsnitt ligger på ett pris på silver som är 1/60-del av guldprisets.
Jag tror att silverpriset kan gå lite lägre från dagens nivå, ner mot 22 eller 20 dollar. Vi ligger korta guld och silver. Jag tror att det kommer en till vända ner och ligger självklart kvar med köpt position i BEAR GULD X4 S och BEAR SILVER X4 S.
Platina & Palladium
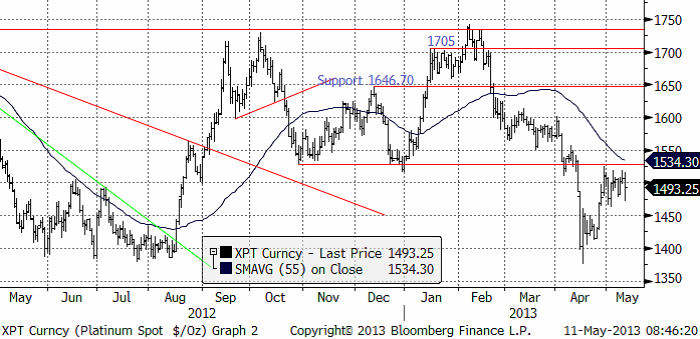
Platinapriset befinner sig fortfarande i en rekylfas uppåt (mot trenden). Priset på platina har tagit sig upp till ett starkt motstånd, markerat av två tidigare bottnar på 1530 dollar. Det är upplagt för nedgång i den fallande trendens riktning. Det ser riktigt bra ut för en kort position och jag rekommenderar köp av BEAR PLATIN X4 S. Jag tror att priset går ner mot 1450, men kanske även till 1400 eller ännu längre ner. Nivån 1400 har tidigare varit en tydlig bottennivå.
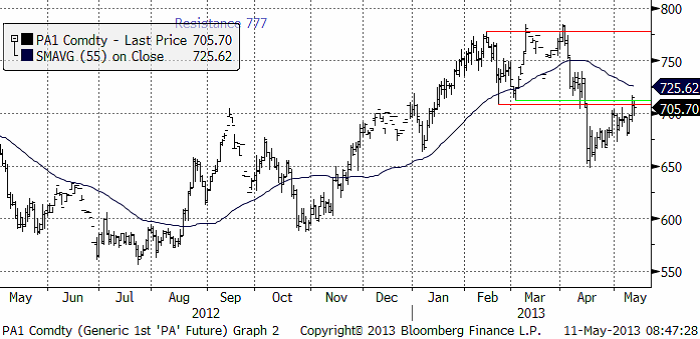
Palladium har mycket motigt segat sig upp mot 710 dollar per troy uns. Där finns som vi ser två motståndsnivåer från föregående bottnar. Marknaden reagerar då och då också på 55-dagars glidande medelvärde, som ett motstånd, om det inte bryts. Som vi ser ligger 55-dagars glidande medelvärde bara strax över dagens kursnivå. Ur teknisk synvinkel pekar det mesta: den tröga uppgången från 650 dollar, de två motståndsnivåerna vid 710 dollar och 55-dagars glidande medelvärde för fallande pris härnäst. Jag skulle nog välja att gå in i BEAR PALLAD X4 S i det här läget. Målkursen för den affären är i första hand ner mot 650 dollar och i andra hand ner mot 600 dollar.
Basmetaller
Veckan inleddes med helgstängt i London, vilket innebär begränsad likviditet på många marknader, men synnerhet basmetaller eftersom LME då håller helt stängt. Förra fredagens starka amerikanska statistik gav som vi skrev förra veckan väldigt positiva stängningar. Tisdagens handel fick emellertid inte den förväntade följdrörelsen uppåt. Metallerna låg i startgroparna för ett kortsiktigt rally. Onsdagsmorgonens nyheter om positiva exportsiffror från Kina räckte för att sätta fart. Tekniskt sett nådde priserna i stort sett sina kortsiktiga mål under torsdagen och vi fick se rekyler ner igen på fredagen. Nu står det och väger igen, och är mer oklart inför nästa vecka. Fredagkvällens utveckling (igår) då både olja och metaller steg kraftigt igen, inger visst förtroende. För basmetaller slutar veckan blandat med uppgångar för nickel och koppar på ca 1 %, medan zink och aluminium faller lika mycket.
Koppar
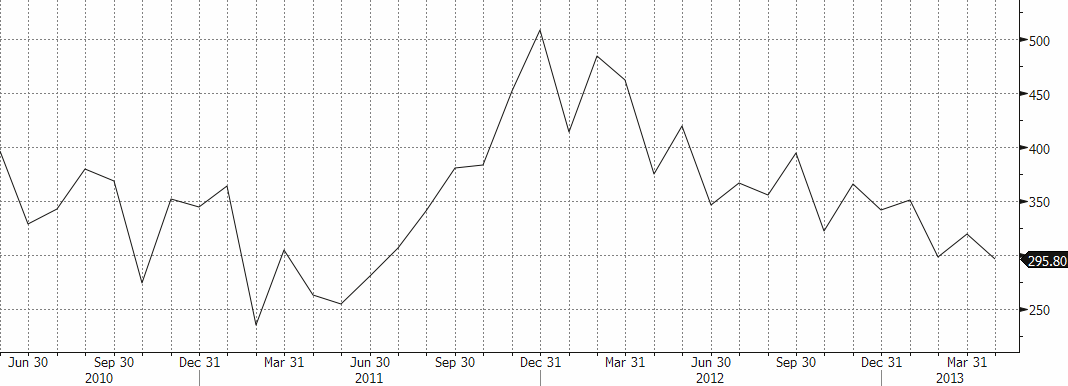
Som vi skrivit tidigare har vi haft kopparn under bevakning för att gå från neutral till köp. Tekniskt sett bedömde vi förutsättningarna som goda för en kortsiktig uppgång, vilket också materialiserades under veckan. Tveksamheten kring den fundamentala situationen kvarstår dock. Veckans handelsstatistik, som överlag mottogs positivt av de finansiella marknaderna, gav inte samma positiva besked för koppar. Kina är nettoimportörer, så statistiken över importen följs noggrant av marknaden. Aprilsiffran faller tillbaka igen till februaris nivå (se graf). Nu anses siffrorna under perioden februari-april i viss mån vara ”störda” av rapporteringen kring det kinesiska nyåret, men det är nu som det säsongsmässigt brukar vända upp igen.
Kopparimporten till Kina (1000-tals ton)
Tekniskt sett fick vi se den förväntade uppgången i veckan. Efter en test av den ”nya” stödnivån strax över $7200 igår fredag, stänger priset kring $7375. Det är för tidigt att tala om en mer långsiktig vändning, men kortsiktigt finns förtutsättningen för ytterligare återhämtning till nivåer kring $7550-7600.
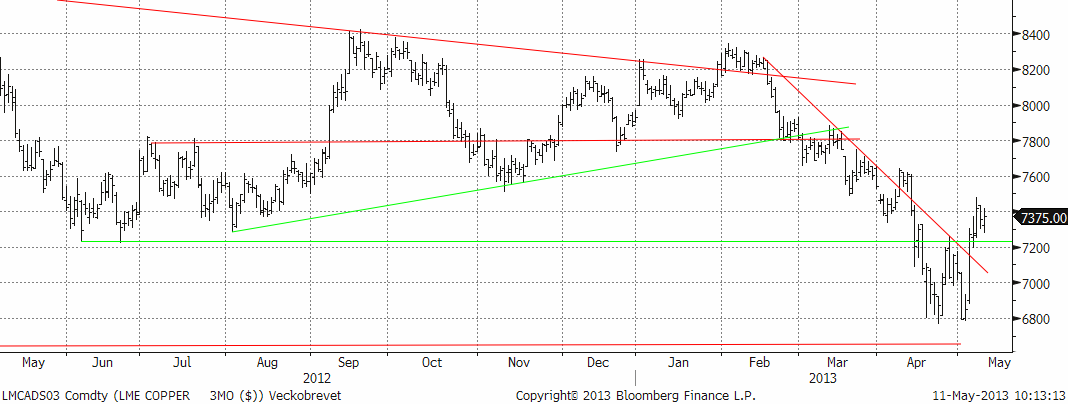
Vi förväntar oss fortsatt hög volatilitet. Vår kortsiktiga bedömning talar för uppsidan och vi rekommenderar därför köp av BULL KOPPAR X2 S eller X4 S.
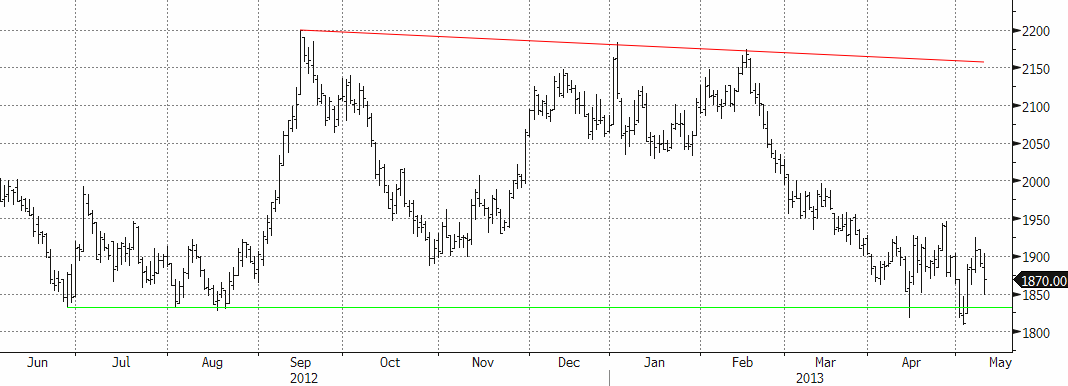
Aluminium
Den förväntade uppgången tog upp priset till motståndsnivån $1925, men där tog det stopp. Fredagens säljtryck bl.a. på den starkare dollarn, satte mer press på aluminium än på övriga basmetaller. Den kan finnas en förklaring. Japan är en betydande aluminiumimportör och den svaga yenen skapar ett motstånd. Under fredagen bröts den psykologiskt viktiga 100-vallen för usd/yen. Priset på aluminium föll ända ned till stödnivån $1850 (se graf) där den studsar för att stänga på $1870. Vi ser köpintresse framför allt från industriella aktörer som ”täcker in” framtida konsumtion, men också från långsiktiga investerare som bedömer nivåerna som alltför låga för ett fortsatt ökat utbud. Högkostnadsproducenterna, framför allt i Kina, förväntas minska utbudet om priset långvarigt stannar på nuvarande nivåer. Långsiktigt är nivån väldigt intressant för certifikatet ALUMINIUM S (utan hävstång).
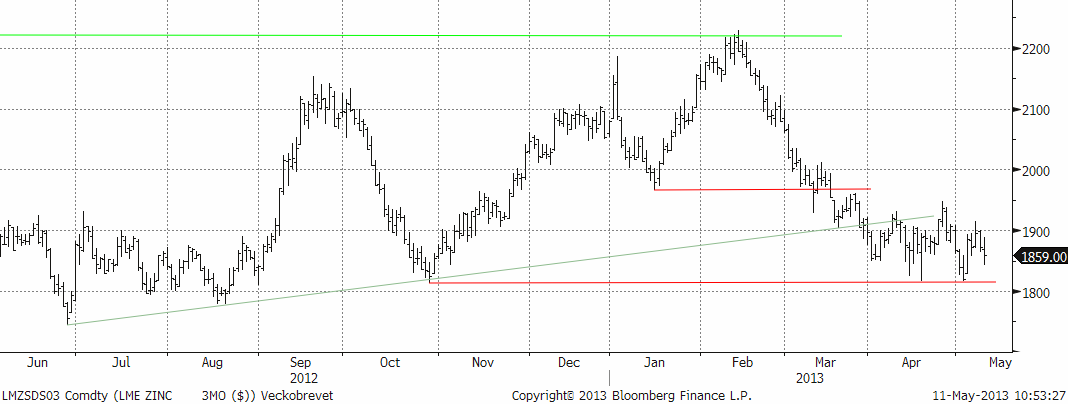
Zink
Zinken följde i stort sett övriga metaller under veckan, och får en ganska neutral stängning på veckan. Produktionsstatistik från Kina är lite oroväckande för zinkens fundamentala balans. Smältverksproduktionen ökar i Kina, delvis som en effekt av stort gruvutbud (höjda smältlöner till smältverken). Risken finns att det behövs ännu lägre priser för att påverka gruvutbudet. Risken är att det dröjer innan priset vänder upp på allvar. Vi bedömer ändå zinken som fundamentalt ”billig” ur ett kostnadsperspektiv och nuvarande nivåer är mycket intressanta på lite längre sikt (6-12 månader). I det perspektivet är ZINK S (utan hävstång) att föredra.
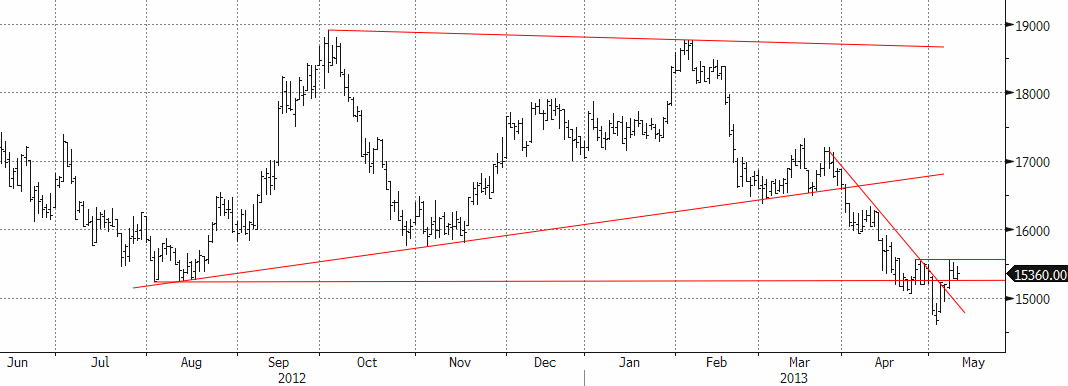
Nickel
Efter förra veckans snabba ”dipp” under $15000 till som lägst $14625, har nickel återhämtat sig och balanserar strax över stödnivåerna. Under veckan som gick fick vi den förväntade rekylen uppåt. Motståndet vid $15500 är tydligt (se graf).
Efterfrågeutsikterna är väldigt goda för nickel, där den rostfria- och specialstålproduktionen förväntas öka. Framför allt är det utbyggnaden av olje- och gasproduktion och specialstål till flygindustrin som går bra. Icke desto mindre ”lider” nickelmarknaden av ett överskott. Produktionstekniken av s.k. Nickel Pig Iron i Kina har utvecklats med s.k. Rotary Kiln Electric Furnaces (RKEF) teknik, vilken i genomsnitt sänker hela kostnadskurvan. Samtidigt får högkostnadsproducenterna i gruvledet problem på nuvarande nivåer. Vi har tidigare rapporterat om produktionsneddragningar i Australien, och det förväntas komma mer.
Precis som för koppar är det finansiella kollektivet väldigt ”korta”, d.v.s. det finns ett stort behov att köpa tillbaka tidigare sålda terminskontrakt, som i sig för den volatila metallen nickel, kan skapa utrymme för uppgångar. Effekten av RKEF-tekniken riskerar att flytta ner nivån där utbudsminskningarna verkligen får effekt. Trots det bedömer vi nivåerna som väldigt attraktiva på 6-12 månaders sikt. I det perspektivet är NICKEL S (utan hävstång) att föredra.
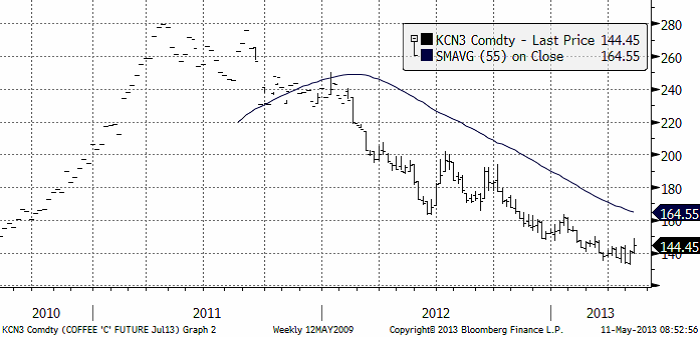
Kaffe
Kaffepriset (maj 2013) steg i veckan. Marknaden gjorde ett försök att bryta den övre delen i den trendkanal som priset fallit under i två år. Detta lyckades dock inte den här gången, men som jag har skrivit tidigare ser det ut att finnas köpare som är oroliga för att marknaden har bottnat. När det kommer tecken på styrka i marknaden, tenderar priset att sticka iväg uppåt. Än så länge har det funnits nog med säljare i de lägena för att trycka tillbaka priset, men när det inte längre gör det längre, tyder marknadens beteende på att det kan gå fort uppåt.
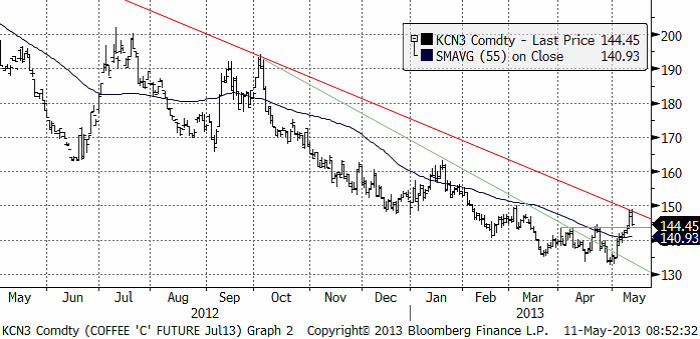
Nedan ser vi hur juli-terminen 2013 utvecklat sig prismässigt de tre senaste åren.
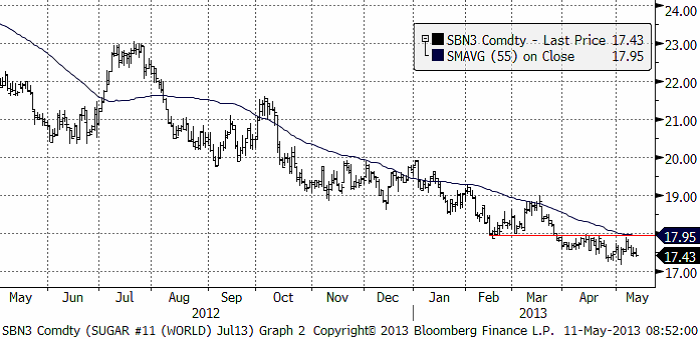
Socker
Sockerpriset (september 2013) fortsätter att ligga i fallande pristrend. Ingen skillnad från förra veckan. Socker och kaffe har följt varandra åt under lång tid, men medan kaffet visar lite tecken på trendvändning, ser man inte något alls av det i sockermarknaden. Vi fortsätter med neutral rekommendation.
[box]SEB Veckobrev Veckans råvarukommentar är producerat av SEB Merchant Banking och publiceras i samarbete och med tillstånd på Råvarumarknaden.se[/box]
Disclaimer
The information in this document has been compiled by SEB Merchant Banking, a division within Skandinaviska Enskilda Banken AB (publ) (“SEB”).
Opinions contained in this report represent the bank’s present opinion only and are subject to change without notice. All information contained in this report has been compiled in good faith from sources believed to be reliable. However, no representation or warranty, expressed or implied, is made with respect to the completeness or accuracy of its contents and the information is not to be relied upon as authoritative. Anyone considering taking actions based upon the content of this document is urged to base his or her investment decisions upon such investigations as he or she deems necessary. This document is being provided as information only, and no specific actions are being solicited as a result of it; to the extent permitted by law, no liability whatsoever is accepted for any direct or consequential loss arising from use of this document or its contents.
About SEB
SEB is a public company incorporated in Stockholm, Sweden, with limited liability. It is a participant at major Nordic and other European Regulated Markets and Multilateral Trading Facilities (as well as some non-European equivalent markets) for trading in financial instruments, such as markets operated by NASDAQ OMX, NYSE Euronext, London Stock Exchange, Deutsche Börse, Swiss Exchanges, Turquoise and Chi-X. SEB is authorized and regulated by Finansinspektionen in Sweden; it is authorized and subject to limited regulation by the Financial Services Authority for the conduct of designated investment business in the UK, and is subject to the provisions of relevant regulators in all other jurisdictions where SEB conducts operations. SEB Merchant Banking. All rights reserved.

Brent is climbing higher. Front-month is at USD 106.3/bl this morning, close to a weekly high and a USD 9/bl jump from Mondays open. This is the move we flagged as a risk earlier in the week: the market shifting from ”a deal is around the corner” to ”this is going to take longer than we thought”.

Analyst Commodities, SEB
During April, rest-of-year Brent remained remarkably stable around USD 90/bl. A stability which rested on one single assumption: the SoH reopens around 1 May. That assumption is now slowly falling apart.
As we highlighted yesterday: every week of delay beyond 1 May adds (theoretically) ish USD 5/bl to the rest-of-year average, as global inventories draw 100 million barrels per week. i.e., a mid-May reopening implies rest-of-year Brent closer to USD 100/bl, and anything pushing into June or July takes us meaningfully higher.
What’s changed in the last 48 hours:
#1: The US military has formally warned that clearing suspected sea mines from SoH could take up to six months. That is a completely different timescale from what the financial market is pricing. Even a political deal tomorrow does not immediately reopen the strait.
#2: Trump has shifted his tone from urgency to ”strategic patience”. In yesterday’s press conference: ”Don’t rush me… I want a great deal.” The market is reading this as a president no longer feeling pressured by timelines, with the naval blockade running in the background.
#3: So far, the military activity is escalating, not de-escalating. Axios reports Iran is laying more mines in SoH. The US 3rd carrier strike group (USS George H.W. Bush) is arriving with two countermine vessels. Trump yesterday ordered the US Navy to destroy any Iranian boats caught laying mines. While CNN reports that the Pentagon is actively drawing up plans to strike Iranian SoH capabilities and individual Iranian military leaders if the ceasefire collapses. i.e., NOT a attitude consistent with an imminent deal!
Spot crude and product prices eased off the early-April highs on a combination of system rerouting and deal optimism. Both now weakening. Goldman estimates April Gulf output is reduced by 14.5 mbl/d, or 57% of pre-war supply, a number that keeps getting worse the longer this drags on.
Demand-side adaptation is ongoing: S. Korea has cut its Middle East crude dependence from 69% to 56% by pulling more from the Americas and Africa, and Japan is kicking off a second round of SPR releases from 1 May. But SPRs are finite.
Ref. to the negotiations, we should not bet on speed. The current Iranian leadership is dominated by genuine hardliners willing to absorb economic pain and run the clock to extract concessions. That is not a setup for a rapid resolution. US/Israeli media briefings keep framing the delay as ”internal Iranian divisions”, the reality is more complicated and points toward weeks and months, not days.
Our point is that the complexity is large, and higher prices have only just started (given a scenario where the negotiations drag out in time). The market spent April leaning on the USD 90/bl rest-of-year assumption; that case is diminishing by the hour. If ”early May reopening” is replaced by ”June, July or later” over the next week or two, both crude and products have meaningful room to reprice higher from here. There is a high risk being short energy and betting on any immediate political resolution(!).
Down on Friday. Up on Monday. The Brent June crude oil contract traded down 5.1% last week to a close of $90.38/b. It reached a high of $103.87/b last Monday and a low of $86.09/b on Friday as Iran announced that the Strait of Hormuz was fully open for transit. That quickly changed over the weekend as the US upheld its blockade of Iranian oil exports while Iran naturally responded by closing the SoH again. The US blew a hole in the engine room of the Iranian ship TOUSKA and took custody of the ship on Sunday. Brent crude is up 5.6% this morning to $95.4/b.

The cease-fire is expiring tomorrow. The US has said it will send a delegation for a second round of negotiations in Islamabad in Pakistan. But Iran has for now rejected a second round of talks as it views US demands as unrealistic and excessive while the US is also blocking the Strait of Hormuz.
While Brent is up 5% this morning, the financial market is still very optimistic that progress will be made. That talks will continue and that the SoH will fully open by the start of May which is consistent with a rest-of-year average Brent crude oil price of around $90/b with the market now trading that balance at around $88/b.
Financial optimism vs. physical deterioration. We have a divergence where the financial market is trading negotiations, improvements and resolution while at the same time the physical market is deteriorating day by day. Physical oil flows remain constrained by disrupted flows, longer voyage times and elevated freight and insurance costs.
Financial markets are betting that a US/Iranian resolution will save us in time from violent shortages down the road. But every day that the SoH remains closed is bringing us closer to a potentially very painful point of shortages and much higher prices.
The US blockade is also a weapon of leverage against its European and Asian allies. When Iran closed the SoH it held the world economy as a hostage against the US. The US blockade of the SoH is of course blocking Iranian oil exports. But it is also an action of disruption directed towards Europe and Asia. The US has called for the rest of the world to engaged in the war with Iran: ”If you want oil from the Persian Gulf, then go and get it”. A risk is that the US plays brinkmanship with the global oil market directed towards its European and Asian allies and maybe even towards China to force them to engage and take part. Maybe unthinkable. But unthinkable has become the norm with Trump in the White House.
Wild moves yesterday. Brent crude traded to a high of $114.43/b and a low of $96.0/b and closed at $99.94/b yesterday.
US – Iran negotiations ongoing or not? What a day. Donald Trump announced that good talks were ongoing between Iran and the US and that the 48 hour deadline before bombing Iranian power plants and energy infrastructure was postponed by five days subject to success of ongoing meetings. Iranian media meanwhile stated that no meetings were ongoing at all.
Today we are scratching our heads trying to figure out what yesterday was all about.
Friends and family playing the market? Was it just Trump and his friends and family who were playing with oil and equity markets with $580m and $1.46bn in bets being placed by someone in oil and equity markets just 15 minutes before Trump’s announcement?
Was Trump pulling a TACO as he reached his political and economic pain point: Brent at $112/b, US Gas at $4/gal, SPX below 200dma and US 10yr above 4.4%?
Different Iranian factions with Trump talking with one of them? Are there real negotiations going on but with the US talking to one faction in Iran while another, the hardliners, are not involved and are denying any such negotiations going on?
Extending the ultimatum to attack and invade Kharg island next weekend? Or, is the five day delay of the deadline a tactical decision to allow US amphibious assault ships and marines to arrive in the Gulf in the upcoming weekend while US and Israeli continues to degrade Iranian military targets till then. And then next weekend a move by the US/Israel to attack and conquer for example the Kharg island?
We do not really know which it is or maybe a combination of these.
We did get some kind of TACO ydy. But markets have been waiting for some kind of TACO to happen and yesterday we got some kind of TACO. And Brent crude is now trading at $101.5/b as a result rather than at $112-114/b as it did no the high yesterday.
But what really matters in our view is the political situation on the ground in Iran. Will hardliners continue to hold power or will a more pragmatic faction gain power?
If the hardliners remain in power then oil pain should extend all the way to US midterm elections. The hardliners were apparently still in charge as of last week. Iran immediately retaliated and damaged LNG infrastructure in Qatar after Israel hit Iranian South Pars. The SoH was still closed and all messages coming out of Iran indicated defiance. Hardliners continues in power has a huge consequence for oil prices going forward. The regime has played its ’oil-weapon’ (closing or chocking the Strait of Hormuz). It is using it to achieve political goals. Deterrence: it needs to be so politically and economically expensive to attack Iran that it won’t happen again in the future. Or at least that the US/Israel thinks 10-times over before they attack again. The highest Brent crude oil closing price since the start of the war is $112.19/b last Friday. In comparison the 20-year inflation adjusted Brent price is $103/b. So Brent crude last Friday at $112.19/b isn’t a shockingly high price. And it is still far below the nominal high of $148/b from 2008 which is $220/b if inflation adjusted. So once in a lifetime Iran activates its most powerful weapon. The oil weapon. It needs to show the power of this weapon and it needs to reap political gains. Getting Brent to $112/b and intraday high of $119.5/b (9 March) isn’t a display of the power of that weapon. And it is not a deterrence against future attacks.
So if the hardliners remain in power in Iran, then the SoH will likely remain chocked all the way to US midterm elections and Brent crude will at a minimum go above the historical nominal high of $148/b from 2008.
Thus the outlook for the oil price for the rest of the year doesn’t depend all that much of whether Trump pulls a TACO or not. Stops bombing or not. It depends more on who is in charge in Iran. If it is the hardliners, then deterrence against future attacks via chocking of the SoH and high oil prices is the likely line of action. It is impacting the world but the Iranian ’oil-weapon’ is directed towards the US president and the the US midterm elections.
If a pragmatic faction gets to power in Iran, then a very prosperous future is possible. However, if power is shifting towards a more pragmatic faction in Iran then a completely different direction could evolve. Such a faction could possibly be open for cooperation with the US and the GCC and possibly put its issues versus Israel aside. Then the prosperity we have seen evolving in Dubai could be a possible future also for Iran.
So far it looks like the hardliners are fully in charge. As far as we can see, the hardliners are still fully in control in Iran. That points towards continued chocking of the SoH and oil prices ticking higher as global inventories (the oil market buffers) are drawn lower. And not just for a few more weeks, but possibly all the way to the US midterm elections.


Solkraften pressar elpriserna dagtid

Michel Gubel ger sin syn på oljemarknaden

Svag vårflod dubblar elpriserna
Brent crude up USD 9/bl on the week… ”deal around the corner” narrative fades
Market Still Betting on Timely Resolution, But Each Day Raises Shortage Risk

Det fysiska spotpriset på brentolja har slagit nytt rekord

Marknaden måste börja betrakta de höga kopparpriserna som det nya normala

Christian Kopfer om läget för oljan
Market Still Betting on Timely Resolution, But Each Day Raises Shortage Risk
Brent crude up USD 9/bl on the week… ”deal around the corner” narrative fades
-
 Nyheter4 veckor sedan
Det fysiska spotpriset på brentolja har slagit nytt rekord
-
 Nyheter4 veckor sedan
Marknaden måste börja betrakta de höga kopparpriserna som det nya normala
-
 Nyheter3 veckor sedan
Christian Kopfer om läget för oljan
-
Analys2 veckor sedan
Market Still Betting on Timely Resolution, But Each Day Raises Shortage Risk
-
Analys1 vecka sedan
Brent crude up USD 9/bl on the week… ”deal around the corner” narrative fades
-
 Nyheter5 dagar sedan
Michel Gubel ger sin syn på oljemarknaden
-
Nyheter5 dagar sedan
Svag vårflod dubblar elpriserna
-
 Nyheter3 dagar sedan
Solkraften pressar elpriserna dagtid