

Analys
SEB Råvarubrev 9 februari 2016

Lättnadsrally eller något mer bestående?
 MARKNADEN I KORTHET
Även förra veckan kantades av hög volatilitet och stor osäkerhet i de finansiella marknaderna. Svagare amerikansk arbetsmarknadsstatistik, en mjukare ton(?) från FED och stor osäkerhet avseende utflödet ur den Kinesiska valutareserven (som hamnade på $99.5 miljarder, något lägre än decembers utflöde på $107,9 miljarder) var alla event som adderade till nervositeten.
Valutor: US-dollarn var redan på tillbakagång efter FED-medlemen Dudly tidigare under veckan uttryckt sig överraskande (i alla fall om man ser till prisrörelsen) mjukt avseende en nästa räntehöjning i mars. Mer dollarsvaghet ser ut att vara på väg, i alla fall på kortare sikt (vi ser en risk för att €/$ når 1.14 området). Bank of Japan måste vara oerhört besvikna då det initiala JPY-fallet efter räntesänkningen till -0,1 % nu mer än fullständigt reverserats (ECB’s mjuka ton har ju inte heller förhindrat euron att stiga). Har QE nu nått vägs ände?
Råvaror: Den fallande dollarn tillsammans med positionsjusteringar (en kraftig ökning av långa kontrakt från förvaltade konton) fortsatte att trycka upp priserna på framför allt olja och metaller. Vad gäller oljan så bör nog innevarande uppgång ses som korrektiv, vilket dock inte utesluter ytterligare uppgång på kort sikt. Vi tror dock att oljan antagligen ännu inte sett sin absoluta botten varför ett säljläge bör sökas under kommande veckor. Antalet borriggar föll förra veckan till sin lägsta nivå sedan 1999 (men kom ihåg att en borrigg idag är betydligt produktivare än en för bara ett par år sedan…).
Börser: Än så länge är det inte mycket som talar för att vi nått korrektionsbotten. Dock borde den fallande dollarkursen ge stöd åt den amerikanska marknaden och de stigande råvarupriserna åt den brittiska börsen med sina många och stora råvarubolag.
Räntor: Fortsätter att vara under press. Sänker Riksbanken reporäntan än djupare ned i negativt territorium? Svaret kommer kl. 09:30 på torsdag.
TRENDER I SAMMANDRAG
- Olja och metaller hade en mycket stark vecka understödda av den svagare dollarn.
- Trots den kraftiga rekylen befinner sig oljan fortfarande i en fallande trend.
- Vi finner utvecklingen i guld och zink som de mest lovande av metallerna.
- Kaffe ser ut att ha avslutat sin stigande korrektion.
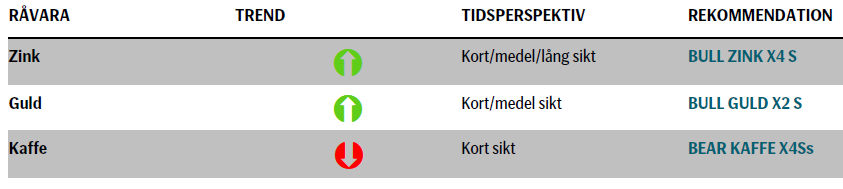
VECKANS REKOMMENDATIONER
En placering i certifikat och warranter är förknippat med risker. Du kan förlora hela ditt investerade kapital. Läs mer om riskerna i SEB:s offentliggjorda Grundprospekt för certifikat- och warrantprogram på seb.se/cert eller seb.se/mini.
OLJA (BRENT)
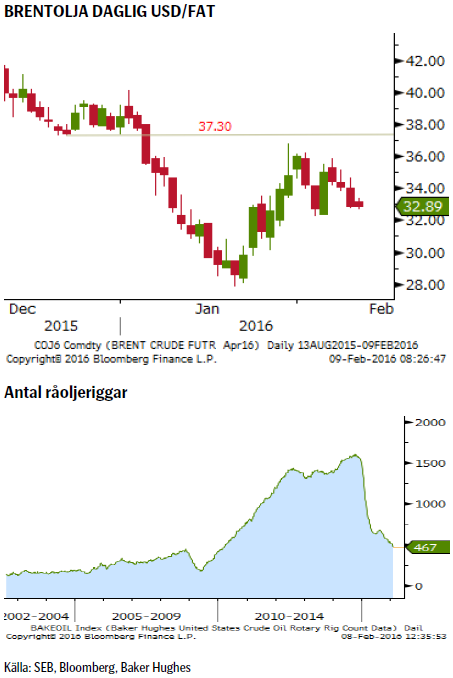 De större aktörerna i oljemarknaden betraktar fortfarande uppgången som temporär och inte bestående. Vi tenderar att hålla med dem varför vi etiketterar årets uppgång som tillfällig. I och med det så är vår vy också att vi ska söka ett säljläge för Brentoljan. I det korta perspektivet, med en korrigerande dollar, är vi dock för närvarande osäkra på huruvida vi nått en korrektionstopp (troligen inte) eller ej. Optimalt är troligen att söka ett säljläge upp emot $37/fatsnivån.
TREND
- Överutbudet består.
- Iran påbörjar snart leveranser av ca 300,000 fat per dag till EU (Franska Total börjar ta leveranser om 160,000 fat per dag från 16:e februari). Detta lär bara vara början. Iran är i desperat behov av intäkter.
- Vare sig samtalen mellan OPEC och Ryssland eller söndagens intra OPEC träff mellan Saudi och Venezuela gav något resultat.
- Borriggarna fortsätter att ”falla” och har nu nått 1999 års nivå (dock är ju dagens riggar betydligt produktivare än de äldre så jämförelsen haltar dock något).
REKOMMENDATION
- BEAR OLJA X2 S om/när priset når $37/fat.
ZINK
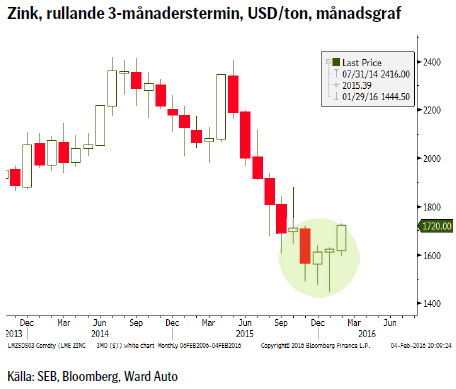 Zinkpriset har under de senaste två månaderna handlats på ett sätt (initialt ned under månaden men med högre månadsstängningar) som indikerar en möjlig långsiktigare botten. Ett förväntat marknadsunderskott på zink kan tillsammans med en omsvängning bland spekulanterna från kort till lång skapa en möjligt ”explosiv” uppgångsfas och speciellt så om US dollarn fortsätter att korrigera lägre.
TREND
- Tecken på kraftigare korrektion eller t.o.m. trendvändning föreligger efter prisutvecklingen under december och januari (de långa spikarna på nedsidan indikerar ”besegrade” säljare).
- US-dollarn korrigerar lägre efter oväntat ”mjukt” tal från FED’s Dudley (räntehöjningen i mars ifrågasatt).
- Produktionen fortsätter att falla med både neddragningar såväl som gruvstängningar.
- Bilindustrin går starkt (lägre drivmedelspriser styr även kunderna mot allt större bilar).
- Säsongsmönstret är normalt positivt för februari och mars.
REKOMMENDATION
- BULL ZINK X4 s
GULD
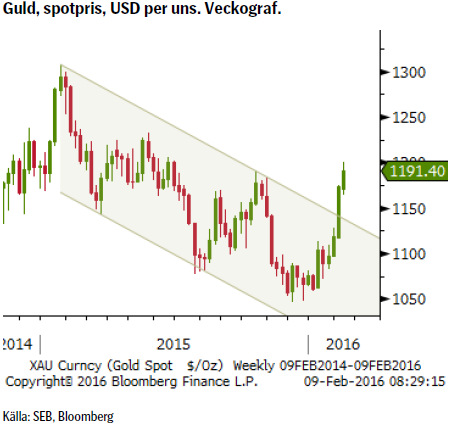 Guldet har gjort en storstilad comeback under början av 2016. Drivet av global riskaversion har guldet än en gång visat sig vara en relativt trygg hamn att ankra upp i. I och med att marknaden också börjar ifrågasätta både takten i FED’s räntehöjningar tog dollarn förra veckan en hel del stryk (och ytterligare dollar-försäljningar ser troliga ut i närtid när marknaden fortsätter att trimma ned sin fortfarande stora långa dollar position). Förra veckans Commitment of Traders rapport visar att den aggregerade långa dollar positionen föll med 15%.
TREND
- Efter att marknaden misslyckats med hålla fast vidbrottet ned till nya lägstapriser under december noterar vi att marknaden i en accelererande fas verkar täcka sina korta positioner. Förra veckans uppgång var den största sedan början av 2015.
- Då de senaste årens mönster av fallande toppar och bottnar nu brutits och nedåtkanalen från början av 2015 lämnats bör vi kunna räkna med ytterligare uppgångar under våren mot $1300/1350 området.
- Den korrigerande dollarn förstärker för närvarande guldets uppgång.
- Kina’s centralbank (bland annat) fortsatte att även under januari att bygga upp sin guldreserv.
REKOMMENDATION
- Vi rekommenderar att köpa BULL GULD X2S samt att öka vid en guldrekyl ned mot $1150.
KAFFE
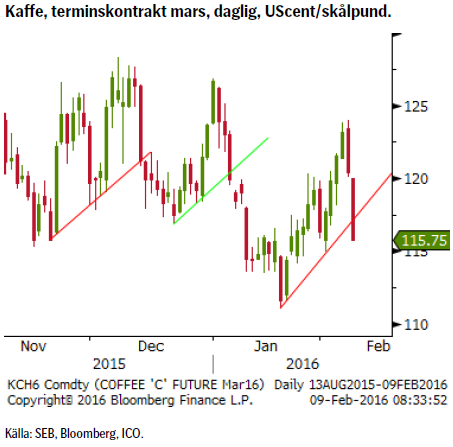 Exporten av kaffe är i ökande (+2.6% kvartal 4 2015 jämfört med 2014).
TREND
- Nedåttrenden är fortsatt obruten trots den senaste rekylen och den korta stödlinjen också vika igår.
- ICO, den internationella kaffeorganisationens senaste prognos pekar mot en ökad produktion för säsongen 2015/2016 jämfört med föregående säsong.
- Korrelationen mellan råolja och kaffe är relativt stark då petroleumprodukter är en viktig insatsvara i dagens jordbruk (till skillnad mot valutakurserna som har visat sig ha låga korrelationer med kaffe). Eftersom vi anser att oljans uppgång är temporär bör även kaffet fortsätta sin kräftgång.
REKOMMENDATION
- BEAR KAFFE X4 S (vi rekommenderar att öka på en bearposition vid brott under 114.95). Stopp om priset stiger över 124.
[box]SEB Veckobrev Veckans råvarukommentar är producerat av SEB:s Commodities Sales desk och publiceras i samarbete och med tillstånd på Råvarumarknaden.se[/box]
KÄLLOR
Bloomberg, Reuters, SEB
VILLKOR
För varje enskilt certifikat/mini future finns Slutliga Villkor som anger de fullständiga villkoren. Slutliga Villkor finns tillgängligt på kurssidan för respektive certifikat/mini future på www.seb.se, Börs & finans, fliken Strukturerade placeringar.
RISKER
En sammanfattning av de risker som är förknippade med Börshandlade certifikat generellt finns i Produktbroschyren för respektive certifikat eller mini future som är tillgängligt på seb.se/cert respektive seb.se/mini. För en fullständig bild av riskerna behöver du ta del av SEB:s offentliggjorda Grundprospekt för Certifikat- och Warrantprogram som är publicerat på www.seb.se/cert respektive seb.se/mini.
DISCLAIMER
Detta marknadsföringsmaterial, framtaget av SEB:s Commodities Sales desk, har upprättats enbart i informationssyfte.
Även om innehållet är baserat på källor som SEB bedömt som tillförlitliga ansvarar SEB inte för fel eller brister i informationen. Den utgör inte oberoende, objektiv investeringsanalys och skyddas därför inte av de bestämmelser som SEB har infört för att förebygga potentiella intressekonflikter. Yttranden från SEB:s Commodities Sales desk kan vara oförenliga med tidigare publicerat material från SEB, då den senare hänvisas uppmanas du att läsa den fullständiga rapporten innan någon åtgärd vidtas.
Dokumentationen utgör inte någon investeringsrådgivning och tillhandahålls till dig utan hänsyn till dina investeringsmål. Du uppmanas att självständigt bedöma och komplettera uppgifterna i denna dokumentation och att basera dina investeringsbeslut på material som bedöms erforderligt. Alla framåtblickande uttalanden, åsikter och förväntningar är föremål för risker, osäkerheter och andra faktorer och kan orsaka att det faktiska resultatet avviker väsentligt från det förväntade. Historisk avkastning är ingen garanti för framtida resultat. Detta dokument utgör inte ett erbjudande att teckna några värdepapper eller andra finansiella instrument. SEB svarar inte för förlust eller skada – direkt eller indirekt, eller av vad slag det vara må – som kan uppkomma till följd av användandet av detta material eller dess innehåll.
Observera att det kan förekomma att SEB, dess ledamöter, dess anställda eller dess moder- och/eller dotterbolag vid olika tillfällen innehar, har innehaft eller kommer att inneha aktier, positioner, rådgivningsuppdrag i samband med corporate finance-transaktioner, investment- eller merchantbanking-uppdrag och/eller lån i de bolag/finansiella instrument som nämns i materialet.
Materialet är avsett för mottagaren, all spridning, distribuering mångfaldigande eller annan användning av detta meddelande får inte ske utan SEB:s medgivande. Materialet riktar sig inte till personer vars medverkan kräver ytterligare prospekt, registrerings- eller andra åtgärder än vad som följer av svensk rätt. Det åligger var och en att iaktta sådana restriktioner. Materialet får inte distribueras i eller till land där distribution kräver ovan nämnda åtgärder eller strider mot reglering i sådant land. Materialet riktar sig således inte till fysiska eller juridiska personer hemmahörande i USA eller i något annat land där publicering eller tillhandahållande av materialet är förbjudet eller strider mot tillämpliga bestämmelser i landet.
Oaktat detta får SEB tillåta omfördelning av materialet till utvald tredje part i enlighet med gällande avtal. Materialet får inte spridas till fysiska eller juridiska personer som är medborgare eller har hemvist i ett land där sådan spridning är otillåten enligt tillämplig lag eller annan bestämmelse.
Skandinaviska Enskilda Banken AB (publ) är ett publikt aktiebolag och står under tillsyn av Finansinspektionen samt de lokala finansiella tillsynsmyndigheter i varje jurisdiktionen där SEB har filial eller dotterbolag.
Market is starting to take US/Iran headlines with a pinch of salt. Brent crude rose $2.8/b yesterday to an official close of $112.1/b. But after that it traded as low as $108.05/b before ending late night at around $109.7/b. Through the day it traded in a range of $106.87 – 112.72/b amid a flurry of news or rumors from Iran and the US. ”US temporary sanctions during negotiations” (falls alarm). ”We will bomb Iran” (not anyhow),… etc. While the market is still fluctuating to this kind of news flow, it is starting to take such headlines with a pinch of salt.

We’ll see. Maybe, maybe not. The Brent M1 contract is trading at $110.2/b this morning which very close to the average ticks through yesterday of $110.4/b.
Trump with bearish, verbal intervention whenever Brent trades above $110/b it seems. What seems to be a pattern is that Trump states something like ”very good negotiations going on with Iran”, ”New leaders in Iran are great,..”, ”Great progress in negotiations,…”, ”Deal in sight,..” etc whenever the Brent M1 contract trades above $110/b. An effort to cool the market. These hot air verbal interventions from Trump used to have a heavy bearish impact on prices, but they now seems to have less and less effect unless they are backed by reality.
As far as we can see there has been no real progress in the negotiations between the US and Iran with both sides still standing by their previous demands.
Iran is getting stronger while the cease fire lasts making a return to war for Trump yet harder. Iran is naturally in constant preparation for a return to war given Trump’s steady threats of bombing Iran again. Iran is naturally doing what ever is possible to prepare for a return to war. And every day the cease fire lasts it is better prepared. This naturally makes it more and more difficult and dangerous for the US to return to warring activity versus Iran as the consequences for energy infrastructure in the Persian Gulf will be more and more severe the longer the cease fire lasts. Israel seems to see it this way as well. That the war is not won and that current frozen state of a cease fire gives Iran opportunity to rebuild military and politically.
Global inventories are drawing down day by day. How much? In the meantime the Strait of Hormuz stays closed. There is varying measures and estimates of how much global inventories are drawing down. Our rough estimate, back of the envelope, is that global inventories are drawing down by at least some 10 mb/d or about 300 mb/d in a balance between loss of supply versus demand destruction. Other estimates we see are a monthly draw of 250-270 mb/d. The IEA only ’measured’ a draw in global observable stocks of 117 mb in April with oil on water rising 53 mb while on shore stocks fell 170 mb. But global stocks are hard to measure with large invisible, unmeasured stocks. As such a back of the envelope approach may be better.
Oil products is what the world is consuming. Oil product prices likely to rise while product stocks fall. Strategic Petroleum Reserves (SPR) are predominantly crude oil. Discharging oil from OECD SPR stocks, a sharp reduction in Chinese crude imports and a reduction in global refinery throughput of 6-7 mb/d has helped to keep crude oil markets satisfactorily supplied. But global inventories are drawing down none the less. And oil products is really what the world is consuming. So if global refinery throughput stays subdued, then demand will eventually have to match the supply of oil products. The likely path forward this summer is a steady draw down in jet fuel, diesel and gasoline. Higher prices for these. Then, if possible, higher refinery throughput and higher usage of crude in response to very profitable refinery margins. And lastly sharper draw in crude stocks and higher prices for these. But some 6 mb/d of oil products used to be exported through the Strait of Hormuz. And it may not be so easy to ramp up refinery activity across the world to compensate. Especially as Ukraine continues to damage Russian refineries as well as Russian crude production and export facilities.
Watch oil product stocks and prices as well as Brent calendar 2027. What to watch for this summer is thus oil product inventories falling and oil product premiums to crude rising. Another measure to watch is the Brent crude 2027 contract as it rises steadily day by day as the Strait of Hormuz stays closed and global oil inventories decline. The latter is close to the highest level since the start of the war and keeps rising.
The Brent M1 contract and the Brent 2027 prices and current price of jet fuel in Europe (ARA). All in USD/b

Our back of the envelope calculation of the global shortage created by the closure of the Strait of Hormuz. Note that 3.5 mb/d of discharge from SPR is also a draw. Note also that ’Forced demand loss’ of 2.5 mb/d is probably temporary and will fall back towards zero as logistics are sorted out leaving ’Price demand loss’ to do the job of balancing the market. Thus a shortfall of at least 9 mb/d created by the closure. More if SPR discharge is included and more if Forced demand loss recedes.

Brent is climbing higher. Front-month is at USD 106.3/bl this morning, close to a weekly high and a USD 9/bl jump from Mondays open. This is the move we flagged as a risk earlier in the week: the market shifting from ”a deal is around the corner” to ”this is going to take longer than we thought”.

Analyst Commodities, SEB
During April, rest-of-year Brent remained remarkably stable around USD 90/bl. A stability which rested on one single assumption: the SoH reopens around 1 May. That assumption is now slowly falling apart.
As we highlighted yesterday: every week of delay beyond 1 May adds (theoretically) ish USD 5/bl to the rest-of-year average, as global inventories draw 100 million barrels per week. i.e., a mid-May reopening implies rest-of-year Brent closer to USD 100/bl, and anything pushing into June or July takes us meaningfully higher.
What’s changed in the last 48 hours:
#1: The US military has formally warned that clearing suspected sea mines from SoH could take up to six months. That is a completely different timescale from what the financial market is pricing. Even a political deal tomorrow does not immediately reopen the strait.
#2: Trump has shifted his tone from urgency to ”strategic patience”. In yesterday’s press conference: ”Don’t rush me… I want a great deal.” The market is reading this as a president no longer feeling pressured by timelines, with the naval blockade running in the background.
#3: So far, the military activity is escalating, not de-escalating. Axios reports Iran is laying more mines in SoH. The US 3rd carrier strike group (USS George H.W. Bush) is arriving with two countermine vessels. Trump yesterday ordered the US Navy to destroy any Iranian boats caught laying mines. While CNN reports that the Pentagon is actively drawing up plans to strike Iranian SoH capabilities and individual Iranian military leaders if the ceasefire collapses. i.e., NOT a attitude consistent with an imminent deal!
Spot crude and product prices eased off the early-April highs on a combination of system rerouting and deal optimism. Both now weakening. Goldman estimates April Gulf output is reduced by 14.5 mbl/d, or 57% of pre-war supply, a number that keeps getting worse the longer this drags on.
Demand-side adaptation is ongoing: S. Korea has cut its Middle East crude dependence from 69% to 56% by pulling more from the Americas and Africa, and Japan is kicking off a second round of SPR releases from 1 May. But SPRs are finite.
Ref. to the negotiations, we should not bet on speed. The current Iranian leadership is dominated by genuine hardliners willing to absorb economic pain and run the clock to extract concessions. That is not a setup for a rapid resolution. US/Israeli media briefings keep framing the delay as ”internal Iranian divisions”, the reality is more complicated and points toward weeks and months, not days.
Our point is that the complexity is large, and higher prices have only just started (given a scenario where the negotiations drag out in time). The market spent April leaning on the USD 90/bl rest-of-year assumption; that case is diminishing by the hour. If ”early May reopening” is replaced by ”June, July or later” over the next week or two, both crude and products have meaningful room to reprice higher from here. There is a high risk being short energy and betting on any immediate political resolution(!).
Down on Friday. Up on Monday. The Brent June crude oil contract traded down 5.1% last week to a close of $90.38/b. It reached a high of $103.87/b last Monday and a low of $86.09/b on Friday as Iran announced that the Strait of Hormuz was fully open for transit. That quickly changed over the weekend as the US upheld its blockade of Iranian oil exports while Iran naturally responded by closing the SoH again. The US blew a hole in the engine room of the Iranian ship TOUSKA and took custody of the ship on Sunday. Brent crude is up 5.6% this morning to $95.4/b.
The cease-fire is expiring tomorrow. The US has said it will send a delegation for a second round of negotiations in Islamabad in Pakistan. But Iran has for now rejected a second round of talks as it views US demands as unrealistic and excessive while the US is also blocking the Strait of Hormuz.
While Brent is up 5% this morning, the financial market is still very optimistic that progress will be made. That talks will continue and that the SoH will fully open by the start of May which is consistent with a rest-of-year average Brent crude oil price of around $90/b with the market now trading that balance at around $88/b.
Financial optimism vs. physical deterioration. We have a divergence where the financial market is trading negotiations, improvements and resolution while at the same time the physical market is deteriorating day by day. Physical oil flows remain constrained by disrupted flows, longer voyage times and elevated freight and insurance costs.
Financial markets are betting that a US/Iranian resolution will save us in time from violent shortages down the road. But every day that the SoH remains closed is bringing us closer to a potentially very painful point of shortages and much higher prices.
The US blockade is also a weapon of leverage against its European and Asian allies. When Iran closed the SoH it held the world economy as a hostage against the US. The US blockade of the SoH is of course blocking Iranian oil exports. But it is also an action of disruption directed towards Europe and Asia. The US has called for the rest of the world to engaged in the war with Iran: ”If you want oil from the Persian Gulf, then go and get it”. A risk is that the US plays brinkmanship with the global oil market directed towards its European and Asian allies and maybe even towards China to force them to engage and take part. Maybe unthinkable. But unthinkable has become the norm with Trump in the White House.


Sommarväder skapar prisrally på elbörsen
Oil product price pain is set to rise as the Strait of Hormuz stays closed into summer

Solkraften pressar elpriserna dagtid

Michel Gubel ger sin syn på oljemarknaden