

Analys
SEB Råvarubrev 9 februari 2016

Lättnadsrally eller något mer bestående?
 MARKNADEN I KORTHET
Även förra veckan kantades av hög volatilitet och stor osäkerhet i de finansiella marknaderna. Svagare amerikansk arbetsmarknadsstatistik, en mjukare ton(?) från FED och stor osäkerhet avseende utflödet ur den Kinesiska valutareserven (som hamnade på $99.5 miljarder, något lägre än decembers utflöde på $107,9 miljarder) var alla event som adderade till nervositeten.
Valutor: US-dollarn var redan på tillbakagång efter FED-medlemen Dudly tidigare under veckan uttryckt sig överraskande (i alla fall om man ser till prisrörelsen) mjukt avseende en nästa räntehöjning i mars. Mer dollarsvaghet ser ut att vara på väg, i alla fall på kortare sikt (vi ser en risk för att €/$ når 1.14 området). Bank of Japan måste vara oerhört besvikna då det initiala JPY-fallet efter räntesänkningen till -0,1 % nu mer än fullständigt reverserats (ECB’s mjuka ton har ju inte heller förhindrat euron att stiga). Har QE nu nått vägs ände?
Råvaror: Den fallande dollarn tillsammans med positionsjusteringar (en kraftig ökning av långa kontrakt från förvaltade konton) fortsatte att trycka upp priserna på framför allt olja och metaller. Vad gäller oljan så bör nog innevarande uppgång ses som korrektiv, vilket dock inte utesluter ytterligare uppgång på kort sikt. Vi tror dock att oljan antagligen ännu inte sett sin absoluta botten varför ett säljläge bör sökas under kommande veckor. Antalet borriggar föll förra veckan till sin lägsta nivå sedan 1999 (men kom ihåg att en borrigg idag är betydligt produktivare än en för bara ett par år sedan…).
Börser: Än så länge är det inte mycket som talar för att vi nått korrektionsbotten. Dock borde den fallande dollarkursen ge stöd åt den amerikanska marknaden och de stigande råvarupriserna åt den brittiska börsen med sina många och stora råvarubolag.
Räntor: Fortsätter att vara under press. Sänker Riksbanken reporäntan än djupare ned i negativt territorium? Svaret kommer kl. 09:30 på torsdag.
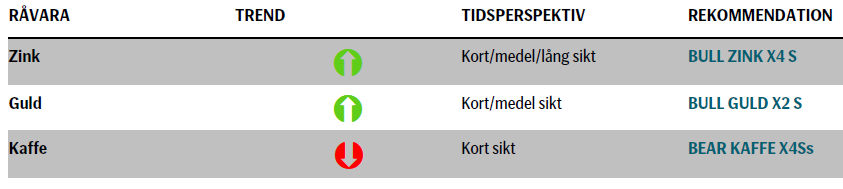
TRENDER I SAMMANDRAG
- Olja och metaller hade en mycket stark vecka understödda av den svagare dollarn.
- Trots den kraftiga rekylen befinner sig oljan fortfarande i en fallande trend.
- Vi finner utvecklingen i guld och zink som de mest lovande av metallerna.
- Kaffe ser ut att ha avslutat sin stigande korrektion.
VECKANS REKOMMENDATIONER
En placering i certifikat och warranter är förknippat med risker. Du kan förlora hela ditt investerade kapital. Läs mer om riskerna i SEB:s offentliggjorda Grundprospekt för certifikat- och warrantprogram på seb.se/cert eller seb.se/mini.
OLJA (BRENT)
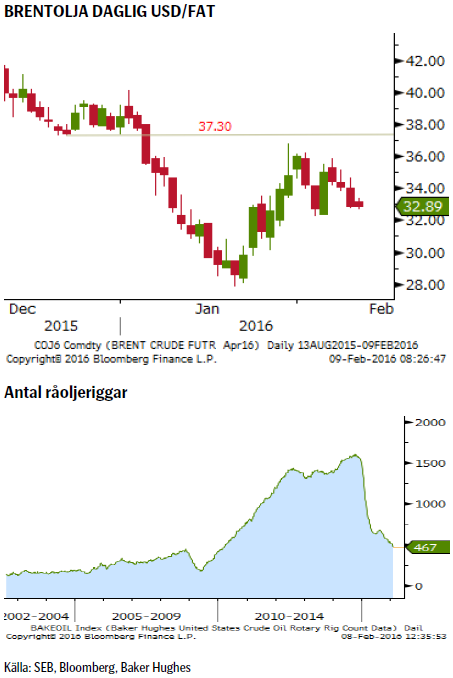 De större aktörerna i oljemarknaden betraktar fortfarande uppgången som temporär och inte bestående. Vi tenderar att hålla med dem varför vi etiketterar årets uppgång som tillfällig. I och med det så är vår vy också att vi ska söka ett säljläge för Brentoljan. I det korta perspektivet, med en korrigerande dollar, är vi dock för närvarande osäkra på huruvida vi nått en korrektionstopp (troligen inte) eller ej. Optimalt är troligen att söka ett säljläge upp emot $37/fatsnivån.
TREND
- Överutbudet består.
- Iran påbörjar snart leveranser av ca 300,000 fat per dag till EU (Franska Total börjar ta leveranser om 160,000 fat per dag från 16:e februari). Detta lär bara vara början. Iran är i desperat behov av intäkter.
- Vare sig samtalen mellan OPEC och Ryssland eller söndagens intra OPEC träff mellan Saudi och Venezuela gav något resultat.
- Borriggarna fortsätter att ”falla” och har nu nått 1999 års nivå (dock är ju dagens riggar betydligt produktivare än de äldre så jämförelsen haltar dock något).
REKOMMENDATION
- BEAR OLJA X2 S om/när priset når $37/fat.
ZINK
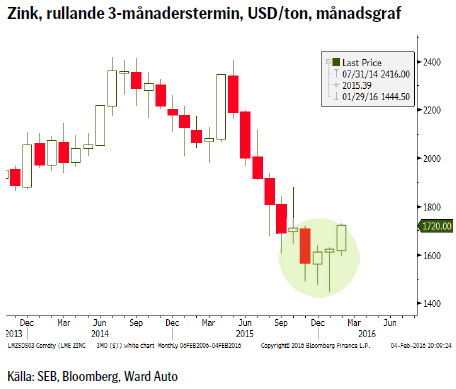 Zinkpriset har under de senaste två månaderna handlats på ett sätt (initialt ned under månaden men med högre månadsstängningar) som indikerar en möjlig långsiktigare botten. Ett förväntat marknadsunderskott på zink kan tillsammans med en omsvängning bland spekulanterna från kort till lång skapa en möjligt ”explosiv” uppgångsfas och speciellt så om US dollarn fortsätter att korrigera lägre.
TREND
- Tecken på kraftigare korrektion eller t.o.m. trendvändning föreligger efter prisutvecklingen under december och januari (de långa spikarna på nedsidan indikerar ”besegrade” säljare).
- US-dollarn korrigerar lägre efter oväntat ”mjukt” tal från FED’s Dudley (räntehöjningen i mars ifrågasatt).
- Produktionen fortsätter att falla med både neddragningar såväl som gruvstängningar.
- Bilindustrin går starkt (lägre drivmedelspriser styr även kunderna mot allt större bilar).
- Säsongsmönstret är normalt positivt för februari och mars.
REKOMMENDATION
- BULL ZINK X4 s
GULD
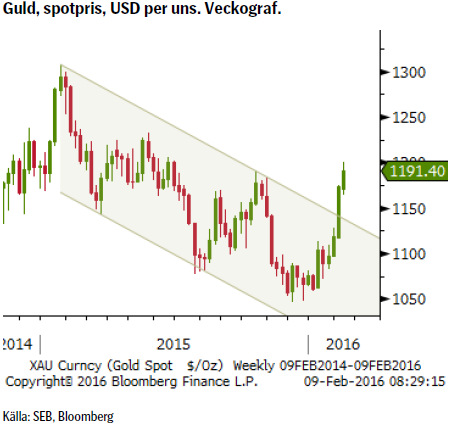 Guldet har gjort en storstilad comeback under början av 2016. Drivet av global riskaversion har guldet än en gång visat sig vara en relativt trygg hamn att ankra upp i. I och med att marknaden också börjar ifrågasätta både takten i FED’s räntehöjningar tog dollarn förra veckan en hel del stryk (och ytterligare dollar-försäljningar ser troliga ut i närtid när marknaden fortsätter att trimma ned sin fortfarande stora långa dollar position). Förra veckans Commitment of Traders rapport visar att den aggregerade långa dollar positionen föll med 15%.
TREND
- Efter att marknaden misslyckats med hålla fast vidbrottet ned till nya lägstapriser under december noterar vi att marknaden i en accelererande fas verkar täcka sina korta positioner. Förra veckans uppgång var den största sedan början av 2015.
- Då de senaste årens mönster av fallande toppar och bottnar nu brutits och nedåtkanalen från början av 2015 lämnats bör vi kunna räkna med ytterligare uppgångar under våren mot $1300/1350 området.
- Den korrigerande dollarn förstärker för närvarande guldets uppgång.
- Kina’s centralbank (bland annat) fortsatte att även under januari att bygga upp sin guldreserv.
REKOMMENDATION
- Vi rekommenderar att köpa BULL GULD X2S samt att öka vid en guldrekyl ned mot $1150.
KAFFE
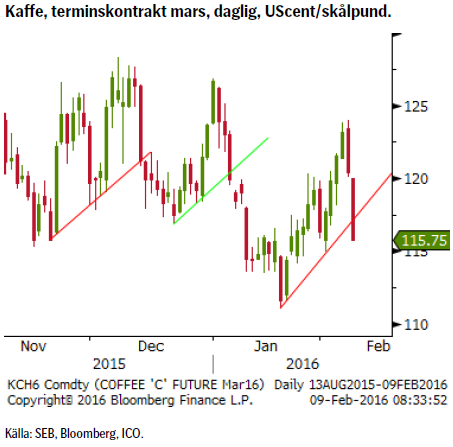 Exporten av kaffe är i ökande (+2.6% kvartal 4 2015 jämfört med 2014).
TREND
- Nedåttrenden är fortsatt obruten trots den senaste rekylen och den korta stödlinjen också vika igår.
- ICO, den internationella kaffeorganisationens senaste prognos pekar mot en ökad produktion för säsongen 2015/2016 jämfört med föregående säsong.
- Korrelationen mellan råolja och kaffe är relativt stark då petroleumprodukter är en viktig insatsvara i dagens jordbruk (till skillnad mot valutakurserna som har visat sig ha låga korrelationer med kaffe). Eftersom vi anser att oljans uppgång är temporär bör även kaffet fortsätta sin kräftgång.
REKOMMENDATION
- BEAR KAFFE X4 S (vi rekommenderar att öka på en bearposition vid brott under 114.95). Stopp om priset stiger över 124.
[box]SEB Veckobrev Veckans råvarukommentar är producerat av SEB:s Commodities Sales desk och publiceras i samarbete och med tillstånd på Råvarumarknaden.se[/box]
KÄLLOR
Bloomberg, Reuters, SEB
VILLKOR
För varje enskilt certifikat/mini future finns Slutliga Villkor som anger de fullständiga villkoren. Slutliga Villkor finns tillgängligt på kurssidan för respektive certifikat/mini future på www.seb.se, Börs & finans, fliken Strukturerade placeringar.
RISKER
En sammanfattning av de risker som är förknippade med Börshandlade certifikat generellt finns i Produktbroschyren för respektive certifikat eller mini future som är tillgängligt på seb.se/cert respektive seb.se/mini. För en fullständig bild av riskerna behöver du ta del av SEB:s offentliggjorda Grundprospekt för Certifikat- och Warrantprogram som är publicerat på www.seb.se/cert respektive seb.se/mini.
DISCLAIMER
Detta marknadsföringsmaterial, framtaget av SEB:s Commodities Sales desk, har upprättats enbart i informationssyfte.
Även om innehållet är baserat på källor som SEB bedömt som tillförlitliga ansvarar SEB inte för fel eller brister i informationen. Den utgör inte oberoende, objektiv investeringsanalys och skyddas därför inte av de bestämmelser som SEB har infört för att förebygga potentiella intressekonflikter. Yttranden från SEB:s Commodities Sales desk kan vara oförenliga med tidigare publicerat material från SEB, då den senare hänvisas uppmanas du att läsa den fullständiga rapporten innan någon åtgärd vidtas.
Dokumentationen utgör inte någon investeringsrådgivning och tillhandahålls till dig utan hänsyn till dina investeringsmål. Du uppmanas att självständigt bedöma och komplettera uppgifterna i denna dokumentation och att basera dina investeringsbeslut på material som bedöms erforderligt. Alla framåtblickande uttalanden, åsikter och förväntningar är föremål för risker, osäkerheter och andra faktorer och kan orsaka att det faktiska resultatet avviker väsentligt från det förväntade. Historisk avkastning är ingen garanti för framtida resultat. Detta dokument utgör inte ett erbjudande att teckna några värdepapper eller andra finansiella instrument. SEB svarar inte för förlust eller skada – direkt eller indirekt, eller av vad slag det vara må – som kan uppkomma till följd av användandet av detta material eller dess innehåll.
Observera att det kan förekomma att SEB, dess ledamöter, dess anställda eller dess moder- och/eller dotterbolag vid olika tillfällen innehar, har innehaft eller kommer att inneha aktier, positioner, rådgivningsuppdrag i samband med corporate finance-transaktioner, investment- eller merchantbanking-uppdrag och/eller lån i de bolag/finansiella instrument som nämns i materialet.
Materialet är avsett för mottagaren, all spridning, distribuering mångfaldigande eller annan användning av detta meddelande får inte ske utan SEB:s medgivande. Materialet riktar sig inte till personer vars medverkan kräver ytterligare prospekt, registrerings- eller andra åtgärder än vad som följer av svensk rätt. Det åligger var och en att iaktta sådana restriktioner. Materialet får inte distribueras i eller till land där distribution kräver ovan nämnda åtgärder eller strider mot reglering i sådant land. Materialet riktar sig således inte till fysiska eller juridiska personer hemmahörande i USA eller i något annat land där publicering eller tillhandahållande av materialet är förbjudet eller strider mot tillämpliga bestämmelser i landet.
Oaktat detta får SEB tillåta omfördelning av materialet till utvald tredje part i enlighet med gällande avtal. Materialet får inte spridas till fysiska eller juridiska personer som är medborgare eller har hemvist i ett land där sådan spridning är otillåten enligt tillämplig lag eller annan bestämmelse.
Skandinaviska Enskilda Banken AB (publ) är ett publikt aktiebolag och står under tillsyn av Finansinspektionen samt de lokala finansiella tillsynsmyndigheter i varje jurisdiktionen där SEB har filial eller dotterbolag.
When it starts to move lower it moves rather quickly. Gaza, China, IEA. Brent crude is down 2.1% today to $62/b after having traded as high as $66.58/b last Thursday and above $70/b in late September. The sell-off follows the truce/peace in Gaze, a flareup in US-China trade and yet another bearish oil outlook from the IEA.

A lasting peace in Gaze could drive crude oil at sea to onshore stocks. A lasting peace in Gaza would probably calm down the Houthis and thus allow more normal shipments of crude oil to sail through the Suez Canal, the Red Sea and out through the Bab-el-Mandeb Strait. Crude oil at sea has risen from 48 mb in April to now 91 mb versus a pre-Covid normal of about 50-60 mb. The rise to 91 mb is probably the result of crude sailing around Africa to be shot to pieces by the Houthis. If sailings were to normalize through the Suez Canal, then it could free up some 40 mb in transit at sea moving onshore into stocks.
The US-China trade conflict is of course bearish for demand if it continues.
Bearish IEA yet again. Getting closer to 2026. Credibility rises. We expect OPEC to cut end of 2025. The bearish monthly report from the IEA is what it is, but the closer we get to 2026, the more likely the IEA is of being ball-park right in its outlook. In its monthly report today the IEA estimates that the need for crude oil from OPEC in 2026 will be 25.4 mb/d versus production by the group in September of 29.1 mb/d. The group thus needs to do some serious cutting at the end of 2025 if it wants to keep the market balanced and avoid inventories from skyrocketing. Given that IEA is correct that is. We do however expect OPEC to implement cuts to avoid a large increase in inventories in Q1-26. The group will probably revert to cuts either at its early December meeting when they discuss production for January or in early January when they discuss production for February. The oil price will likely head yet lower until the group reverts to cuts.
Dubai: The Mid-East anchor dragging crude oil lower. Surplus emerging in Mid-East pricing. Crude oil prices held surprisingly strong all through the summer. A sign and a key source of that strength came from the strength in the front-end backwardation of the Dubai crude oil curve. It held out strong from mid-June and all until late September with an average 1-3mth time-spread premium of $1.8/b from mid-June to end of September. The 1-3mth time-spreads for Brent and WTI however were in steady deterioration from late June while their flat prices probably were held up by the strength coming from the Persian Gulf. Then in late September the strength in the Dubai curve suddenly collapsed. Since the start of October it has been weaker than both the Brent and the WTI curves. The Dubai 1-3mth time-spread now only stands at $0.25/b. The Middle East is now exporting more as it is producing more and also consuming less following elevated summer crude burn for power (Aircon) etc.
The only bear-element missing is a sudden and solid rise in OECD stocks. The only thing that is missing for the bear-case everyone have been waiting for is a solid, visible rise in OECD stocks in general and US oil stocks specifically. So watch out for US API indications tomorrow and official US oil inventories on Thursday.
No sign of any kind of fire-sale of oil from Saudi Arabia yet. To what we can see, Saudi Arabia is not at all struggling to sell its oil. It only lowered its Official Selling Prices (OSPs) to Asia marginally for November. A surplus market + Saudi determination to sell its oil to the market would normally lead to a sharp lowering of Saudi OSPs to Asia. Not yet at least and not for November.
The 5yr contract close to fixed at $68/b. Of importance with respect to how far down oil can/will go. When the oil market moves into a surplus then the spot price starts to trade in a large discount to the 5yr contract. Typically $10-15/b below the 5yr contract on average in bear-years (2009, 2015, 2016, 2020). But the 5yr contract is usually pulled lower as well thus making this approach a moving target. But the 5yr contract price has now been rock solidly been pegged to $68/b since 2022. And in the 2022 bull-year (Brent spot average $99/b), the 5yr contract only went to $72/b on average. If we assume that the same goes for the downside and that 2026 is a bear-year then the 5yr goes to $64/b while the spot is trading at a $10-15/b discount to that. That would imply an average spot price next year of $49-54/b. But that is if OPEC doesn’t revert to cuts and instead keeps production flowing. We think OPEC(+) will trim/cut production as needed into 2026 to prevent a huge build-up in global oil stocks and a crash in prices. But for now we are still heading lower. Into the $50ies/b.
Some rebound but not much. Brent crude rebounded 1.5% yesterday to $65.47/b. This morning it is inching 0.2% up to $65.6/b. The lowest close last week was on Thursday at $64.11/b.
The curve structure is almost as week as it was before the weekend. The rebound we now have gotten post the message from OPEC+ over the weekend is to a large degree a rebound along the curve rather than much strengthening at the front-end of the curve. That part of the curve structure is almost as weak as it was last Thursday.
We are still on a weakening path. The message from OPEC+ over the weekend was we are still on a weakening path with rising supply from the group. It is just not as rapidly weakening as was feared ahead of the weekend when a quota hike of 500 kb/d/mth for November was discussed.
The Brent curve is on its way to full contango with Brent dipping into the $50ies/b. Thus the ongoing weakening we have had in the crude curve since the start of the year, and especially since early June, will continue until the Brent crude oil forward curve is in full contango along with visibly rising US and OECD oil inventories. The front-month Brent contract will then flip down towards the $60/b-line and below into the $50ies/b.
At what point will OPEC+ turn to cuts? The big question then becomes: When will OPEC+ turn around to make some cuts? At what (price) point will they choose to stabilize the market? Because for sure they will. Higher oil inventories, some more shedding of drilling rigs in US shale and Brent into the 50ies somewhere is probably where the group will step in.
There is nothing we have seen from the group so far which indicates that they will close their eyes, let the world drown in oil and the oil price crash to $40/b or below.
The message from OPEC+ is also about balance and stability. The world won’t drown in oil in 2026. The message from the group as far as we manage to interpret it is twofold: 1) Taking back market share which requires a lower price for non-OPEC+ to back off a bit, and 2) Oil market stability and balance. It is not just about 1. Thus fretting about how we are all going to drown in oil in 2026 is totally off the mark by just focusing on point 1.
When to buy cal 2026? Before Christmas when Brent hits $55/b and before OPEC+ holds its last meeting of the year which is likely to be in early December.
Brent crude oil prices have rebounded a bit along the forward curve. Not much strengthening in the structure of the curve. The front-end backwardation is not much stronger today than on its weakest level so far this year which was on Thursday last week.

The front-end backwardation fell to its weakest level so far this year on Thursday last week. A slight pickup yesterday and today, but still very close to the weakest year to date. More oil from OPEC+ in the coming months and softer demand and rising inventories. We are heading for yet softer levels.

Down to the lowest since early May. Brent crude has fallen sharply the latest four days. It closed at USD 64.11/b yesterday which is the lowest since early May. It is staging a 1.3% rebound this morning along with gains in both equities and industrial metals with an added touch of support from a softer USD on top.
What stands out the most to us this week is the collapse in the Dubai one to three months time-spread.
Dubai is medium sour crude. OPEC+ is in general medium sour crude production. Asian refineries are predominantly designed to process medium sour crude. So Dubai is the real measure of the balance between OPEC+ holding back or not versus Asian oil demand for consumption and stock building.
A sharp weakening of the front-end of the Dubai curve. The front-end of the Dubai crude curve has been holding out very solidly throughout this summer while the front-end of the Brent and WTI curves have been steadily softening. But the strength in the Dubai curve in our view was carrying the crude oil market in general. A source of strength in the crude oil market. The core of the strength.
The now finally sharp decline of the front-end of the Dubai crude curve is thus a strong shift. Weakness in the Dubai crude marker is weakness in the core of the oil market. The core which has helped to hold the oil market elevated.
Facts supports the weakening. Add in facts of Iraq lifting production from Kurdistan through Turkey. Saudi Arabia lifting production to 10 mb/d in September (normal production level) and lifting exports as well as domestic demand for oil for power for air con is fading along with summer heat. Add also in counter seasonal rise in US crude and product stocks last week. US oil stocks usually decline by 1.3 mb/week this time of year. Last week they instead rose 6.4 mb/week (+7.2 mb if including SPR). Total US commercial oil stocks are now only 2.1 mb below the 2015-19 seasonal average. US oil stocks normally decline from now to Christmas. If they instead continue to rise, then it will be strongly counter seasonal rise and will create a very strong bearish pressure on oil prices.
Will OPEC+ lift its voluntary quotas by zero, 137 kb/d, 500 kb/d or 1.5 mb/d? On Sunday of course OPEC+ will decide on how much to unwind of the remaining 1.5 mb/d of voluntary quotas for November. Will it be 137 kb/d yet again as for October? Will it be 500 kb/d as was talked about earlier this week? Or will it be a full unwind in one go of 1.5 mb/d? We think most likely now it will be at least 500 kb/d and possibly a full unwind. We discussed this in a not earlier this week: ”500 kb/d of voluntary quotas in October. But a full unwind of 1.5 mb/d”
The strength in the front-end of the Dubai curve held out through summer while Brent and WTI curve structures weakened steadily. That core strength helped to keep flat crude oil prices elevated close to the 70-line. Now also the Dubai curve has given in.

Brent crude oil forward curves

Total US commercial stocks now close to normal. Counter seasonal rise last week. Rest of year?

Total US crude and product stocks on a steady trend higher.


Guld och silver stiger hela tiden mot nya höjder
The Mid-East anchor dragging crude oil lower

Samtal om sällsynta jordartsmetaller, guld och silver

Brookfield köper bränsleceller för 5 miljarder USD av Bloom Energy för att driva AI-datacenter

Teck Resources kan förse Nordamerika och kanske hela G7 med all germanium som behövs

Tyskland har så höga elpriser att företag inte har råd att använda elektricitet

OPEC+ missar produktionsmål, stöder oljepriserna

Ett samtal om guld, olja, fjärrvärme och förnybar energi
Brent crude ticks higher on tension, but market structure stays soft

Guld nära 4000 USD och silver 50 USD, därför kan de fortsätta stiga
-
Nyheter4 veckor sedan
Tyskland har så höga elpriser att företag inte har råd att använda elektricitet
-
 Nyheter3 veckor sedan
OPEC+ missar produktionsmål, stöder oljepriserna
-
 Nyheter3 veckor sedan
Ett samtal om guld, olja, fjärrvärme och förnybar energi
-
Analys4 veckor sedan
Brent crude ticks higher on tension, but market structure stays soft
-
 Nyheter2 veckor sedan
Guld nära 4000 USD och silver 50 USD, därför kan de fortsätta stiga
-
Analys3 veckor sedan
Are Ukraine’s attacks on Russian energy infrastructure working?
-

 Nyheter3 veckor sedan
Guldpriset uppe på nya höjder, nu 3750 USD
-

 Nyheter2 veckor sedan
Blykalla och amerikanska Oklo inleder ett samarbete