

Analys
SEB Råvarubrev 17 maj 2016

 Det mesta pekar mot en fortsatt god riskaptit.
MARKNADEN I KORTHET
Kortsiktig volatilitet och osäkerhet men under ytan fortsatt positiv utveckling. Långa räntor vände åter upp i slutet av förra veckan, råvaror fortsatte generellt att stiga, börserna ser ut att ligga i positiva konsolideringar och dollarn är åter i stigande. Nya kinesiska stimulanser också bör ge mer medvind för riskaptiten likaså de senaste opinionsundersökningarna i Storbritannien som allt mer pekar mot att det blir ett nej till Brexit.
Råvaror: Oljeprisuppgången fortsatte även förra veckan och vi närmar oss nu taket i 2016 års stigande kanal. Koppar nådde sitt ideal korrektionsmål. Jordbruksprodukter (kaffe, ris, majs, vete m.fl.) har haft en mycket stark vecka. Ädelmetaller handlas fortsatt med en fast underton men också med väldigt stora långa nettopositioner.
Valuta: Dollarn har fortsatt att stärkas och förväntas att fortsätta göra så. Den svenska kronan försvagades påtagligt under förra veckan (Konjunkturinstitutets KIX index) och frågan är om vi nu passerat en vändningspunkt.
Börser: Överlag positiva konsolideringar. MSCI världsindex ser redo ut att snart fortsätta upp och MSCI tillväxtmarknader är möjligtvis i slutfasen av en bottenformation.
Räntor: Långa bör i en positivare miljö fortsätta den uppgång som påbörjades i slutet av förra veckan.
OBSERVATIONER I SAMMANDRAG
- Brentoljans korrektion avslutades något i förtid, nya toppar är följaktligen på väg.
- Elpriset (Kv3 2016) är oförändrat sedan förra veckan.
- Guld och silver fortsätter att konsolidera.
- Dollarn har fortsatt att uppvisa styrka.
- Kaffe har brutit högre, framför allt pga. täckandet av korta terminspositioner.
- Koppar har utlöst vår vinsthemtagning och vi svänger nu 180 grader och går långa.
- Majspriset är åter över USc390. Beteendet är fortsatt positivt.
- Ris har fortsatt och bör fortsätta att stiga ytterligare. Ta vinst vid 12,30.
VECKANS NYA REKOMMENDATIONER
En placering i certifikat och warranter är förknippat med risker. Du kan förlora hela ditt investerade kapital. Läs mer om riskerna i SEB:s offentliggjorda Grundprospekt för certifikat- och warrantprogram på seb.se/cert eller seb.se/mini
OLJA BRENT
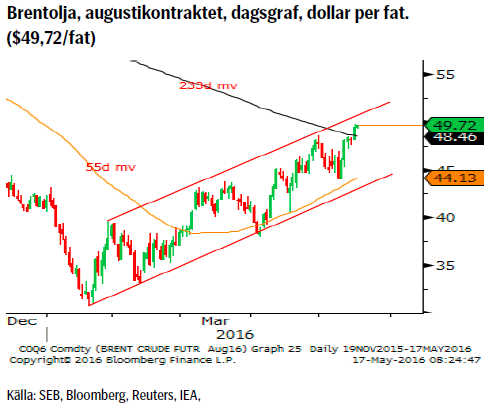 Vi missade förra veckan med en liten marginal, 70cent, vårt mål för att ta vinst på BEAR OLJA X2 S. Den efterföljande prisutvecklingen är fortsatt positiv och nya toppar är också mycket troliga innan nästa korrektionsförsök bör komma. Den mest basala trenddefinitionen, högre bottnar och högre toppar är också kvar på plats. Dessutom har marknaden drabbats av flera produktionsstörningar den senaste tiden (skogsbranden i Canada, attacker på pipelines i Nigerdeltat (vilket har pressat den nigerianska produktionen till den lägsta på decennier)) vilket hjälpt till att hålla efterfrågan uppe.
Vår rekommendation, BEAR OLJA X2 S, har inte utvecklats som tänkt varför vi stänger den (-7,9 %).
OBSERVATIONER
- Produktionen i Canada efter skogsbranden kommer så sakteliga tillbaka, men det kommer att ta ett tag att komma upp i full kapacitet igen.
- Nigeriansk produktion är ned efter attackerna i Nigerdeltat och evakueringarna av flera produktionsanläggningar.
- Risken för produktionsstörningar i Venezuela har ökat då risken för en statskollaps fortsätter att stiga.
- Saudiarabien, Bahrain och Oman nedgraderades i helgen av Moodys givet det låga oljepriset och därav stora budgetunderskott (vilket ju är incitament nog att hålla produktionen uppe).
- Goldman Sachs (som varit ultranegativa) nya högreoljeprisprognos (kort inte långsiktigt) gav marknaden en knuff norrut på måndagsmorgonen.
- Antalet riggar har fortsatt att falla och är nu nere på 318 stycken (när triggar oljeprisuppgången en vändning i riggmarknaden?).
- Den amerikanska och kinesiska produktion fortsätter att falla.
- Lagren är fortsatt mycket stora men föll oväntat förra veckan.
- Den långa spekulativa Brentpositioneringen har fallit för andra veckan på raken.
- Det historiska säsongsmönstret pekar mot en pristopp under vår – tidig sommar.
- Tekniskt bör man vara försiktig i kanaltoppen.
REKOMMENDATION
- BEAR OLJA X2 S
EL
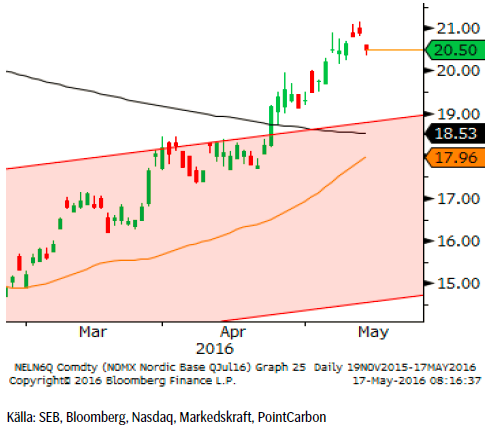 Elpriset är mer eller oförändrat sedan förra veckan dock med en viss svaghet i trenden vilket vi ser som en något förhöjd korrektionsrisk.
OBSERVATIONER
- Ringhals 2 har varit under renovering ett bra tag (förväntas åter i drift i mitten av september) däremot är nu också R1 ur drift för revision och beräknas åter vara i drift den 4:e juni.
- Oskarshamn 1, den beräknade återstarten (15 maj) har blivit försenad med cirka en vecka.
- Priset har mött ett sekundärt prismål, €20,66.
- Vattenmagasinen har nu troligtvis passerat sin lägstanivå för denna gång då vi sedan förra veckan sett en allt större tillrinning och en ökning av fyllnadsgraden från 33,8% till 35,40%.
- Underskottet i hydrobalansen förväntas fortsatt att öka något och Sverige står fortfarande för majoriteten av underskottet.
- Vi förväntar oss ett relativt torrt väder fram till början av nästa vecka så prognosen pekar mot ökad nederbörd.
- Temperaturen ligger för närvarande något under medelvärdet för tiden på året men förväntas dra sig upp mot normalt under prognosperioden.
- Väderprognosen betecknas som osäker.
- Prisnedgången på CO2 utsläppsrätter verkar ha bottnat och ett något högre pris bör kunna ses under kommande vecka.
- Kanaltaket och 233-dagars medelvärde det primära stödet vid en eventuell prisnedgång.
- Tekniskt så ser vi nu en viss svaghet i trenden varför en sättning ned mot €19 ser relativt trolig ut.
REKOMMENDATION
- Ingen rekommendation.
GULD
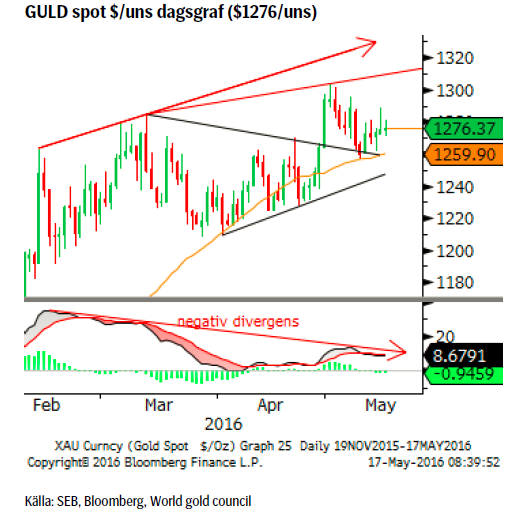 Trots den starkare dollarn, ökad riskaptit och en rekordlång marknad så vägrar korrektionen att infinna sig. Den långa positioneringen har fortsatt att växa, både i form av terminskontrakt och andelar i ETF:er, vilket fortfarande är en oroande faktor. Dock så pekar det mesta av det mer kortsiktiga beteendet mot att vi eventuellt bör räkna hem en ny topp i denna sekvens innan vinsthemtagningarna bör dyka upp.
OBSERVATIONER
- GULD/SILVER förhållandet har nu börjat rekylera högre vilket i det korta perspektivet gynnar guld på silvrets bekostnad.
• Dollarnedgången har ännu inte haft någon inverkan på guldpriset.
• Nya guldgruvor är på gång t.ex. El-Limon i Mexico som förväntas tillföra 369k uns/år när driften når full kapacitet.
• Flödet in i guldrelaterade aktier fortsätter (många prognoser är fortsatt positiva till guldet). Flödet i börshandlade fonder (ETF) var fortsatt positivt.
• Det höga spotpriset borde nu börja attrahera privatsäljande i länder som t.ex. Turkiet (guld i TRY-termer är ju mycket högt givet både guldprisets uppgång likväl som den turkiska lirans nedgång) (guld, framför allt smyckesköpandet förväntas också backa rejält i Arabstaterna i år).
• CoT (Commitment of Traders) rapporten visade att köparna även förra veckan fortsatte att addera till den redan långa positioneringen och den långa nettopositioneringen är nu den största sedan decennier tillbaka.
• Den långa CoT positioneringen är en växande riskfaktor.
• Tekniskt så noterar den fortsatt negativa divergensen dvs. högre toppar i pris, fallande toppar i MACD-indikatorn, men denna är ännu inte bekräftad.
REKOMMENDATION
- Ingen rekommendation.
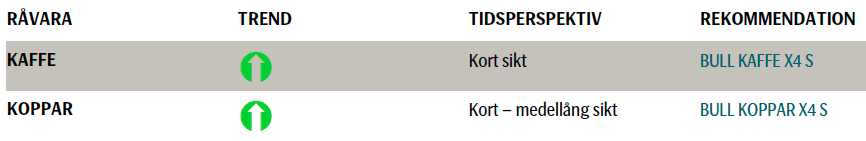
KAFFE
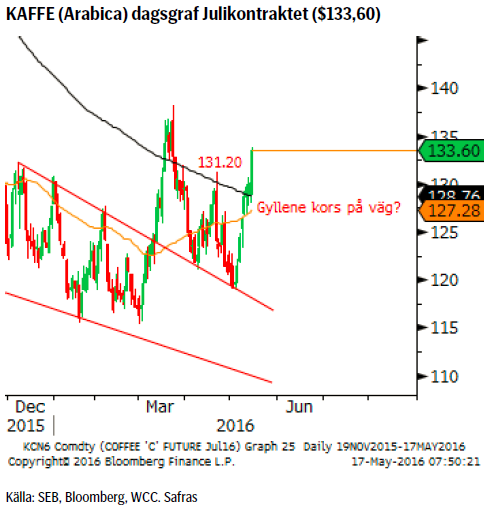 Två gånger har nu marknaden försökt pressa priset tillbaka in i den fallande kanalen och två gånger har säljarna förlorat slaget. Den kraftiga minskningen av korta positioner visar också med all tydlighet att man nu tappat tron på lägre priser. Historiskt så har denna typ av beteende en tendens att leda till en rörelse i motsatt riktning varför vi tar position för det. Vi köper därför BULL KAFFE X4 S med en stopp loss under 123 (och söker en fortsatt uppgång över 138,20).
OBSERVATIONER
- Prisuppgången (på både Arabica och Robusta) har båda stötts av den fortsatta torkan i Vietnam, vilken nu börjar påverka nästa säsongs skörd (buskarna kommer pga. årets torka inte att orka ge full skörd nästa säsong samt att en del av dem också dör).
- Dock har exporten hittills i år legat på rekordnivåer men det i huvudsak beroende på lager från förra säsongen.
- Skörden i Brasilien ligger några veckor före plan (9% inne per i fredags) även om sämre väder är att vänta närmaste veckan.
- På den negativa sidan får man väl sätta det faktum att åtminstone en del av den senaste uppgången bör hänföras till stängningar av korta terminspositioner (korta positioner minskade förra veckan tio gånger mer än långa). Nettopositioneringen ökade från 1,729 till 8,910 kontrakt.
- Tekniskt så ser nedgången från mars ut att vara en komplett sådan, brottet över 131,20 bekräftar också att så är fallet vilket ger ett nytt mål över 138,20.
REKOMMENDATION
- BULL KAFFE X4 S
KOPPAR
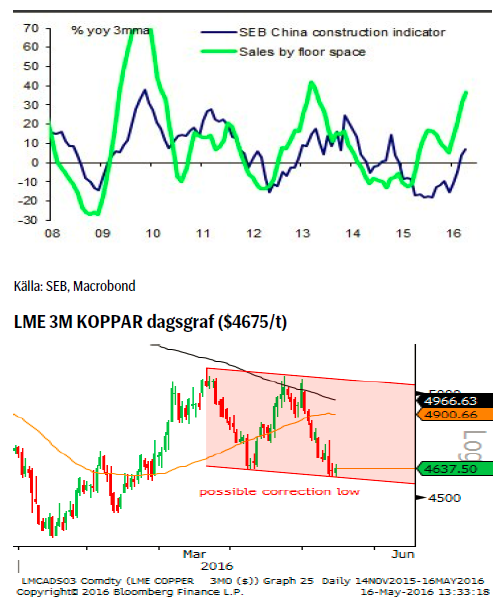 Vår BEAR KOPPAR X4 S rekommendation nådde förra veckan den rekommenderade vinsthemtagningsnivån, $4595/t, varför positionen nu är stängd (+29,58%). Eftersom det finns vissa indikationer på att en korrektionsbotten nåtts och att vi fått både ytterligare kinesiska stimulanser (360bio SEK i nya banklån) samt fortsatt styrka i kinesisk fastighetssektor under april gör vi ett försök att gå långa, dock med en mycket snäv stopp loss.
OBSERVATIONER
- De kinesiska åtgärderna (marginalkrav, prishöjningar m.m.) för att slå ned på vad man kallar ”överspekulation” verkar ha fått önskad effekt.
- Rio Tinto har efter viss vånda tagit ett beslut att investera $5,3mdr i en utbyggnad av Oyu Tolgoi-gruvan i Mongoliet. Beslutet visar på en förhoppning om en mer långsiktig uppgång av kopparpriset då produktionsökningen bör komma igång 2020.
- Lagren hos LME ökade förra veckan med 2,350/t (vilket till viss del antagligen beror på nedanstående).
- Arbitraget att köpa LME koppar och sälja den i Shanghai har fortsatt att minska och var i måndags nere på $50,5/t.
- Tekniskt så är bortstötningen från 233d mv en negativ signal (såsom det regelbundet varit de senaste åren). Dock finns det en möjlighet att vi nu gjort klart en korrektion på nedsidan och i sådant fall står vi inför ytterligare ett försök att komma över det långa medelvärdet.
- Kinesisk aprilstatistik visade på fortsatt styrka i fastighetssektorn vilket bör vara positivt för koppar.
REKOMMENDATION
- BULL KOPPAR X4 S (med stopp under $4585t).
USD/SEK
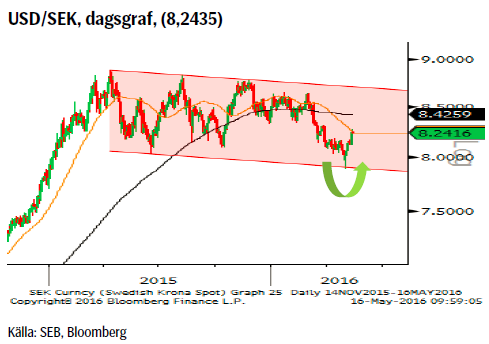 Efter en mindre korrektion fortsatte dollarn att förstärkas förra veckan (och kronan försvagas (mot de flesta valutor)) och har nu stigit cirka 35öre sedan botten. Nu när vi nått 55dagars medelvärdet så är det möjligt att en mindre paus kommer att tas innan vi fortsätter trenden mot högre höjder. Vi rekommenderar att ligga kvar i BULL USDSEK X4 S (den som inte redan är lång eller önskar öka på sin position ska utnyttja kortvariga prisnedgångar). På längre sikt så räknar vi med att den tidigare toppen vid 8,8850 passeras.
OBSERVATIONER
- Riksbanken fortsätter att varna för en ytterligare åtgärder (valutainterventioner?) om kronan förstärks för mycket för fort.
- Troligtvis en ökad ränteskillnad då FED förväntas fortsätta att höja sin styrränta långt tidigare än Riksbanken (som enligt SEB ska göra en första höjning (dvs. minska den negativa räntan) i februari 2017).
- I och med att ECB nu också köper företagsobligationer bör vi räkna med att allt fler utländska, framför allt amerikanska, företag nu bör emittera i euro för att på så sätt komma åt den extremt låga euroräntan. T.ex. så emitterade nyligen schweiziska Unilever en 4-åring till 0 % ränta. Utvecklingen bör hjälpa till att pressa ned euron (och upp dollarn).
- EUR/USD har också kommit under press då vi nu har flera uppseglande Europaproblem (migrationsavtalet mellan EU och Turkiet under press, ny oro i Grekland och den Brittiska folkomröstningen (Brexit).
- Förra veckan fortsatte dollarn att stiga vilket ökar på sannolikheten att föregående veckas studs verkligen var den korrektionsbotten vi tror den var.
- Mycket trolig dubbelbotten i KIX index (konjunkturinstitutets handelsvägda kronindex som används av Riksbanken) med kronan försvagad mot ett flertal valutor.
- Marknadens positionering i USD (CoT report) visar att den aggregerade långa nettopositionen fortsatte att krympa detta trots den möjliga vändningen.
REKOMMENDATION
- BULL USDSEK X4 S
AKTUELLA REKOMMENDATIONER
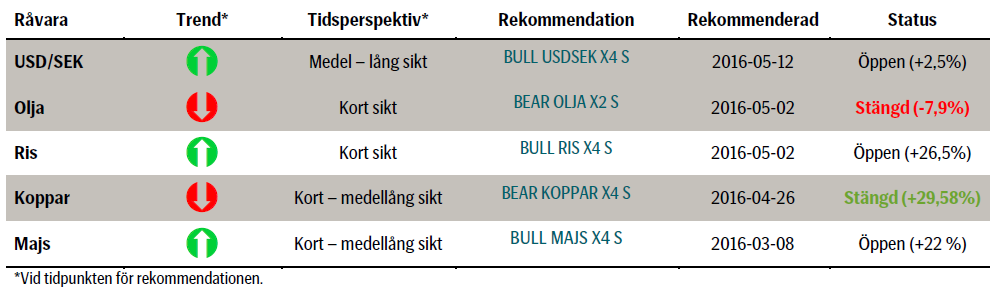
Koppar har sedan förra veckan handlats under $4595/t varför vår rekommenderade vinsthemtagning slagit till på $4595/t.
Majs WASDE rapporten visade stöd för vår långa majsrekommendation.
Ris hade inga problem att hålla sig kvar på positivt territorium. 12,37 torde härnäst utmanas. Vi siktar på att ta vinst vid 12,30.
[box]SEB Veckobrev Veckans råvarukommentar är producerat av SEB:s Commodities Sales desk och publiceras i samarbete och med tillstånd på Råvarumarknaden.se[/box]
KÄLLOR
Bloomberg, Reuters, SEB
VILLKOR
För varje enskilt certifikat/mini future finns Slutliga Villkor som anger de fullständiga villkoren. Slutliga Villkor finns tillgängligt på kurssidan för respektive certifikat/mini future på www.seb.se, Börs & finans, fliken Strukturerade placeringar.
RISKER
En sammanfattning av de risker som är förknippade med Börshandlade certifikat generellt finns i Produktbroschyren för respektive certifikat eller mini future som är tillgängligt på seb.se/cert respektive seb.se/mini. För en fullständig bild av riskerna behöver du ta del av SEB:s offentliggjorda Grundprospekt för Certifikat- och Warrantprogram som är publicerat på www.seb.se/cert respektive seb.se/mini.
DISCLAIMER
Detta marknadsföringsmaterial, framtaget av SEB:s Commodities Sales desk, har upprättats enbart i informationssyfte.
Även om innehållet är baserat på källor som SEB bedömt som tillförlitliga ansvarar SEB inte för fel eller brister i informationen. Den utgör inte oberoende, objektiv investeringsanalys och skyddas därför inte av de bestämmelser som SEB har infört för att förebygga potentiella intressekonflikter. Yttranden från SEB:s Commodities Sales desk kan vara oförenliga med tidigare publicerat material från SEB, då den senare hänvisas uppmanas du att läsa den fullständiga rapporten innan någon åtgärd vidtas.
Dokumentationen utgör inte någon investeringsrådgivning och tillhandahålls till dig utan hänsyn till dina investeringsmål. Du uppmanas att självständigt bedöma och komplettera uppgifterna i denna dokumentation och att basera dina investeringsbeslut på material som bedöms erforderligt. Alla framåtblickande uttalanden, åsikter och förväntningar är föremål för risker, osäkerheter och andra faktorer och kan orsaka att det faktiska resultatet avviker väsentligt från det förväntade. Historisk avkastning är ingen garanti för framtida resultat. Detta dokument utgör inte ett erbjudande att teckna några värdepapper eller andra finansiella instrument. SEB svarar inte för förlust eller skada – direkt eller indirekt, eller av vad slag det vara må – som kan uppkomma till följd av användandet av detta material eller dess innehåll.
Observera att det kan förekomma att SEB, dess ledamöter, dess anställda eller dess moder- och/eller dotterbolag vid olika tillfällen innehar, har innehaft eller kommer att inneha aktier, positioner, rådgivningsuppdrag i samband med corporate finance-transaktioner, investment- eller merchantbanking-uppdrag och/eller lån i de bolag/finansiella instrument som nämns i materialet.
Materialet är avsett för mottagaren, all spridning, distribuering mångfaldigande eller annan användning av detta meddelande får inte ske utan SEB:s medgivande. Materialet riktar sig inte till personer vars medverkan kräver ytterligare prospekt, registrerings- eller andra åtgärder än vad som följer av svensk rätt. Det åligger var och en att iaktta sådana restriktioner. Materialet får inte distribueras i eller till land där distribution kräver ovan nämnda åtgärder eller strider mot reglering i sådant land. Materialet riktar sig således inte till fysiska eller juridiska personer hemmahörande i USA eller i något annat land där publicering eller tillhandahållande av materialet är förbjudet eller strider mot tillämpliga bestämmelser i landet.
Oaktat detta får SEB tillåta omfördelning av materialet till utvald tredje part i enlighet med gällande avtal. Materialet får inte spridas till fysiska eller juridiska personer som är medborgare eller har hemvist i ett land där sådan spridning är otillåten enligt tillämplig lag eller annan bestämmelse.
Skandinaviska Enskilda Banken AB (publ) är ett publikt aktiebolag och står under tillsyn av Finansinspektionen samt de lokala finansiella tillsynsmyndigheter i varje jurisdiktionen där SEB har filial eller dotterbolag.

The latest weekly report from the US DOE showed a substantial drawdown across key petroleum categories, adding more upside potential to the fundamental picture.

Commercial crude inventories (excl. SPR) fell by 5.8 million barrels, bringing total inventories down to 415.1 million barrels. Now sitting 11% below the five-year seasonal norm and placed in the lowest 2015-2022 range (see picture below).
Product inventories also tightened further last week. Gasoline inventories declined by 2.1 million barrels, with reductions seen in both finished gasoline and blending components. Current gasoline levels are about 3% below the five-year average for this time of year.
Among products, the most notable move came in diesel, where inventories dropped by almost 4.1 million barrels, deepening the deficit to around 20% below seasonal norms – continuing to underscore the persistent supply tightness in diesel markets.
The only area of inventory growth was in propane/propylene, which posted a significant 5.1-million-barrel build and now stands 9% above the five-year average.
Total commercial petroleum inventories (crude plus refined products) declined by 4.2 million barrels on the week, reinforcing the overall tightening of US crude and products.


A classic case of “buy the rumor, sell the news” played out in oil markets, as Brent crude has dropped sharply – down nearly USD 10 per barrel since yesterday evening – following Iran’s retaliatory strike on a U.S. air base in Qatar. The immediate reaction was: “That was it?” The strike followed a carefully calibrated, non-escalatory playbook, avoiding direct threats to energy infrastructure or disruption of shipping through the Strait of Hormuz – thus calming worst-case fears.
After Monday morning’s sharp spike to USD 81.4 per barrel, triggered by the U.S. bombing of Iranian nuclear facilities, oil prices drifted sideways in anticipation of a potential Iranian response. That response came with advance warning and caused limited physical damage. Early this morning, both the U.S. President and Iranian state media announced a ceasefire, effectively placing a lid on the immediate conflict risk – at least for now.
As a result, Brent crude has now fallen by a total of USD 12 from Monday’s peak, currently trading around USD 69 per barrel.
Looking beyond geopolitics, the market will now shift its focus to the upcoming OPEC+ meeting in early July. Saudi Arabia’s decision to increase output earlier this year – despite falling prices – has drawn renewed attention considering recent developments. Some suggest this was a response to U.S. pressure to offset potential Iranian supply losses.
However, consensus is that the move was driven more by internal OPEC+ dynamics. After years of curbing production to support prices, Riyadh had grown frustrated with quota-busting by several members (notably Kazakhstan). With Saudi Arabia cutting up to 2 million barrels per day – roughly 2% of global supply – returns were diminishing, and the risk of losing market share was rising. The production increase is widely seen as an effort to reassert leadership and restore discipline within the group.
That said, the FT recently stated that, the Saudis remain wary of past missteps. In 2018, Riyadh ramped up output at Trump’s request ahead of Iran sanctions, only to see prices collapse when the U.S. granted broad waivers – triggering oversupply. Officials have reportedly made it clear they don’t intend to repeat that mistake.
The recent visit by President Trump to Saudi Arabia, which included agreements on AI, defense, and nuclear cooperation, suggests a broader strategic alignment. This has fueled speculation about a quiet “pump-for-politics” deal behind recent production moves.
Looking ahead, oil prices have now retraced the entire rally sparked by the June 13 Israel–Iran escalation. This retreat provides more political and policy space for both the U.S. and Saudi Arabia. Specifically, it makes it easier for Riyadh to scale back its three recent production hikes of 411,000 barrels each, potentially returning to more moderate increases of 137,000 barrels for August and September.
In short: with no major loss of Iranian supply to the market, OPEC+ – led by Saudi Arabia – no longer needs to compensate for a disruption that hasn’t materialized, especially not to please the U.S. at the cost of its own market strategy. As the Saudis themselves have signaled, they are unlikely to repeat previous mistakes.
Conclusion: With Brent now in the high USD 60s, buying oil looks fundamentally justified. The geopolitical premium has deflated, but tensions between Israel and Iran remain unresolved – and the risk of missteps and renewed escalation still lingers. In fact, even this morning, reports have emerged of renewed missile fire despite the declared “truce.” The path forward may be calmer – but it is far from stable.
Analys
A muted price reaction. Market looks relaxed, but it is still on edge waiting for what Iran will do
Brent crossed the 80-line this morning but quickly fell back assigning limited probability for Iran choosing to close the Strait of Hormuz. Brent traded in a range of USD 70.56 – 79.04/b last week as the market fluctuated between ”Iran wants a deal” and ”US is about to attack Iran”. At the end of the week though, Donald Trump managed to convince markets (and probably also Iran) that he would make a decision within two weeks. I.e. no imminent attack. Previously when when he has talked about ”making a decision within two weeks” he has often ended up doing nothing in the end. The oil market relaxed as a result and the week ended at USD 77.01/b which is just USD 6/b above the year to date average of USD 71/b.

Brent jumped to USD 81.4/b this morning, the highest since mid-January, but then quickly fell back to a current price of USD 78.2/b which is only up 1.5% versus the close on Friday. As such the market is pricing a fairly low probability that Iran will actually close the Strait of Hormuz. Probably because it will hurt Iranian oil exports as well as the global oil market.
It was however all smoke and mirrors. Deception. The US attacked Iran on Saturday. The attack involved 125 warplanes, submarines and surface warships and 14 bunker buster bombs were dropped on Iranian nuclear sites including Fordow, Natanz and Isfahan. In response the Iranian Parliament voted in support of closing the Strait of Hormuz where some 17 mb of crude and products is transported to the global market every day plus significant volumes of LNG. This is however merely an advise to the Supreme leader Ayatollah Ali Khamenei and the Supreme National Security Council which sits with the final and actual decision.
No supply of oil is lost yet. It is about the risk of Iran closing the Strait of Hormuz or not. So far not a single drop of oil supply has been lost to the global market. The price at the moment is all about the assessed risk of loss of supply. Will Iran choose to choke of the Strait of Hormuz or not? That is the big question. It would be painful for US consumers, for Donald Trump’s voter base, for the global economy but also for Iran and its population which relies on oil exports and income from selling oil out of that Strait as well. As such it is not a no-brainer choice for Iran to close the Strait for oil exports. And looking at the il price this morning it is clear that the oil market doesn’t assign a very high probability of it happening. It is however probably well within the capability of Iran to close the Strait off with rockets, mines, air-drones and possibly sea-drones. Just look at how Ukraine has been able to control and damage the Russian Black Sea fleet.
What to do about the highly enriched uranium which has gone missing? While the US and Israel can celebrate their destruction of Iranian nuclear facilities they are also scratching their heads over what to do with the lost Iranian nuclear material. Iran had 408 kg of highly enriched uranium (IAEA). Almost weapons grade. Enough for some 10 nuclear warheads. It seems to have been transported out of Fordow before the attack this weekend.
The market is still on edge. USD 80-something/b seems sensible while we wait. The oil market reaction to this weekend’s events is very muted so far. The market is still on edge awaiting what Iran will do. Because Iran will do something. But what and when? An oil price of 80-something seems like a sensible level until something do happen.


Tightening fundamentals – bullish inventories from DOE

Jonas Lindvall är tillbaka med ett nytt oljebolag, Perthro, som ska börsnoteras

Oljan, guldet och marknadens oroande tystnad

Domstolen ger klartecken till Lappland Guldprospektering
Bombs to ”ceasefire” in hours – Brent below $70

Stor uppsida i Lappland Guldprospekterings aktie enligt analys

Brookfield ska bygga ett AI-datacenter på hela 750 MW i Strängnäs

Sommaren inleds med sol och varierande elpriser

OPEC+ ökar oljeproduktionen trots fallande priser

Silverpriset släpar efter guldets utveckling, har mer uppsida
-
 Nyheter3 veckor sedan
Stor uppsida i Lappland Guldprospekterings aktie enligt analys
-
 Nyheter4 veckor sedan
Brookfield ska bygga ett AI-datacenter på hela 750 MW i Strängnäs
-
 Nyheter4 veckor sedan
Sommaren inleds med sol och varierande elpriser
-
 Nyheter4 veckor sedan
OPEC+ ökar oljeproduktionen trots fallande priser
-
 Nyheter3 veckor sedan
Silverpriset släpar efter guldets utveckling, har mer uppsida
-
Analys4 veckor sedan
Brent needs to fall to USD 58/b to make cheating unprofitable for Kazakhstan
-

 Nyheter4 veckor sedan
Tradingfirman XTX Markets bygger datacenter i finska Kajana för 1 miljard euro
-

 Nyheter2 veckor sedan
Uppgången i oljepriset planade ut under helgen