

Analys
SEB Råvarubrev 13 oktober 2015

Klockorna klämta, men ingen på fundamenta vill vänta
 MARKNADEN I KORTHET
Förra veckan uppvisade råvarumarknaden generellt sett kraftiga uppgångar i priser och energisektorn var den del som stärktes mest. Flertalet aktiemarknader stängde också på plus och det allmänna sentimentet var positivt. Sannolikt tog uppgångarna sitt avstamp i sysselsättningsstatistiken från USA som kom den andra oktober och var betydligt sämre än vad man hade förväntat. Som vi konstaterade förra veckan ansåg marknaden att detta var positivt då en räntehöjning i USA nu är än mer avlägsen i tid. Med intresse för nationalekonomi är det svårt att inte stanna upp och reflektera över detta: Var fundamental efterfrågan och tillväxt skall komma från diskuteras tydligen på helt andra avdelningar hos investerarna än där de som trycker på knapparna arbetar. Kinas totala tillväxt bygger redan till större delen och kommer i än större utsträckning bygga på tillväxt i service- istället för industrisektorn och det är svårt att se hur en hårklippning i Kina direkt bidrar till tillväxt i Europa, där många redan lever av att göra fina frisyrer på varandra. Men visst, det skall sägas att många tjänster förstås går att exportera.
Av rutin ser man oftast på USA och Kina när det gäller att uppskatta efterfrågan på råvaror, men Europas totala ekonomi är nästan exakt lika stor, mätt i total (nominell) BNP som USA:s. I det senare landet avstår man tydligen från att höja räntan av rädsla för att störa en skör tillväxt, medan man med ljus och lykta letar efter den i Europa. Man skall dock inte bli för negativ och ett rally som det vi bevittnade under förra veckan säger inte alltför mycket om den längre utvecklingen, men det är ibland viktigt att lyfta blicken ytterligare. Tursamt nog fokuserar vi här på just råvaror och om en typ av dessa, exempelvis sådana som bygger upp ett samhälle – järnmalm, cement – drabbas av lägre efterfrågan, så ökar den för andra – exempelvis aluminium, palladium och platina – i takt med att samhället utvecklas. Efter Kina kommer så andra länder följa som skall göra samma resa. En sak är i alla fall säker – för oss som är intresserade av råvaror och placeringar kommer de intressanta tillfällena bara bli fler!
Nå, låt oss diskutera de händelser som vi har sett i närtid: Oljepriset tog förra veckan ett rejält kliv uppåt, men vände i gårdagens handel ånyo nedåt och har idag fortsatt ned. Sannolikt var den största delen av rörelserna åt båda håll flödesbaserad snarare än en reaktion på enskilda nyheter, även om försvagningen av US-dollarn, lägre amerikansk oljeproduktion och oro i Mellanöstern hjälpte till att ge stöd uppåt. Det är möjligt att det finns utrymme för ytterligare uppsida, men vi har svårt att tro att priset under längre perioder kommer handla högre.
Basmetaller fick också en rejäl skjuts uppåt i fredags efter en vecka av i huvudsak sidledes handel. Det var Glencore som i ett led att ge priset stöd meddelade att man sänker produktionen av zink med 500 000 ton per år, vilket motsvarar 4 procent av global produktion. Då US-dollarn hade försvagats under veckan utan att metallerna egentligen hade reagerat på det blev det som att dra ur proppen och zinken stängde veckan 9 procent högre, följt av bly och platina med cirka 8 procent. Samtliga basmetaller stängde veckan starkt uppåt.
Jordbruksprodukter hade en mer blandad vecka där kaffe och speciellt socker stärktes av både fundamentala och tekniska faktorer. Det senare stängde veckan upp 6 procent. I fredags kom den månatliga utbuds- och efterfrågerapporten (WASDE) från det amerikanska jordbruksdepartementet, som visade att global produktion av vete når en ny rekordnivå, majsproduktionen slog estimaten medan en betydligt mindre produktion av sojabönor i USA, där en högre avkastning endast delvis kompenserar en minskad skördad areal, överraskade stort.
TRENDER I SAMMANDRAG
- Brentoljan har handlats upp och fallit tillbaka sedan förra veckan, mycket pga flöden
- Som reaktion på produktionsneddragningar av zink och svagare US-dollar har basmetaller stärkts kraftigt
- Jordbruksprodukter hade en blandad vecka; mycket på grund av WASDE-rapporten
VECKANS REKOMMENDATIONER
En placering i certifikat och warranter är förknippat med risker. Du kan förlora hela ditt investerade kapital. Läs mer om riskerna i SEB:s offentliggjorda Grundprospekt för certifikat- och warrantprogram på seb.se/cert eller seb.se/mini.
OLJA
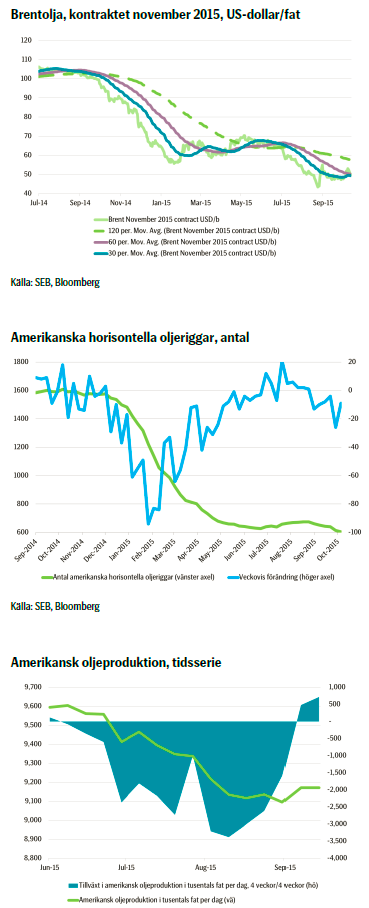 Förra veckan konstaterade vi att oljepriset under en längre period har rört sig kring nivån 48 US-dollar per fat och lagom till att vi skickade ut vårt Råvarubrev började förstås marknaden frångå det magiska talet 48 US-dollar per fat och söka högre nivåer. Det var egentligen ingen enskild fundamental faktor som började driva priset högre, utan snarare att investerare ville testa högre nivåer och såg möjlighet till det. När tillräckligt stort tryck uppstod i kombination med en del fundamentala faktorer, såsom tilltagande oro i Mellanöstern och en US-dollar som hade rört sig svagare utan att egentligen dittills ha haft någon påverkan på oljepriset, så började det pressas uppåt. En hel del investerare kom in i marknaden och hängde på utvecklingen uppåt, vilket förstås drev på den ytterligare. Från sin lägsta till sin högsta nivå förra veckan rörde sig priset 13 procent, vilket onekligen är en hel del.
Igår måndag började dock priset på Brentolja röra sig tillbaka och även denna gång var det, som vi ser det, egentligen utan stöd av några specifika nyheter. Snarare hade oljan stöd av att OPEC i sin rapport konstaterade att det låga oljepriset kommer att slå mot producenter som är icke-OPEC, vilka kommer att producera mindre. Sannolikt var rörelsen nedåt i pris beroende av flöden och stop/loss-ordrar som började gå. Intradag rörde sig priset på Brentolja som mest över 6 procent.
Vad är det då marknadenjust nu diskuterar? Råvaror generellt och så även oljan har reagerat positivt på den senaste tidens ökade riskaptit som egentligen började med att Fed avstod från att höja räntan och att arbetsmarknadsstatistik från USA var betydligt sämre än förväntad. Detta drev ytterligare ned förväntningarna på en räntehöjning. Vidare är den lägre produktionen av olja i USA en viktig faktor och den har accelererat nedåt. Samtidigt faller totala antalet rena oljeriggar i USA och de är nu 605 till antalet enligt Baker Hughes veckosurvey – det lägsta antalet sedan 2010.
Dock skall man minnas att riggar och borrar blir allt mer effektiva och en oljerigg idag pumpar upp bra mycket mer olja än vad motsvarande rigg gjorde bara för något år sedan. Vi ser fortsatt att globala oljelager kommer växa och att marknaden kommer producera ett överskott av olja även under 2016. Det är möjligt att det finns ett visst finns utrymme i närtid för ett högre oljepris, men ur ett något längre perspektiv tror vi inte att priset uthålligt kan stanna på alltför höga nivåer. Skulle Fed dessutom faktiskt höja räntan redan i december lär det snabbt lägga sordin på marknaden. Igår måndag kom OPEC-data som sade att produktionen hade nått treårshögsta, men samtidigt hade efterfrågan globalt ökat.
Hur som helst håller marknaden tydligt på att ombalanseras. De neddragningar i investeringar som vi har sett senaste tiden kommer eventuellt börja få genomslag här och var i produktionen redan under 2016. Det krävs dock att produktionen hamnar i underskott så att lagren börjar sjunka för att marknaden verkligen skall hamna i balans. För att produktionen ännu längre fram inte skall öka för snabbt krävs det dock att oljepriset under tiden är så pass lågt att nya investeringar ändå inte tar fart.
TREND
- Oljepriset reagerat kraftigt positivt på ökad riskaptit
- Fundamentala faktorer såsom tilltagande oro i Mellanöstern, svagare US-dollar samt minskande amerikansk oljeproduktion har också gett stöd
- Vi tror att oljepriset kortsiktigt kan ha viss uppsida, men sannolikt kommer få svårt att stanna på högre nivåer
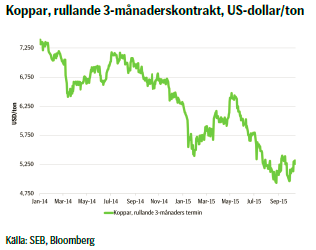
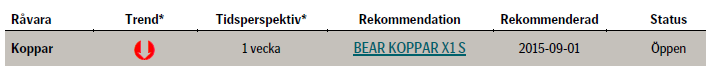
KOPPAR
 Veckan som har gick präglades av slagig och litet avvaktande handel inför LME-veckan i London. Det är London Metal Exchange som denna vecka anordnar en konferens för branschfolk och kort sagt är representanter från samtliga marknadsaktörer där.
I fredags kom omskakande nyheter, vilket även om det primärt berör zinken definitivt har bäring på kopparpriset: Sista handelsdagen innan LME-veckan annonserar Glencore att man ämnar dra ner på produktionen av zink med 500 000 ton per år, med en minskning om 100 000 ton redan i fjärde kvartalet i år. Den totala minskningen i årsproduktion motsvarar ungefär 4 procent av den globala produktionen, vilket definitivt är signifikant. I måndags annonserade man därtill att man kommer att försöka sälja två koppargruvor, men genom att en köpare knappast omgående kommer lägga ned produktionen är det snarast negativt för priset.
Senaste veckorna har US-dollarn försvagats en del men priset på basmetaller verkade inte riktig ha reagerat på detta. I fredags blev effekten av att Glencore annonserade sin neddragning av zinkproduktionen därför som att dra ur proppen för basmetallerna: Samtliga metaller sköt plötsligt kraftigt uppåt och stängde veckan klart högre.
Vi tror dock att effekten är överdriven: Med största sannolikhet kommer priset att rekylera nedåt och även om vi kanske ser nya stödnivåer, åtminstone för zinkpriset, så lär vi se rörelser nedåt. Kanske inte under nästa vecka då investerare sannolikt kommer att påverkas av vad som sägs i London – dessutom kommer handeln på grund av att så många är där vara relativt slagig – men sannolikt efteråt. Vi tror fortfarande att priset på koppar skall ned och nu gäller det att ha is i magen. Vår bear-rekommendation initierades med facit i hand för tidigt, men vi ligger kvar i den och väntar in lägre nivåer. För den som är snabb i vändningarna kan en god strategi vara att köpa bear-certifikat på koppar med högre hävstång när rekylen nedåt kommer.
TREND
- Kopparpriset reagerade kraftigt positivt på Glencores annonserade produktionsneddragning i zink
- En svagare US-dollar hjälpte till att skjuta priset högre, liksom att investerare täckte korta positioner
- Vi tror att kopparen kommer att handla slagigt närmaste veckan, men risken efter förra veckans uppställ är på nedsidan – åtminstone efter LME-veckan.
REKOMMENDATION
- BEAR KOPPAR X1 S – men var beredd på volatil handel
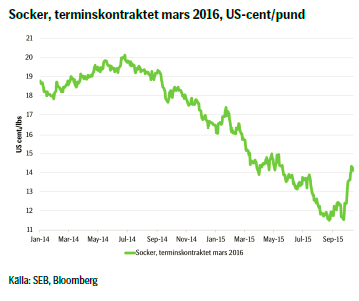
SOCKER
 Man slutar faktiskt aldrig fascineras av marknaden för de råvaror som kallas ”softs”, till vilka socker och kaffe hör. Nyhetsflödet kring dessa två handlar ofta om väder – förstås – men lika mycket om makroförhållandena i de länder som är stora exportörer. Exempelvis kan kaffe- och sockerpriset röra sig lika mycket som den brasilianska realen, om Brasilien väljer att vidta någon makrorelaterad åtgärd. Det händer också att rapporter når marknaden och resulterar i att den tar en riktning, för att senare mötas av diametralt andra fakta.
Förra veckan kom också rapporter om att sockerproduktionen inte mötte efterfrågan och trots stora globala lager skulle världen sannolikt snart se ett underskott. Efter en sanslös uppgång med i skrivande stund 24 procent på drygt två veckor kan man börja fundera på om marknaden har reagerat för kraftigt. En stor del av uppgången beror förstås på att den brasilianska realen har stärkts, men då snarast som del av en generell uppgång i råvaror som har stärkt flera tillväxtekonomiers valutor, samt att US-dollarn i sig har försvagats relativt realen. En stor del av uppgången i sockerpriset beror också säkerligen på att investerare har täckt sina korta positioner. Fler placerare är nu långa i socker.
Tekniskt ur ett längre perspektiv ser vi att den brasilianska realen sannolikt kommer att fortsätta försvagas vilket mekaniskt skulle driva sockerpriset lägre. Samtidigt säger de tekniska signalerna om sockerpriset att det vi nu ser kan vara ett trendbrott. Det är ett extremt kraftigt momentum uppåt och skulle priset falla är stödet vid 13,5 US-cent per pund. Frågan är om det sedan skall vidare uppåt eller ner igen? Det tekniska och det fundamentala perspektivet säger litet olika saker, men att då ta en position mot det momentum vi ser kanske är lite väl magstarkt.
Förra veckan resonerade vi kring att ta en bull-position och gläder oss åt att vi gjorde så. Frågan är alltid när positionen skall stängas men vi tror att det är läge att göra det nu. Når priset stödet 13,5 US-cent per pund utvärderar vi i så fall situationen igen och ser om det är läge att återigen gå lång. Fortsätter priset nu uppåt får vi ändå vara nöjda!
TREND
- Kraftig prisrörelse uppåt i sockerpriset
- Tekniskt ser vi att det kan vara ett trendbrott
- Vi stänger vår bear-position och bevakar utvecklingen.
KAFFE
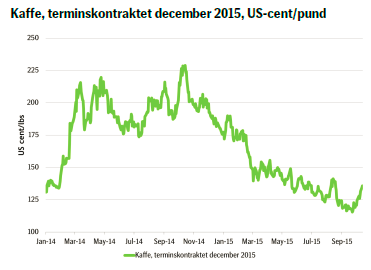 Med tydlig referens till resonemangen i stycket kring socker ser vi att även kaffepriset har drivits högre. Utveckligen är inte lika kraftig som för sockret, men fortfarande mycket tydlig. Placerare ligger totalt nu något mer långa än korta men fundamentalt finns några faktorer värda att uppmärksamma, förutom vad som redan är redogjort för i stycket om socker: När den norra hemisfären går in i vintern ökar generellt sett efterfrågan på kaffe, vädret har varit ogynnsamt i Brasilien, men även tekniskt ser man ser ett starkt momentum mot högre priser. Köparna har definitivt vunnit de senaste dagarna och grafstrukturen, i termer av hur handeln och nivåer under dagen har varit, pekar uppåt.
Kaffepriset har gått igenom sina både 50 och 100 dagar långa glidande medelvärden och frågan är hur långt det nu kan gå. Tekniskt ser det ut som om nästa motstånd är just uppåt det 200 dagar långa glidande medelvärdet, vilket är kring ca 143 US-cent per pund. Där någonstans får man värdera situationen på nytt och se om man har anledning att gå kort mot marknaden, eller om man vill gå lång igen men kanske på lägre nivåer. Med osäkerheten kring den brasilianska realen i bakhuvudet har vi is i magen och betraktar utvecklingen på marknaden de närmaste dagarna. Om priset nu snart börjar vända nedåt är det nog en god idé att stänga den långa position som man eventuellt öppnade förra veckan.
TREND
- Kaffepriset har påverkats kraftigt av den allmänna uppgången i råvaror senaste tiden
- En starkare brasiliansk real och sämre väder i landet har gett priset kraftigt stöd
- Tekniskt tror vi att det finns uppsida kvar i priset, men långa investerare bör hålla mer än ett öga på kursen. Nästa motstånd är vid 143 US-cent per pund.
El
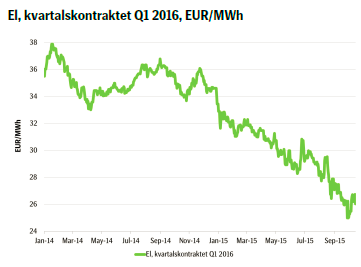 Elpriset såg ett uppställ förra veckan på basis av en torrare och kallare väderrapport och det är vad som i vårt tycke fortsatt har störst påverkan på priset. Vi ser att fundamentala faktorer i stort fortsätter sidledes: Kolpriset har rört sig något uppåt och priset utsläppsrätter likaså något upp, men egentligen inte tillräckligt för att ändra den större bilden.
Ur ett längre perspektiv ser vi egentligen mer av samma, vilket vi har konstaterat flera gånger tidigare, men då den hydrologiska balansen har krupit nedåt och inom innevarande prognosperiod spås gå ned ytterligare från dagens överskott till nästan ingen avvikelse alls från den normala nivån, tror vi att det faktiskt finns en risk för vidare uppsida i elpriset.
En intressant observation är att reservoarnivåerna trots den relativt blöta sommaren inte är på extrema nivåer och att man faktiskt kan hamna i underskott mot den normala nivån bara inom loppet av bara några veckor. En slutsats som är enkel att dra är att producenterna tydligen har producerat mycket under året, det vill säga släppt på mycket vatten, för att inte hamna i en situation med enorma magasin. Man skulle i så fall i perioden med säsongsmässigt högre efterfrågan skjuta sig i foten genom att först då börja göra sig av med vattnet och på så vis automatiskt sänka priserna. Det säger någonting om producenternas rädsla för lägre priser än dagens nivåer.
Vi närmar oss det 50 dagar långa glidande medelvärdet på priset, vilket förstås är något slags motstånd och skulle vi inom den närmaste tiden få se ytterligare kallare och torrare väder så skulle vi mycket väl kunna se priser som skjuter iväg ännu högre. Ser man utvecklingen ur det litet längre perspektivet så har spotpriset gjort en ganska bra resa uppåt under de senaste veckorna.
Vi avvaktar att ta en position för ett högre elpris men bevakar noga marknadens rörelser!
TREND
- Fundamentala faktorer fortsatt i stort sidledes
- Vädret avgjort viktigaste faktorn för elpriset närmaste tiden
- Vi tror att det kan finnas en uppsida i elpriset; främst om vädret skulle bli än kallare och torrare framöver.
AKTUELLA REKOMMENDATIONER
[box]SEB Veckobrev Veckans råvarukommentar är producerat av SEB:s Commodities Sales desk och publiceras i samarbete och med tillstånd på Råvarumarknaden.se[/box]
KÄLLOR
Bloomberg, Reuters, SEB
VILLKOR
För varje enskilt certifikat/mini future finns Slutliga Villkor som anger de fullständiga villkoren. Slutliga Villkor finns tillgängligt på kurssidan för respektive certifikat/mini future på www.seb.se, Börs & finans, fliken Strukturerade placeringar.
RISKER
En sammanfattning av de risker som är förknippade med Börshandlade certifikat generellt finns i Produktbroschyren för respektive certifikat eller mini future som är tillgängligt på seb.se/cert respektive seb.se/mini. För en fullständig bild av riskerna behöver du ta del av SEB:s offentliggjorda Grundprospekt för Certifikat- och Warrantprogram som är publicerat på www.seb.se/cert respektive seb.se/mini.
DISCLAIMER
Detta marknadsföringsmaterial, framtaget av SEB:s Commodities Sales desk, har upprättats enbart i informationssyfte.
Även om innehållet är baserat på källor som SEB bedömt som tillförlitliga ansvarar SEB inte för fel eller brister i informationen. Den utgör inte oberoende, objektiv investeringsanalys och skyddas därför inte av de bestämmelser som SEB har infört för att förebygga potentiella intressekonflikter. Yttranden från SEB:s Commodities Sales desk kan vara oförenliga med tidigare publicerat material från SEB, då den senare hänvisas uppmanas du att läsa den fullständiga rapporten innan någon åtgärd vidtas.
Dokumentationen utgör inte någon investeringsrådgivning och tillhandahålls till dig utan hänsyn till dina investeringsmål. Du uppmanas att självständigt bedöma och komplettera uppgifterna i denna dokumentation och att basera dina investeringsbeslut på material som bedöms erforderligt. Alla framåtblickande uttalanden, åsikter och förväntningar är föremål för risker, osäkerheter och andra faktorer och kan orsaka att det faktiska resultatet avviker väsentligt från det förväntade. Historisk avkastning är ingen garanti för framtida resultat. Detta dokument utgör inte ett erbjudande att teckna några värdepapper eller andra finansiella instrument. SEB svarar inte för förlust eller skada – direkt eller indirekt, eller av vad slag det vara må – som kan uppkomma till följd av användandet av detta material eller dess innehåll.
Observera att det kan förekomma att SEB, dess ledamöter, dess anställda eller dess moder- och/eller dotterbolag vid olika tillfällen innehar, har innehaft eller kommer att inneha aktier, positioner, rådgivningsuppdrag i samband med corporate finance-transaktioner, investment- eller merchantbanking-uppdrag och/eller lån i de bolag/finansiella instrument som nämns i materialet.
Materialet är avsett för mottagaren, all spridning, distribuering mångfaldigande eller annan användning av detta meddelande får inte ske utan SEB:s medgivande. Materialet riktar sig inte till personer vars medverkan kräver ytterligare prospekt, registrerings- eller andra åtgärder än vad som följer av svensk rätt. Det åligger var och en att iaktta sådana restriktioner. Materialet får inte distribueras i eller till land där distribution kräver ovan nämnda åtgärder eller strider mot reglering i sådant land. Materialet riktar sig således inte till fysiska eller juridiska personer hemmahörande i USA eller i något annat land där publicering eller tillhandahållande av materialet är förbjudet eller strider mot tillämpliga bestämmelser i landet.
Oaktat detta får SEB tillåta omfördelning av materialet till utvald tredje part i enlighet med gällande avtal. Materialet får inte spridas till fysiska eller juridiska personer som är medborgare eller har hemvist i ett land där sådan spridning är otillåten enligt tillämplig lag eller annan bestämmelse.
Skandinaviska Enskilda Banken AB (publ) är ett publikt aktiebolag och står under tillsyn av Finansinspektionen samt de lokala finansiella tillsynsmyndigheter i varje jurisdiktionen där SEB har filial eller dotterbolag.

The latest weekly report from the US DOE showed a substantial drawdown across key petroleum categories, adding more upside potential to the fundamental picture.

Commercial crude inventories (excl. SPR) fell by 5.8 million barrels, bringing total inventories down to 415.1 million barrels. Now sitting 11% below the five-year seasonal norm and placed in the lowest 2015-2022 range (see picture below).
Product inventories also tightened further last week. Gasoline inventories declined by 2.1 million barrels, with reductions seen in both finished gasoline and blending components. Current gasoline levels are about 3% below the five-year average for this time of year.
Among products, the most notable move came in diesel, where inventories dropped by almost 4.1 million barrels, deepening the deficit to around 20% below seasonal norms – continuing to underscore the persistent supply tightness in diesel markets.
The only area of inventory growth was in propane/propylene, which posted a significant 5.1-million-barrel build and now stands 9% above the five-year average.
Total commercial petroleum inventories (crude plus refined products) declined by 4.2 million barrels on the week, reinforcing the overall tightening of US crude and products.


A classic case of “buy the rumor, sell the news” played out in oil markets, as Brent crude has dropped sharply – down nearly USD 10 per barrel since yesterday evening – following Iran’s retaliatory strike on a U.S. air base in Qatar. The immediate reaction was: “That was it?” The strike followed a carefully calibrated, non-escalatory playbook, avoiding direct threats to energy infrastructure or disruption of shipping through the Strait of Hormuz – thus calming worst-case fears.
After Monday morning’s sharp spike to USD 81.4 per barrel, triggered by the U.S. bombing of Iranian nuclear facilities, oil prices drifted sideways in anticipation of a potential Iranian response. That response came with advance warning and caused limited physical damage. Early this morning, both the U.S. President and Iranian state media announced a ceasefire, effectively placing a lid on the immediate conflict risk – at least for now.
As a result, Brent crude has now fallen by a total of USD 12 from Monday’s peak, currently trading around USD 69 per barrel.
Looking beyond geopolitics, the market will now shift its focus to the upcoming OPEC+ meeting in early July. Saudi Arabia’s decision to increase output earlier this year – despite falling prices – has drawn renewed attention considering recent developments. Some suggest this was a response to U.S. pressure to offset potential Iranian supply losses.
However, consensus is that the move was driven more by internal OPEC+ dynamics. After years of curbing production to support prices, Riyadh had grown frustrated with quota-busting by several members (notably Kazakhstan). With Saudi Arabia cutting up to 2 million barrels per day – roughly 2% of global supply – returns were diminishing, and the risk of losing market share was rising. The production increase is widely seen as an effort to reassert leadership and restore discipline within the group.
That said, the FT recently stated that, the Saudis remain wary of past missteps. In 2018, Riyadh ramped up output at Trump’s request ahead of Iran sanctions, only to see prices collapse when the U.S. granted broad waivers – triggering oversupply. Officials have reportedly made it clear they don’t intend to repeat that mistake.
The recent visit by President Trump to Saudi Arabia, which included agreements on AI, defense, and nuclear cooperation, suggests a broader strategic alignment. This has fueled speculation about a quiet “pump-for-politics” deal behind recent production moves.
Looking ahead, oil prices have now retraced the entire rally sparked by the June 13 Israel–Iran escalation. This retreat provides more political and policy space for both the U.S. and Saudi Arabia. Specifically, it makes it easier for Riyadh to scale back its three recent production hikes of 411,000 barrels each, potentially returning to more moderate increases of 137,000 barrels for August and September.
In short: with no major loss of Iranian supply to the market, OPEC+ – led by Saudi Arabia – no longer needs to compensate for a disruption that hasn’t materialized, especially not to please the U.S. at the cost of its own market strategy. As the Saudis themselves have signaled, they are unlikely to repeat previous mistakes.
Conclusion: With Brent now in the high USD 60s, buying oil looks fundamentally justified. The geopolitical premium has deflated, but tensions between Israel and Iran remain unresolved – and the risk of missteps and renewed escalation still lingers. In fact, even this morning, reports have emerged of renewed missile fire despite the declared “truce.” The path forward may be calmer – but it is far from stable.
Analys
A muted price reaction. Market looks relaxed, but it is still on edge waiting for what Iran will do
Brent crossed the 80-line this morning but quickly fell back assigning limited probability for Iran choosing to close the Strait of Hormuz. Brent traded in a range of USD 70.56 – 79.04/b last week as the market fluctuated between ”Iran wants a deal” and ”US is about to attack Iran”. At the end of the week though, Donald Trump managed to convince markets (and probably also Iran) that he would make a decision within two weeks. I.e. no imminent attack. Previously when when he has talked about ”making a decision within two weeks” he has often ended up doing nothing in the end. The oil market relaxed as a result and the week ended at USD 77.01/b which is just USD 6/b above the year to date average of USD 71/b.

Brent jumped to USD 81.4/b this morning, the highest since mid-January, but then quickly fell back to a current price of USD 78.2/b which is only up 1.5% versus the close on Friday. As such the market is pricing a fairly low probability that Iran will actually close the Strait of Hormuz. Probably because it will hurt Iranian oil exports as well as the global oil market.
It was however all smoke and mirrors. Deception. The US attacked Iran on Saturday. The attack involved 125 warplanes, submarines and surface warships and 14 bunker buster bombs were dropped on Iranian nuclear sites including Fordow, Natanz and Isfahan. In response the Iranian Parliament voted in support of closing the Strait of Hormuz where some 17 mb of crude and products is transported to the global market every day plus significant volumes of LNG. This is however merely an advise to the Supreme leader Ayatollah Ali Khamenei and the Supreme National Security Council which sits with the final and actual decision.
No supply of oil is lost yet. It is about the risk of Iran closing the Strait of Hormuz or not. So far not a single drop of oil supply has been lost to the global market. The price at the moment is all about the assessed risk of loss of supply. Will Iran choose to choke of the Strait of Hormuz or not? That is the big question. It would be painful for US consumers, for Donald Trump’s voter base, for the global economy but also for Iran and its population which relies on oil exports and income from selling oil out of that Strait as well. As such it is not a no-brainer choice for Iran to close the Strait for oil exports. And looking at the il price this morning it is clear that the oil market doesn’t assign a very high probability of it happening. It is however probably well within the capability of Iran to close the Strait off with rockets, mines, air-drones and possibly sea-drones. Just look at how Ukraine has been able to control and damage the Russian Black Sea fleet.
What to do about the highly enriched uranium which has gone missing? While the US and Israel can celebrate their destruction of Iranian nuclear facilities they are also scratching their heads over what to do with the lost Iranian nuclear material. Iran had 408 kg of highly enriched uranium (IAEA). Almost weapons grade. Enough for some 10 nuclear warheads. It seems to have been transported out of Fordow before the attack this weekend.
The market is still on edge. USD 80-something/b seems sensible while we wait. The oil market reaction to this weekend’s events is very muted so far. The market is still on edge awaiting what Iran will do. Because Iran will do something. But what and when? An oil price of 80-something seems like a sensible level until something do happen.


USA ska införa 50 procent tull på koppar

Ryska staten siktar på att konfiskera en av landets största guldproducenter

Hur säkrar vi Sveriges tillgång till kritiska metaller och mineral i en ny geopolitisk verklighet?

Lundin Mining ska bli en av de tio största kopparproducenterna i världen

Sommarvädret styr elpriset i Sverige

Uppgången i oljepriset planade ut under helgen

Mahvie Minerals växlar spår – satsar fullt ut på guld

Låga elpriser i sommar – men mellersta Sverige får en ökning

Oljan, guldet och marknadens oroande tystnad
Very relaxed at USD 75/b. Risk barometer will likely fluctuate to higher levels with Brent into the 80ies or higher coming 2-3 weeks
-
 Nyheter4 veckor sedan
Uppgången i oljepriset planade ut under helgen
-
 Nyheter3 veckor sedan
Mahvie Minerals växlar spår – satsar fullt ut på guld
-
 Nyheter4 veckor sedan
Låga elpriser i sommar – men mellersta Sverige får en ökning
-
 Nyheter2 veckor sedan
Oljan, guldet och marknadens oroande tystnad
-
Analys4 veckor sedan
Very relaxed at USD 75/b. Risk barometer will likely fluctuate to higher levels with Brent into the 80ies or higher coming 2-3 weeks
-

 Nyheter2 veckor sedan
Jonas Lindvall är tillbaka med ett nytt oljebolag, Perthro, som ska börsnoteras
-
Analys3 veckor sedan
A muted price reaction. Market looks relaxed, but it is still on edge waiting for what Iran will do
-

 Nyheter2 veckor sedan
Domstolen ger klartecken till Lappland Guldprospektering