

Analys
SEB Råvarubrev 12 april 2016

 Risk för oljevolatilitet!
MARKNADEN I KORTHET
En relativt mixad vecka med uppgång i oljepriset men nedgång i industrimetallerna. Börserna var slagiga men slutade veckan på minussidan. Innevarande vecka bör bjuda på en del oljevolatilitet givet både ett antal rapporter samt söndagens ”frysningsmöte” i Doha.
Råvaror: Den australienska regeringen har höjt sin prognos avseende priset på järnmalm (är det värsta över?) och räknar med att högkostnadsproducenter slås ut under kommande år (detsamma är ju giltigt för många av metallerna). Oljeinvesteringarna fortsätter att minska, denna gång rapporteras det att Kanada räknar i år med en 62 % nedgång av investeringarna i energisektorn jämfört med rekordåret 2014. Kommer oljeproducenterna överens om en ”frysning”? Och har den i sådana fall någon bestående betydelse? Många länder kommer nog även framgent att vilja pumpa så mycket det bara går för att täcka de uppkomna budgetunderskotten. T.ex. Saudiarabien behöver ett oljepris på cirka $118/fat för att få ihop statsfinanserna.
Valuta: Dollarn har mest stått och stampat förutom mot en del utvecklingsvalutor och framför allt mot den japanska yenen där dollarn tappat ordentligt med mark (vi tror på mer yen-styrka och den kortsiktige kan fundera på BULL JPYSEK X4 S).
Börser: USA gick i och med Alcoa igår in i rapportsäsongen för kvartal ett. Banksektorn har fortsatt att vara ett sänke. Vår vy är att de kommande veckorna kan vara lite slagigare än vad vi sett tidigare under våren.
Räntor: Obligationsränteuppgångarna i Portugal, Spanien och Italien indikerar ökad oro i området.
OBSERVATIONER I SAMMANDRAG
- Trots brottet ned ur den månadslånga konsolideringen lyckades marknaden inte ta sig ner ur den stigande kanalen. Troligen en ny topp innan nästa korrektionsförsök.
- Elpriset har gjort ett första försök att sätta en korrektionstopp på plats.
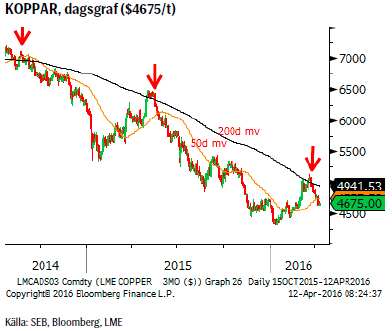
- Koppar har sedan förra veckan fallit under stödet vid $4720/t så mer nedåtpress förväntas,
- Nickelprisets nedgång har varit mycket långsammare än vad vi trott.
- Den japanska yenens styrka fortsätter att överraska prognosmakarna.
- Guldet har trots ett antal test av 50d medelvärdet lyckats stanna ovanför detta. Hur länge till?
- Majspriset har repat sig och det trots väldigt negativa nyheter. Vi är fortsatt positiva
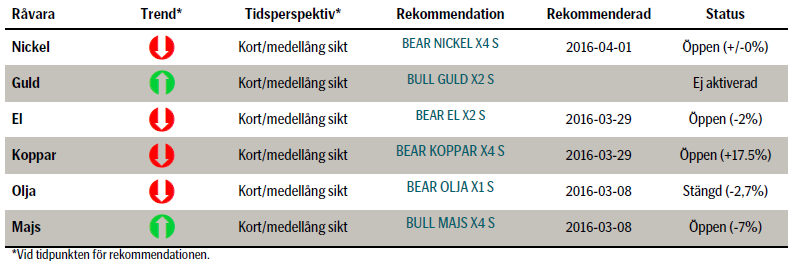
VECKANS REKOMMENDATIONER
INGEN NY REKOMMENDATION DENNA VECKA.
En placering i certifikat och warranter är förknippat med risker. Du kan förlora hela ditt investerade kapital. Läs mer om riskerna i SEB:s offentliggjorda Grundprospekt för certifikat- och warrantprogram på seb.se/cert eller seb.se/mini
OLJA BRENT
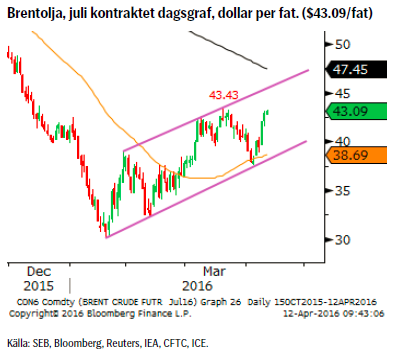 Givet att stödet vid $38,20/fat (kanalgolvet och 50d glidande medelvärde) höll så studsade priset tillbaka upp. Förra veckan avslutades också i dur då priset i princip stängde på fredagens högsta notering.
Innevarande vecka är antagligen en av de mer betydelsefulla för oljans utveckling i närtid då vi dels får ett antal rapporter under veckan (tisdag EIA, onsdag OPEC och torsdag IEA) och sedan avslutar veckan med oljeproducentmötet i Doha på söndag. Sannolikheten för att en frysning av produktionen skulle lyfta priset signifikant måste anses vara låg. Däremot skulle ett fallissemang sannolikt leda till ett markant lägre pris.
OBSERVATIONER
- Antalet riggar föll förra veckan med åtta stycken (till 354 st.).
- Den amerikanska produktionen fortsätter att falla och bör fortsätta att göra så (EIA prognostiserar att nedgången i maj bör hamna runt 114t fat per dag).
- Saudiarabien säger att det inte blir någon frysning av produktionen om inte Iran deltar i en sådan överenskommelse, något Iran vägrar gå med på innan produktionen nått de nivåer man hade innan sanktionerna trädde i kraft.
- Allt fler prognoser pekar mot en bättre balans under andra halvåret.
- Commitment of Traders (CoT) rapporten visade på en minskning av den långa nettopositionen. Minskningen beror i huvudsak på att andelen korta kontrakt ökade betydligt mer än de långa (börjar tron på högre pris vackla?).
- Det historiska säsongsmönstret pekar mot en pristopp under våren,
- $45.50 (kanaltaket) är veckans huvudmotstånd och $38.86 huvudstödet.
REKOMMENDATION
- Givet osäkerheten för veckan så har vi valt att stänga vår BEAR OLJA X1 S.
EL
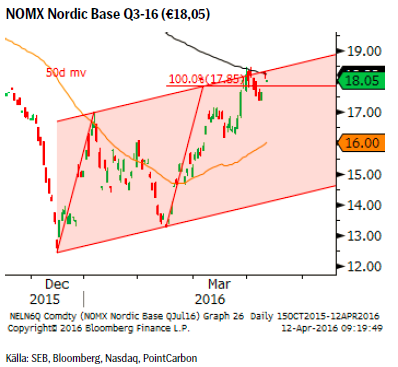 Förra veckan föll priset tillbaka något men stigande oljepriser och utsläppsrätter har ånyo pressat upp priset till den övre delen av vårt estimerade säljområde. Förutom det stigande priset på utsläppsrätter så pekar de flesta fakta mot ett något lägre elpris för kommande vecka.
OBSERVATIONER
- Befinner sig fortfarande i den övre delen av det utmålade målområdet €17.35 – 18.45.
- Vattenmagasinen har sedan förra veckan fortsatt att minska och har nu en fyllnadsgrad på 39,2%. Fyllnadsgraden bör minska ytterligare då man nu kör för fullt för att ge plats för den kommande vårfloden.
- En anings större nederbörd förväntas under kommande vecka.
- Temperaturen förväntas initialt vara något lägre för att nästa vecka ligga strax över medel.
- Stigande pris på CO2 utsläppsrätter.
- Kanaltaket och 200-dagars medelvärde utgör fortsatt två mycket viktiga tekniska motstånd.
- Skulle priset mot förmodan inte vända i det primära målområdet så återfinns ett sekundärt mål vid €20.66.
REKOMMENDATION
- BEAR EL X2 S
KOPPAR (LME 3M)
 Världskopparkonferensen passerade som förväntat utan några större avtryck i priserna. Överutbudet väntas kvarstå ytterligare något/några år innan vi prognosticeras att hamna i ett strukturellt underskott. Givet de positivare tongångarna på medellång till lång sikt gör att gruvbolagen är ytterst motvilliga att avyttra koppargruvor (om man bara kan överleva de låga (och lägre) priserna i nutid (prognoserna från konferensen pendlar mellan $4,000 till $4,800/t). Dessutom med fallande kinesisk produktion (pga. minskade malmreserver) är signalerna att kinesiska gruvföretag förbereder sig för att köpa upp utländska fyndigheter för att på så sätt säkra framtida tillgång till koppar.
Vi håller kvar vår negativa vy och tror att priset åter bör testa nivåer under $4,560/t.
OBSERVATIONER
- Dollarkorrektionen i sin slutfas?
- Chilenska Codeclo (världens största producent) säger att det finns få signaler om ökad efterfrågan.
- Positioneringen på Comex föll förra veckan (statistik per tisdagens stängning) tillbaka till en netto kort position och givet den negativa prisutvecklingen därefter bör denna ha ökat ytterligare.
- LME inventory rose 1,675 tonnes to 147,350 last week.
- Prisuppgången i år kan inte motiveras av förändrade utbuds/efterfrågekalkyler. Priset måste ned mot eller under $4,000/t innan förlusterna blir stora nog för att tvinga fram mer varaktiga produktionsneddragningar.
- På plussidan har vi de positivare tongångarna från både kinesisk såväl som amerikansk bostadsmarknad.
- Tekniskt så har vi precis återvänt ned under det negativt lutande 200-dagars glidande medelvärdet, precis så som korrektionerna 2014 och 2015 slutade. Förra veckans brott av 50dagars medelvärdet har förstärkt säljsignalen.
REKOMMENDATION
- BEAR KOPPAR X4 S
NICKEL (LME 3M)
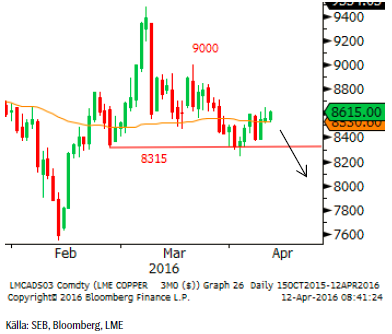 Nickelpriset har inte riktigt utvecklats så som vi tänkt. Brottet under $8315/t borde ha lockat fram mer utbud men så har än så länge inte skett. Kanske är det ändå så att det finns en viss oro givet att vi snabbare än förväntat hamnade i ett underskott. I övrigt så kvarstår de argument som vi tidigare torgfört för lägre priser.
Vi rekommenderar att stänga positionen BEAR NICKEL X4 S om nickelpriset går upp över $8,725/t (den som vill ha en vidare stopp gör detsamma över $9,000).
OBSERVATIONER
- INSG’s (Int’l Nickel Study Group) senaste rapport om ett underskott om 8,100 ton redan i januari indikerar att vi snabbare än förväntat hamnat i underskott.
- Det globala underskottet förväntas att förvärras under kvartal 2 men prisutvecklingen visar dock att marknaden tar underskottet med ro och revideringar av data är antagligen också att förvänta.
- Ytterligare signaler om hur svår pressen på stål och rostfritt stål är (bl.a. strejkade 10-tusentals tyska stålarbetare på måndagen för nya antidumpingregler).
- Planerade, inte genomförda, produktionsneddragningar bör dämpa försök till prisuppgångar.
- Tekniskt sett så har säljsignalen utlösts av brottet av $8,315/t och är giltig tills antingen en ny botten nås alternativt handlar över $9,000/t.
REKOMMENDATION
- BEAR NICKEL X4 S
GULD
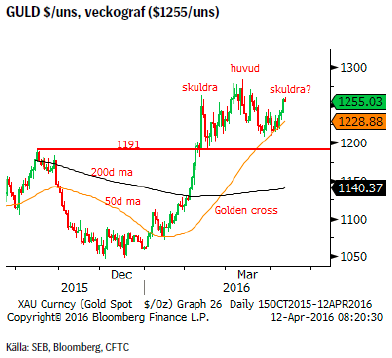 Efter den senaste veckans utveckling bör vi fråga oss huruvida marknaden håller på att skapa en s.k. huvud/skuldra toppformation. Sentimentet är fortsatt väldigt positivt men givet den relativt svaga prisutvecklingen så ser vi det snarare som en varning. Den långa nettopositioneringen är också väldigt stor och historiskt så har nedgångar på 10 – 20% ofta följt vid dessa tillfällen. Vi är dock positiva till ett högre guldpris på lite sikt men anser fortfarande att positioneringen måste ned innan en ny uppgångsfas kan inledas.
Vi bibehåller förra veckas rekommendation att gå lång vid en dipp under $1200/uns (idealet ligger i intervallet $1191 – 1140/uns).
OBSERVATIONER
- Vi tror att dollarn är nära sin korrektionsbotten.
- Studsen efter det senaste FED-mötet blev ytterst kortlivad.
- Flödet in i guldrelaterade aktier fortsätter (många prognoser är fortsatt positiva till guldet). Flödet in i börshandlade fonder har dock stagnerat.
- Centralbanker i öst fortsätter att köpa, dock var kinesiska guldköp under mars de minsta på ett bra tag.
- CoT (Commitment of Traders) rapporten visade på en liten minskning av den långa nettopositioneringen under förra veckan.
- Den långa CoT positioneringen är fortsatt riskabelt stor.
- Tekniskt bör vi hålla oss under $1271/uns för att möjligheten till den sökta nedgången ska kvarstå.
- Tekniskt så skulle även en så kallad huvud/skuldra toppformation kunna vara i görande (utlöses vid brott av $1208/uns).
REKOMMENDATION
- BULL GULD X2 S någonstans under $1200.
MAJS
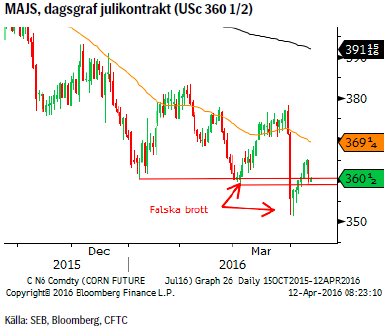 Givet hur negativt marknaden reagerade på USDA’s (US department of agriculture) rapport om prognosticerad planteringsareal för våren 2016 så är det ytterst intressant att notera att sedan rapporten släpptes så har priset sakta men säkert återhämtat sig. Dessutom så är lagren från föregående skörd fortfarande rekordstora. För att spä på den negativa bilden ytterligare så noterar vi att den korta nettopositioneringen ökade kraftigt förra veckan (många nya korta positioner och stängning av långa dito). Då är det inte desto mindre intressant att priset nu återtestar det tidigare huvudstödet. Håller detta så bör föregående rekyltopp ligga inom räckhåll.
Vår rekommendation BULL MAJS X4 S är fortfarande giltig (stopp under föregående botten).
OBSERVATIONER
- Rekordstora lager.
- Planer på ytterligare utökad odlingsareal för majs.
- Eftersom plantering normalt sker i april så återstår att se vad som faktiskt kommer i jorden (slutlig USDA rapport släpps i slutet av juni).
- El Niňo klingar nu av i snabb takt (ytvattnet i Still havet kallnar fort). Frågan är om/när La Niňja slår (medförande kallare och torrare väder i Nordamerika).
- Falska brott har en historisk tendens att frambringa rörelser i motsatt riktning.
REKOMMENDATION
- BULL MAJS X4 S
AKTUELLA REKOMMENDATIONER
[box]SEB Veckobrev Veckans råvarukommentar är producerat av SEB:s Commodities Sales desk och publiceras i samarbete och med tillstånd på Råvarumarknaden.se[/box]
KÄLLOR
Bloomberg, Reuters, SEB
VILLKOR
För varje enskilt certifikat/mini future finns Slutliga Villkor som anger de fullständiga villkoren. Slutliga Villkor finns tillgängligt på kurssidan för respektive certifikat/mini future på www.seb.se, Börs & finans, fliken Strukturerade placeringar.
RISKER
En sammanfattning av de risker som är förknippade med Börshandlade certifikat generellt finns i Produktbroschyren för respektive certifikat eller mini future som är tillgängligt på seb.se/cert respektive seb.se/mini. För en fullständig bild av riskerna behöver du ta del av SEB:s offentliggjorda Grundprospekt för Certifikat- och Warrantprogram som är publicerat på www.seb.se/cert respektive seb.se/mini.
DISCLAIMER
Detta marknadsföringsmaterial, framtaget av SEB:s Commodities Sales desk, har upprättats enbart i informationssyfte.
Även om innehållet är baserat på källor som SEB bedömt som tillförlitliga ansvarar SEB inte för fel eller brister i informationen. Den utgör inte oberoende, objektiv investeringsanalys och skyddas därför inte av de bestämmelser som SEB har infört för att förebygga potentiella intressekonflikter. Yttranden från SEB:s Commodities Sales desk kan vara oförenliga med tidigare publicerat material från SEB, då den senare hänvisas uppmanas du att läsa den fullständiga rapporten innan någon åtgärd vidtas.
Dokumentationen utgör inte någon investeringsrådgivning och tillhandahålls till dig utan hänsyn till dina investeringsmål. Du uppmanas att självständigt bedöma och komplettera uppgifterna i denna dokumentation och att basera dina investeringsbeslut på material som bedöms erforderligt. Alla framåtblickande uttalanden, åsikter och förväntningar är föremål för risker, osäkerheter och andra faktorer och kan orsaka att det faktiska resultatet avviker väsentligt från det förväntade. Historisk avkastning är ingen garanti för framtida resultat. Detta dokument utgör inte ett erbjudande att teckna några värdepapper eller andra finansiella instrument. SEB svarar inte för förlust eller skada – direkt eller indirekt, eller av vad slag det vara må – som kan uppkomma till följd av användandet av detta material eller dess innehåll.
Observera att det kan förekomma att SEB, dess ledamöter, dess anställda eller dess moder- och/eller dotterbolag vid olika tillfällen innehar, har innehaft eller kommer att inneha aktier, positioner, rådgivningsuppdrag i samband med corporate finance-transaktioner, investment- eller merchantbanking-uppdrag och/eller lån i de bolag/finansiella instrument som nämns i materialet.
Materialet är avsett för mottagaren, all spridning, distribuering mångfaldigande eller annan användning av detta meddelande får inte ske utan SEB:s medgivande. Materialet riktar sig inte till personer vars medverkan kräver ytterligare prospekt, registrerings- eller andra åtgärder än vad som följer av svensk rätt. Det åligger var och en att iaktta sådana restriktioner. Materialet får inte distribueras i eller till land där distribution kräver ovan nämnda åtgärder eller strider mot reglering i sådant land. Materialet riktar sig således inte till fysiska eller juridiska personer hemmahörande i USA eller i något annat land där publicering eller tillhandahållande av materialet är förbjudet eller strider mot tillämpliga bestämmelser i landet.
Oaktat detta får SEB tillåta omfördelning av materialet till utvald tredje part i enlighet med gällande avtal. Materialet får inte spridas till fysiska eller juridiska personer som är medborgare eller har hemvist i ett land där sådan spridning är otillåten enligt tillämplig lag eller annan bestämmelse.
Skandinaviska Enskilda Banken AB (publ) är ett publikt aktiebolag och står under tillsyn av Finansinspektionen samt de lokala finansiella tillsynsmyndigheter i varje jurisdiktionen där SEB har filial eller dotterbolag.
Selling down on a ”deal”. Brent crude fell 6.2% last week with accelerated weakness towards the end of the week. Close of the week at $87.33/b and low of the week (and on Friday) of $85.8/b. Brent is falling another 4% this morning to $83.7/b on confirmation by Iran that a MoU text has been reached and that it will be signed on Friday this week.

So what is this ”deal” worth? Talk on the desk here this morning is that it is much like ”putting lipstick on a pig” where Trump has to sell this at home as a victory where ”the SoH has reopened”, the nuclear issue will be ironed out over the coming 60 days (or maybe 600 days?) and US consumers are getting a lower gasoline price and maybe US republicans survives the midterm elections.
The importance for Iran is that it emerges as the defacto winner of this war in the eyes of the non-US public world. That Iran now onwards is the ”ruler of the SoH” (combo of geography and new weapons systems like drones) or more softer: ”the guarantor of safe passage through the SoH”.
Iran doesn’t need nuclear weapons any more. Nuclear deterrence doesn’t work any more. Ukraine has made many attacks deep into Russia without being nuked in return. Plenty of Iranian ballistic rockets blasts over Israel but Iran wasn’t nuked in return.
There is no trust between the US and Iran. We don’t know all the details yet of the MoU. But what we do know is that there is no trust between the US and Iran what so ever. This is probably more like a descriptive text on how they can cooperate in a way where both sides keeps tactical leverage. Neither side makes irreversible concessions. Violations can be punished quickly. Cooperation produces immediate benefits.
This is a fragile structure. It can easily break down. There may be details which cannot be overcome. To be seen on Friday. The US has to show that it is willing put enough force behind managing and restraining Israel versus Hezbollah in Lebanon. We have seen that Netanyahu hasn’t listened all that much to Trump’s directives and wishes. This could be a major obstacle.
A gradual reopening is tactically preferable for Iran. A tactical leverage for Iran right now is that global oil stocks have been drawn down towards painful and increasingly dangerous levels with increasing risks for oil price spikes in mid-July to August. This together with US midterm elections on 3 November gives tactical leverage to Iran. Iran probably doesn’t want to fully give up on that leverage. A rapid, full reopening where global stocks are able to refill over the coming 60 days will significantly erode that leverage. If Iran reinstates a closure of the SoH after 60 days (if talks break down again), then the effect won’t be that impactful in terms of prices and the US midterm elections.
So a gradual and partial reopening where global markets gets the oil they need while they are unable to rebuild stocks could be a practical middle way for both parties. Trump can sell it as ”the SoH has reopened” and get affordable gasoline for US consumers. Iran can sell it as ”the SoH has fully reopened, but there is some friction” so flow is only 60-80% of normal.
Not much real demand destruction below $100/b. What we do know is that there is not much real price pain demand destruction for oil globally at an oil price below $100/b. A lot of demand-shock destruction. Fear. But demand should now come roaring back towards normal with fear for exceptionally high prices now is rapidly receding.
Sudden China demand destruction due to EVs? Bullocks. EV share of total Chinese carpool now around 13%. Share of new sales of EVs has reached 50%. This is a very gradual process. It doesn’t make oil demand fall like a rock over night. When EV new sales share reaches 100%, then the gasoline car pool will contract by some 5-10% per year. But that is only gasoline. Sudden reduction in Chinese oil demand is more about shock and risk.
Chinese crude oil imports will come roaring back. At what price? Today’s ”neutral” oil price is $70/b. That is the five year price which has steadily traded around the $70/b mark over the past 3-4 years. With still a risky picture one would think that China and the rest of the world will be big buyers of oil in the range of $70-85/b.
Global demand will likely snap back towards normal, forecasted demand and growth at such prices.
Physical reopening is a gradual process. The physical and practical reopening of the SoH will likely be gradual rather than sudden. And that probably suites Iran tactically as well.
Brent M1 price versus the Brent 5-yr (today’s ”normal” price)

Market is starting to take US/Iran headlines with a pinch of salt. Brent crude rose $2.8/b yesterday to an official close of $112.1/b. But after that it traded as low as $108.05/b before ending late night at around $109.7/b. Through the day it traded in a range of $106.87 – 112.72/b amid a flurry of news or rumors from Iran and the US. ”US temporary sanctions during negotiations” (falls alarm). ”We will bomb Iran” (not anyhow),… etc. While the market is still fluctuating to this kind of news flow, it is starting to take such headlines with a pinch of salt.
We’ll see. Maybe, maybe not. The Brent M1 contract is trading at $110.2/b this morning which very close to the average ticks through yesterday of $110.4/b.
Trump with bearish, verbal intervention whenever Brent trades above $110/b it seems. What seems to be a pattern is that Trump states something like ”very good negotiations going on with Iran”, ”New leaders in Iran are great,..”, ”Great progress in negotiations,…”, ”Deal in sight,..” etc whenever the Brent M1 contract trades above $110/b. An effort to cool the market. These hot air verbal interventions from Trump used to have a heavy bearish impact on prices, but they now seems to have less and less effect unless they are backed by reality.
As far as we can see there has been no real progress in the negotiations between the US and Iran with both sides still standing by their previous demands.
Iran is getting stronger while the cease fire lasts making a return to war for Trump yet harder. Iran is naturally in constant preparation for a return to war given Trump’s steady threats of bombing Iran again. Iran is naturally doing what ever is possible to prepare for a return to war. And every day the cease fire lasts it is better prepared. This naturally makes it more and more difficult and dangerous for the US to return to warring activity versus Iran as the consequences for energy infrastructure in the Persian Gulf will be more and more severe the longer the cease fire lasts. Israel seems to see it this way as well. That the war is not won and that current frozen state of a cease fire gives Iran opportunity to rebuild military and politically.
Global inventories are drawing down day by day. How much? In the meantime the Strait of Hormuz stays closed. There is varying measures and estimates of how much global inventories are drawing down. Our rough estimate, back of the envelope, is that global inventories are drawing down by at least some 10 mb/d or about 300 mb/d in a balance between loss of supply versus demand destruction. Other estimates we see are a monthly draw of 250-270 mb/d. The IEA only ’measured’ a draw in global observable stocks of 117 mb in April with oil on water rising 53 mb while on shore stocks fell 170 mb. But global stocks are hard to measure with large invisible, unmeasured stocks. As such a back of the envelope approach may be better.
Oil products is what the world is consuming. Oil product prices likely to rise while product stocks fall. Strategic Petroleum Reserves (SPR) are predominantly crude oil. Discharging oil from OECD SPR stocks, a sharp reduction in Chinese crude imports and a reduction in global refinery throughput of 6-7 mb/d has helped to keep crude oil markets satisfactorily supplied. But global inventories are drawing down none the less. And oil products is really what the world is consuming. So if global refinery throughput stays subdued, then demand will eventually have to match the supply of oil products. The likely path forward this summer is a steady draw down in jet fuel, diesel and gasoline. Higher prices for these. Then, if possible, higher refinery throughput and higher usage of crude in response to very profitable refinery margins. And lastly sharper draw in crude stocks and higher prices for these. But some 6 mb/d of oil products used to be exported through the Strait of Hormuz. And it may not be so easy to ramp up refinery activity across the world to compensate. Especially as Ukraine continues to damage Russian refineries as well as Russian crude production and export facilities.
Watch oil product stocks and prices as well as Brent calendar 2027. What to watch for this summer is thus oil product inventories falling and oil product premiums to crude rising. Another measure to watch is the Brent crude 2027 contract as it rises steadily day by day as the Strait of Hormuz stays closed and global oil inventories decline. The latter is close to the highest level since the start of the war and keeps rising.
The Brent M1 contract and the Brent 2027 prices and current price of jet fuel in Europe (ARA). All in USD/b

Our back of the envelope calculation of the global shortage created by the closure of the Strait of Hormuz. Note that 3.5 mb/d of discharge from SPR is also a draw. Note also that ’Forced demand loss’ of 2.5 mb/d is probably temporary and will fall back towards zero as logistics are sorted out leaving ’Price demand loss’ to do the job of balancing the market. Thus a shortfall of at least 9 mb/d created by the closure. More if SPR discharge is included and more if Forced demand loss recedes.

Brent is climbing higher. Front-month is at USD 106.3/bl this morning, close to a weekly high and a USD 9/bl jump from Mondays open. This is the move we flagged as a risk earlier in the week: the market shifting from ”a deal is around the corner” to ”this is going to take longer than we thought”.

Analyst Commodities, SEB
During April, rest-of-year Brent remained remarkably stable around USD 90/bl. A stability which rested on one single assumption: the SoH reopens around 1 May. That assumption is now slowly falling apart.
As we highlighted yesterday: every week of delay beyond 1 May adds (theoretically) ish USD 5/bl to the rest-of-year average, as global inventories draw 100 million barrels per week. i.e., a mid-May reopening implies rest-of-year Brent closer to USD 100/bl, and anything pushing into June or July takes us meaningfully higher.
What’s changed in the last 48 hours:
#1: The US military has formally warned that clearing suspected sea mines from SoH could take up to six months. That is a completely different timescale from what the financial market is pricing. Even a political deal tomorrow does not immediately reopen the strait.
#2: Trump has shifted his tone from urgency to ”strategic patience”. In yesterday’s press conference: ”Don’t rush me… I want a great deal.” The market is reading this as a president no longer feeling pressured by timelines, with the naval blockade running in the background.
#3: So far, the military activity is escalating, not de-escalating. Axios reports Iran is laying more mines in SoH. The US 3rd carrier strike group (USS George H.W. Bush) is arriving with two countermine vessels. Trump yesterday ordered the US Navy to destroy any Iranian boats caught laying mines. While CNN reports that the Pentagon is actively drawing up plans to strike Iranian SoH capabilities and individual Iranian military leaders if the ceasefire collapses. i.e., NOT a attitude consistent with an imminent deal!
Spot crude and product prices eased off the early-April highs on a combination of system rerouting and deal optimism. Both now weakening. Goldman estimates April Gulf output is reduced by 14.5 mbl/d, or 57% of pre-war supply, a number that keeps getting worse the longer this drags on.
Demand-side adaptation is ongoing: S. Korea has cut its Middle East crude dependence from 69% to 56% by pulling more from the Americas and Africa, and Japan is kicking off a second round of SPR releases from 1 May. But SPRs are finite.
Ref. to the negotiations, we should not bet on speed. The current Iranian leadership is dominated by genuine hardliners willing to absorb economic pain and run the clock to extract concessions. That is not a setup for a rapid resolution. US/Israeli media briefings keep framing the delay as ”internal Iranian divisions”, the reality is more complicated and points toward weeks and months, not days.
Our point is that the complexity is large, and higher prices have only just started (given a scenario where the negotiations drag out in time). The market spent April leaning on the USD 90/bl rest-of-year assumption; that case is diminishing by the hour. If ”early May reopening” is replaced by ”June, July or later” over the next week or two, both crude and products have meaningful room to reprice higher from here. There is a high risk being short energy and betting on any immediate political resolution(!).


Vattenfalls och Industrikrafts kärnkraftsbolag Videberg Kraft har valt Rolls-Royce SMR
Selling down on a ”deal”

Sommarväder skapar prisrally på elbörsen
Oil product price pain is set to rise as the Strait of Hormuz stays closed into summer

Solkraften pressar elpriserna dagtid
Oil product price pain is set to rise as the Strait of Hormuz stays closed into summer
Sommarväder skapar prisrally på elbörsen
Vattenfalls och Industrikrafts kärnkraftsbolag Videberg Kraft har valt Rolls-Royce SMR
Selling down on a ”deal”
-
Analys4 veckor sedan
Oil product price pain is set to rise as the Strait of Hormuz stays closed into summer
-
Nyheter2 veckor sedan
Sommarväder skapar prisrally på elbörsen
-
 Nyheter2 dagar sedan
Vattenfalls och Industrikrafts kärnkraftsbolag Videberg Kraft har valt Rolls-Royce SMR
-
Analys2 dagar sedan
Selling down on a ”deal”