Analys
SEB – Jordbruksprodukter, vecka 47
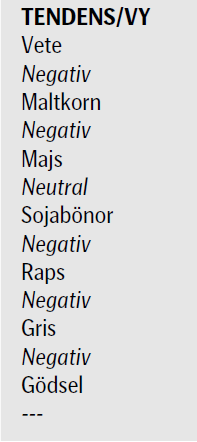
 Vete, majs och sojabönor har precis brutit sina tekniska stöd och noterar prisnedgångar den senaste veckan på mellan 5 och 9%. Omvärlden utanför lantbruksmarknaderna påverkar negativt.
HSBC:s så kallade ”flash PMI” för Kina hamnade på 48.3 i tisdags. PMI är ett mått på inköpschefernas aktivitet och ett PMI under 50 signalerar en krympande ekonomi. Det officiella PMI publiceras den 1 december, men HSBC:s snabbvariant brukar vara rättvisande.
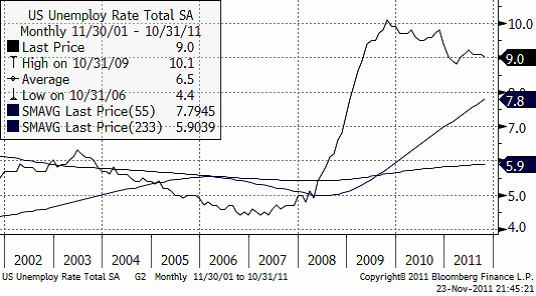
Från USA kom också en kalldusch när tillväxten i bruttonationalprodukten för det andra kvartalet justerades ner från +2.5% till +2.0%. Fruktan sprider sig att USA ska gå in i en ny lågkonjunktur samtidigt som skulderna är ”olagligt höga” och växer utan att politikerna tycks kunna enas om att kontrollera dem. Staten borde spara, men tillväxten bromsas redan och arbetslösheten ligger på 9%. Nedan ser vi arbetslösheten i USA de senaste 10 åren.
USA är stängt för Thanksgiving idag torsdag och fredagen är en klämdag, den så kallade ”Black Friday”, som inte har med marknaden att göra utan är en rea-dag i detaljhandeln. Marknaden kommer att vara tunn. Ofta sker stora och betydelsefulla rörelser under sådana tillfällen, så man bör hålla en extra koll på marknaderna idag och imorgon.
 Europa ser inte bättre ut. Tyskland hade tänkt emittera nya obligationer igår, men mer än en tredjedel av dem blev kvar. Det berodde inte på att priset blev fel. Spararna var helt enkelt ointresserade. Under tiden ligger Italiens 10-årsränta kvar på samma höga nivå som före premiärministerbytet, Frankrikes ränta fortsätter stiga och Spaniens (”too big to save”) steg igår till 6.65%. Greklands ränta går inte att hitta längre i Bloomberg. ”Return on capital” är uppenbarligen ointressant. Det som visas är priset på statspapperen (lite drygt 20%), alltså ”return of capital”.
Ska vi sammanfatta, så ser det illavarslande ut. Konsumtionen ser ut att drabbas i USA, i Europa och i Kina. Om vi drar paralleller till 2008/09, så skulle vi kunna vänta oss att privat konsumtion håller i sig till Jul och sedan blir det tvärstopp. Jag kanske låter negativ, men situationen är verkligen mycket, mycket allvarlig i samhällshushållningen utanför jordbruksmarknaden.
Vete
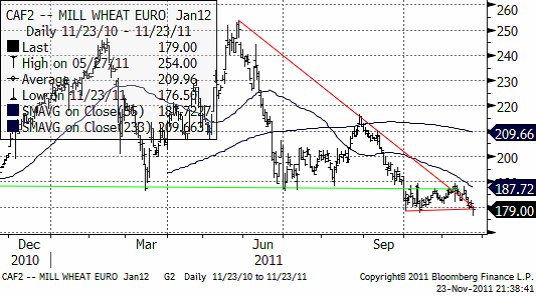
Terminspriset på Matif-vete stängde på 179 euro för februarileverans. Som väntat har inte 180-euronivån hållit. Marknaden handlade under dagen ner vetet till 176.5 euro, men fyndköpare kom in och stängde onsdagen på 179. Detta är ändå en klar säljsignal.
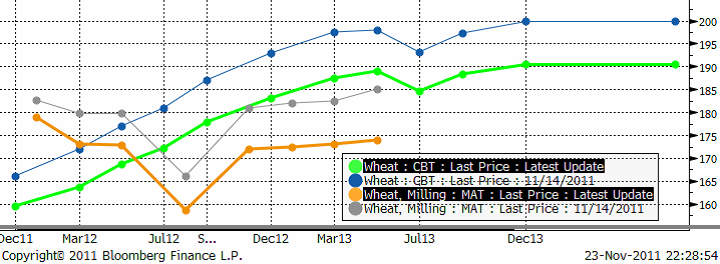
Nedan ser vi terminskurvan för Chicagovete och Matif nu och för en vecka sedan. De ”feta” kurvorna är de aktuella. De ”smala” är förra veckans. Vi ser något av en tendens till särskilt lägre priser på längre Matif-terminer.
Förra gången vi såg backwardation i Europa var förra gången (2008) som priset föll. Då visade det sig att bönder satt kvar med vetet på gården i förhoppningen om att kunna sälja det dyrare – om bara priset ville gå upp igen. Kanske är det samma orsak till backwardation igen (brist, för att bönder inte säljer).
Om bönderna tror på högre priser och sitter kvar med vetet – sälj åtminstone spot dyrt och köp terminer billigare istället. Det är bättre. Men inte bra. Det här är en riktig ”bear market”. Priset kommer att falla. Det är ett klassiskt fall av rekommendationen ”Sell and go away. Come back in May.”
Etanol har blivit en viktig faktor, inte bara för majs i USA, utan även för vete i Europa. Europa och USA är två ganska osynkroniserade marknader. Skatter, tullar, kvoter och transportkostnader skapar ett samband i USA mellan majs och etanol och i Europa mellan vete och etanol. När foderefterfrågan kan väntas dämpas i Europa pga minskad konsumtion och ökat sparande, står etanoltillverkarnas efterfrågan på spannmål kvar som en viktig faktor.
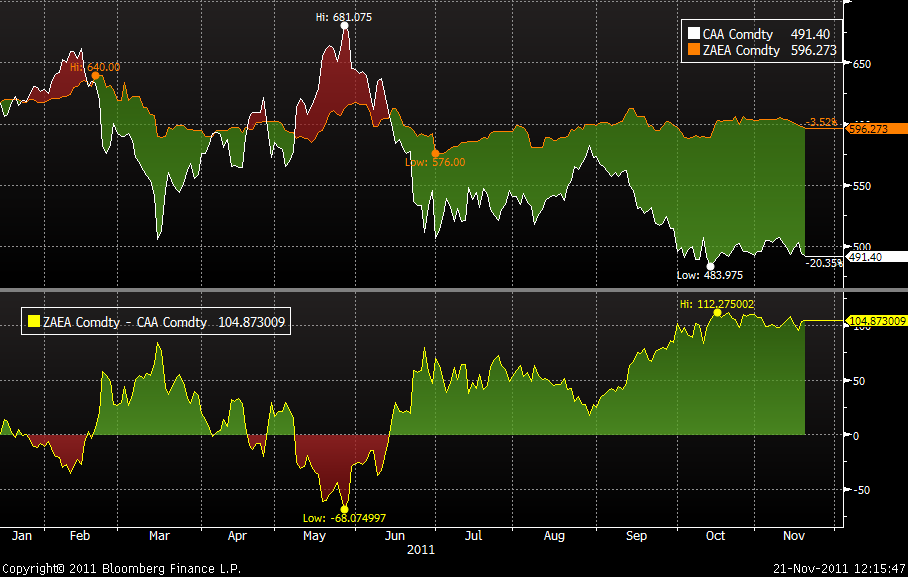
Matif-kvarnvete vs Etanolsorten T2 FOB Rotterdam ser vi i diagrammet nedan. Just nu kostar vetet till ett ton etanol 491 euro och ett ton etanol 596, FOB Rotterdam. Marginalen är alltså 104 euro per ton etanol.
Som vi ser är detta en historiskt mycket god marginal. Etanolproducenternas intressen är alltså ett stöd i marknaden. Men notera att marginalen vi ser ovan inte är etanolproducenternas vinst. Kostnaderna utgörs även av bränsle, löner, räntor och avskrivningar, förstås.
Råoljepriset hålls högt – och extremt volatilt – eftersom produktionsreserverna (som kan tas i anspråk vid behov) är små. Så har det varit sedan ungefär 2005. Å ena sidan tycks vi stå inför en konjunkturnedgång. Å andra sidan befinner sig Syrien och Egypten i uppror i den rörelse som kallas ”den arabiska våren” och som skapar oro för att de små reserverna i oljeproduktionen inte ska räcka till om ett viktigare land än Libyen drabbas av krig.
Ryssland och Ukraina fortsätter att vinna exportordrar. Och europeiskt vete fortsätter att förlora tenders. I fredags förra veckan nåddes vi av det obekräftade ryktet att Algeriet (som köpt 100% från Frankrike alla år) köpt Argentinskt. Det finns ännu inga tecken på att Ryssland och Ukraina nått ”peak exports” för säsongen.
Allt talar för att Matif-vete faller ner i första hand till 150 – 160 – euro-nivån. På köparsidan hittar vi antagligen etanolfabrikanter.
Maltkorn
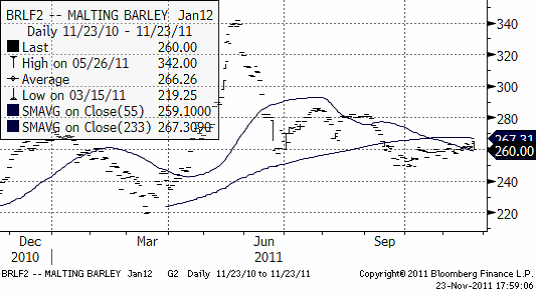
Maltkornsmarknaden följer vetet och det finns inga speciella nyheter att rapportera. Tekniskt ligger priset under glidande medelvärden. Den tekniska trenden är alltså nedåtriktad.
Potatis
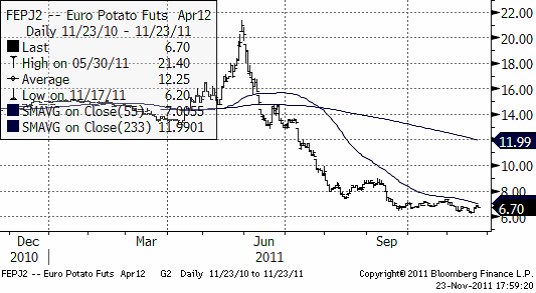
Priset på potatis av årets skörd steg med 5% den senaste veckan, som en reaktion på förra veckans prisfall på 9%.
Nedan ser vi kursdiagrammet på europeisk potatis, som handlas på Eurex; terminen avser leverans april nästa år.
Majs
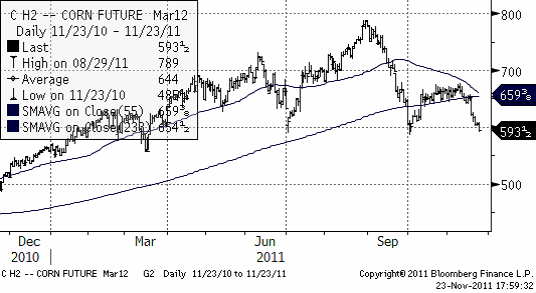
Majspriset har fallit till en teknisk stödnivå och frågan är nu om priset kommer att brytas. Vad som direkt talar för det är att dollarn har stärkts kraftigt mot europeiska valutor. Bara av den anledningen borde priset (i dollar) justeras ner.
I Argentina sker sådden just nu och det är relativt torrt. En förvärring av La Niña vore ”bullish news”, men den närmaste 14-dagarsprognosen innehåller en del regn, så än så länge ligger farhågorna i framtiden.
Nedan ser vi marskontraktet på CBOT, där priset ligger på den nivå vid 600 cent där marknaden funnit stöd flera gånger. Den här gången talar dock den starka dollarn för att stödet bryts och majs definitivt går in i en ”bear market”.
Sojabönor
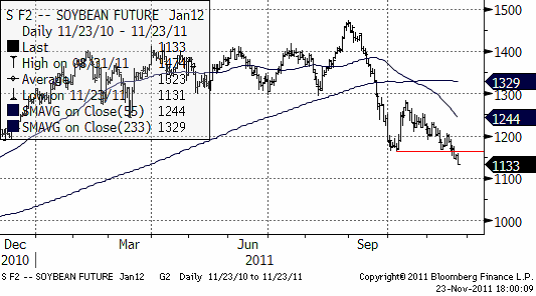
Priset på sojabönor befinner sig i en sjunkande trend. Det är en ”bear market”. Denna förstärktes för ett par dagar sedan när det tekniska stödet på 1167 bröts. Priset kan mycket väl gå ner mot 10 dollar.
Brasilianska säljare lär komma in allt mer och sälja ner priset. Vi är negativa ur tekniskt perspektiv de närmaste tre månaderna.
Raps
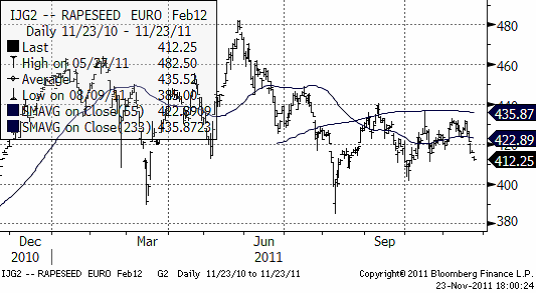
Rapspriset håller sig högt pga den svaga euron, inget annat, skrev vi för en vecka sedan och det gäller än. Raps är dyrt i förhållande till sojabönor och ”borde” falla ner mot 400 euro i första hand.
Gris
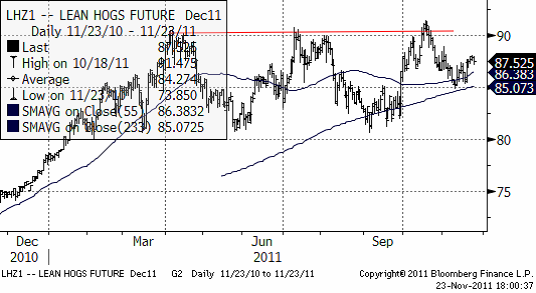
Tekniskt vilar priset på lean hogs på de glidande medelvärdena. Priset håller sig högt, trots svaghet i alla andra marknader utom ädelmetaller. Det är orimligt och priset på gris borde gå ner det också.
Valutor
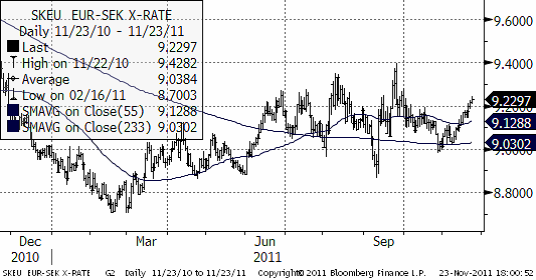
EURSEK handlas i ett volatilt brett intervall. Det finns inga signaler att utläsa alls. Kronan har försvagats och det är konstigt.
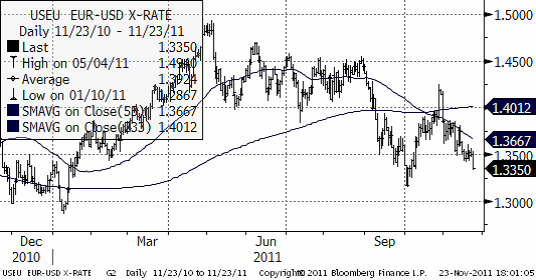
EURUSD har äntligen brutit nedåt och nu lär det gå fort.l. I första hand är nästa stöd 1.3145 dollar. I andra hand är det botten nere vid 1.2 dollar.
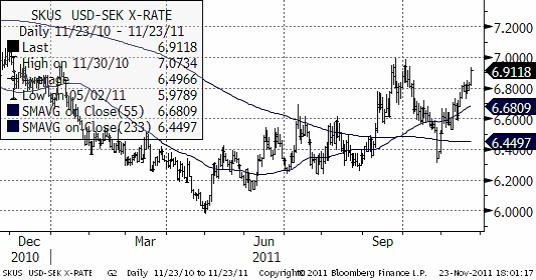
USDSEK stiger som förväntat när det skakar till i världen och lite extra förstås när det skakar till i EU (som Sverige är en del av). Nästa test är 7 kr och med det momentum marknaden har är valutakursen sannolikt där snart.
Gödsel
Kalium
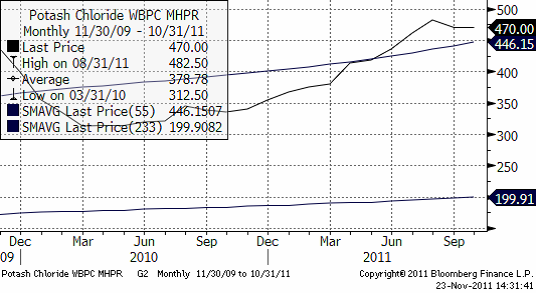
Priset på kalium ligger kvar på samma nivå som för ett par veckor sedan.
Kväve
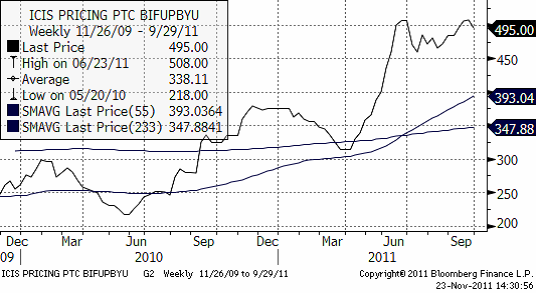
Nedan ser vi prisutvecklingen på Urea FOB Yuzhny i dollar per ton. Det har inte varit någon förändring.
Fosfor
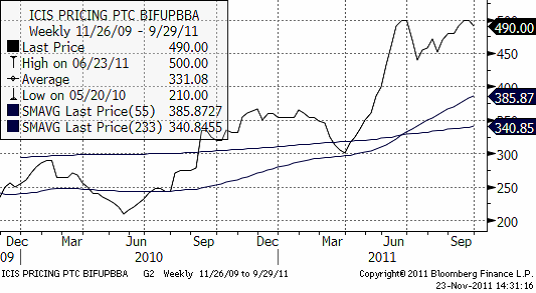
Nedan ser vi prisutvecklingen på Diammoniumfosfat FOB Baltic i dollar per ton. Det har inte varit någon förändring från förra veckan.
[box]SEB Veckobrev Jordbruksprodukter är producerat av SEB Merchant Banking och publiceras i samarbete och med tillstånd på Råvarumarknaden.se[/box]
Disclaimer
The information in this document has been compiled by SEB Merchant Banking, a division within Skandinaviska Enskilda Banken AB (publ) (“SEB”).
Opinions contained in this report represent the bank’s present opinion only and are subject to change without notice. All information contained in this report has been compiled in good faith from sources believed to be reliable. However, no representation or warranty, expressed or implied, is made with respect to the completeness or accuracy of its contents and the information is not to be relied upon as authoritative. Anyone considering taking actions based upon the content of this document is urged to base his or her investment decisions upon such investigations as he or she deems necessary. This document is being provided as information only, and no specific actions are being solicited as a result of it; to the extent permitted by law, no liability whatsoever is accepted for any direct or consequential loss arising from use of this document or its contents.
About SEB
SEB is a public company incorporated in Stockholm, Sweden, with limited liability. It is a participant at major Nordic and other European Regulated Markets and Multilateral Trading Facilities (as well as some non-European equivalent markets) for trading in financial instruments, such as markets operated by NASDAQ OMX, NYSE Euronext, London Stock Exchange, Deutsche Börse, Swiss Exchanges, Turquoise and Chi-X. SEB is authorized and regulated by Finansinspektionen in Sweden; it is authorized and subject to limited regulation by the Financial Services Authority for the conduct of designated investment business in the UK, and is subject to the provisions of relevant regulators in all other jurisdictions where SEB conducts operations. SEB Merchant Banking. All rights reserved.
Analys
More weakness and lower price levels ahead, but the world won’t drown in oil in 2026

Some rebound but not much. Brent crude rebounded 1.5% yesterday to $65.47/b. This morning it is inching 0.2% up to $65.6/b. The lowest close last week was on Thursday at $64.11/b.

The curve structure is almost as week as it was before the weekend. The rebound we now have gotten post the message from OPEC+ over the weekend is to a large degree a rebound along the curve rather than much strengthening at the front-end of the curve. That part of the curve structure is almost as weak as it was last Thursday.
We are still on a weakening path. The message from OPEC+ over the weekend was we are still on a weakening path with rising supply from the group. It is just not as rapidly weakening as was feared ahead of the weekend when a quota hike of 500 kb/d/mth for November was discussed.
The Brent curve is on its way to full contango with Brent dipping into the $50ies/b. Thus the ongoing weakening we have had in the crude curve since the start of the year, and especially since early June, will continue until the Brent crude oil forward curve is in full contango along with visibly rising US and OECD oil inventories. The front-month Brent contract will then flip down towards the $60/b-line and below into the $50ies/b.
At what point will OPEC+ turn to cuts? The big question then becomes: When will OPEC+ turn around to make some cuts? At what (price) point will they choose to stabilize the market? Because for sure they will. Higher oil inventories, some more shedding of drilling rigs in US shale and Brent into the 50ies somewhere is probably where the group will step in.
There is nothing we have seen from the group so far which indicates that they will close their eyes, let the world drown in oil and the oil price crash to $40/b or below.
The message from OPEC+ is also about balance and stability. The world won’t drown in oil in 2026. The message from the group as far as we manage to interpret it is twofold: 1) Taking back market share which requires a lower price for non-OPEC+ to back off a bit, and 2) Oil market stability and balance. It is not just about 1. Thus fretting about how we are all going to drown in oil in 2026 is totally off the mark by just focusing on point 1.
When to buy cal 2026? Before Christmas when Brent hits $55/b and before OPEC+ holds its last meeting of the year which is likely to be in early December.
Brent crude oil prices have rebounded a bit along the forward curve. Not much strengthening in the structure of the curve. The front-end backwardation is not much stronger today than on its weakest level so far this year which was on Thursday last week.

The front-end backwardation fell to its weakest level so far this year on Thursday last week. A slight pickup yesterday and today, but still very close to the weakest year to date. More oil from OPEC+ in the coming months and softer demand and rising inventories. We are heading for yet softer levels.

Analys
A sharp weakening at the core of the oil market: The Dubai curve

Down to the lowest since early May. Brent crude has fallen sharply the latest four days. It closed at USD 64.11/b yesterday which is the lowest since early May. It is staging a 1.3% rebound this morning along with gains in both equities and industrial metals with an added touch of support from a softer USD on top.

What stands out the most to us this week is the collapse in the Dubai one to three months time-spread.
Dubai is medium sour crude. OPEC+ is in general medium sour crude production. Asian refineries are predominantly designed to process medium sour crude. So Dubai is the real measure of the balance between OPEC+ holding back or not versus Asian oil demand for consumption and stock building.
A sharp weakening of the front-end of the Dubai curve. The front-end of the Dubai crude curve has been holding out very solidly throughout this summer while the front-end of the Brent and WTI curves have been steadily softening. But the strength in the Dubai curve in our view was carrying the crude oil market in general. A source of strength in the crude oil market. The core of the strength.
The now finally sharp decline of the front-end of the Dubai crude curve is thus a strong shift. Weakness in the Dubai crude marker is weakness in the core of the oil market. The core which has helped to hold the oil market elevated.
Facts supports the weakening. Add in facts of Iraq lifting production from Kurdistan through Turkey. Saudi Arabia lifting production to 10 mb/d in September (normal production level) and lifting exports as well as domestic demand for oil for power for air con is fading along with summer heat. Add also in counter seasonal rise in US crude and product stocks last week. US oil stocks usually decline by 1.3 mb/week this time of year. Last week they instead rose 6.4 mb/week (+7.2 mb if including SPR). Total US commercial oil stocks are now only 2.1 mb below the 2015-19 seasonal average. US oil stocks normally decline from now to Christmas. If they instead continue to rise, then it will be strongly counter seasonal rise and will create a very strong bearish pressure on oil prices.
Will OPEC+ lift its voluntary quotas by zero, 137 kb/d, 500 kb/d or 1.5 mb/d? On Sunday of course OPEC+ will decide on how much to unwind of the remaining 1.5 mb/d of voluntary quotas for November. Will it be 137 kb/d yet again as for October? Will it be 500 kb/d as was talked about earlier this week? Or will it be a full unwind in one go of 1.5 mb/d? We think most likely now it will be at least 500 kb/d and possibly a full unwind. We discussed this in a not earlier this week: ”500 kb/d of voluntary quotas in October. But a full unwind of 1.5 mb/d”
The strength in the front-end of the Dubai curve held out through summer while Brent and WTI curve structures weakened steadily. That core strength helped to keep flat crude oil prices elevated close to the 70-line. Now also the Dubai curve has given in.

Brent crude oil forward curves

Total US commercial stocks now close to normal. Counter seasonal rise last week. Rest of year?

Total US crude and product stocks on a steady trend higher.

Analys
OPEC+ will likely unwind 500 kb/d of voluntary quotas in October. But a full unwind of 1.5 mb/d in one go could be in the cards

Down to mid-60ies as Iraq lifts production while Saudi may be tired of voluntary cut frugality. The Brent December contract dropped 1.6% yesterday to USD 66.03/b. This morning it is down another 0.3% to USD 65.8/b. The drop in the price came on the back of the combined news that Iraq has resumed 190 kb/d of production in Kurdistan with exports through Turkey while OPEC+ delegates send signals that the group will unwind the remaining 1.65 mb/d (less the 137 kb/d in October) of voluntary cuts at a pace of 500 kb/d per month pace.

Signals of accelerated unwind and Iraqi increase may be connected. Russia, Kazakhstan and Iraq were main offenders versus the voluntary quotas they had agreed to follow. Russia had a production ’debt’ (cumulative overproduction versus quota) of close to 90 mb in March this year while Kazakhstan had a ’debt’ of about 60 mb and the same for Iraq. This apparently made Saudi Arabia angry this spring. Why should Saudi Arabia hold back if the other voluntary cutters were just freeriding? Thus the sudden rapid unwinding of voluntary cuts. That is at least one angle of explanations for the accelerated unwinding.
If the offenders with production debts then refrained from lifting production as the voluntary cuts were rapidly unwinded, then they could ’pay back’ their ’debts’ as they would under-produce versus the new and steadily higher quotas.
Forget about Kazakhstan. Its production was just too far above the quotas with no hope that the country would hold back production due to cross-ownership of oil assets by international oil companies. But Russia and Iraq should be able to do it.
Iraqi cumulative overproduction versus quotas could reach 85-90 mb in October. Iraq has however steadily continued to overproduce by 3-5 mb per month. In July its new and gradually higher quota came close to equal with a cumulative overproduction of only 0.6 mb that month. In August again however its production had an overshoot of 100 kb/d or 3.1 mb for the month. Its cumulative production debt had then risen to close to 80 mb. We don’t know for September yet. But looking at October we now know that its production will likely average close to 4.5 mb/d due to the revival of 190 kb/d of production in Kurdistan. Its quota however will only be 4.24 mb/d. Its overproduction in October will thus likely be around 250 kb/d above its quota with its production debt rising another 7-8 mb to a total of close to 90 mb.
Again, why should Saudi Arabia be frugal while Iraq is freeriding. Better to get rid of the voluntary quotas as quickly as possible and then start all over with clean sheets.
Unwinding the remaining 1.513 mb/d in one go in October? If OPEC+ unwinds the remaining 1.513 mb/d of voluntary cuts in one big go in October, then Iraq’s quota will be around 4.4 mb/d for October versus its likely production of close to 4.5 mb/d for the coming month..
OPEC+ should thus unwind the remaining 1.513 mb/d (1.65 – 0.137 mb/d) in one go for October in order for the quota of Iraq to be able to keep track with Iraq’s actual production increase.
October 5 will show how it plays out. But a quota unwind of at least 500 kb/d for Oct seems likely. An overall increase of at least 500 kb/d in the voluntary quota for October looks likely. But it could be the whole 1.513 mb/d in one go. If the increase in the quota is ’only’ 500 kb/d then Iraqi cumulative production will still rise by 5.7 mb to a total of 85 mb in October.
Iraqi production debt versus quotas will likely rise by 5.7 mb in October if OPEC+ only lifts the overall quota by 500 kb/d in October. Here assuming historical production debt did not rise in September. That Iraq lifts its production by 190 kb/d in October to 4.47 mb/d (August level + 190 kb/d) and that OPEC+ unwinds 500 kb/d of the remining quotas in October when they decide on this on 5 October.

-

 Nyheter4 veckor sedan
Mahvie Minerals i en guldtrend
-

 Analys4 veckor sedan
Volatile but going nowhere. Brent crude circles USD 66 as market weighs surplus vs risk
-
 Nyheter4 veckor sedan
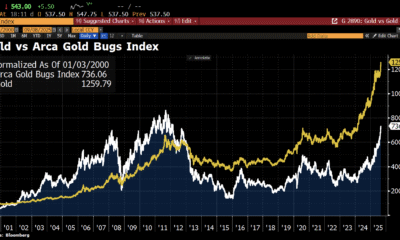
Aktier i guldbolag laggar priset på guld
-

 Nyheter4 veckor sedan
Kinas elproduktion slog nytt rekord i augusti, vilket även kolkraft gjorde
-

 Nyheter3 veckor sedan
Tyskland har så höga elpriser att företag inte har råd att använda elektricitet
-
 Nyheter4 veckor sedan
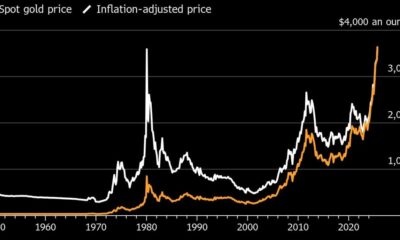
Guld når sin högsta nivå någonsin, nu även justerat för inflation
-
 Nyheter4 veckor sedan
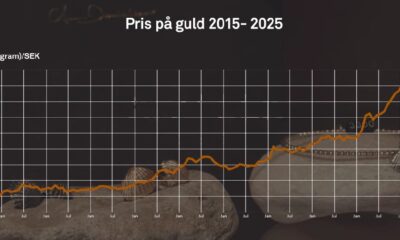
Det stigande guldpriset en utmaning för smyckesköpare
-

 Analys4 veckor sedan
Waiting for the surplus while we worry about Israel and Qatar


