Analys
SEB – Jordbruksprodukter, vecka 14 2012
 Priserna på jordbruksprodukter har rört sig en del den senaste veckan, men har stannat på nivåer som är nästan desamma som för en vecka sedan. Majsmarknaden ser riktigt svag ut rent tekniskt. Sojabönor som stigit kraftigt har kommit upp i en nivå där det är lönsamt att byta från majs till sojabönor i den kommande sådden. Rapsmarknaden har dragits med av sojan, men visar inga tecken på att ha nått toppen.
Samfällt dålig och illavarslande ekonomisk statistik kom igår från FED i USA (som signalerat att det inte blir mer stimulanser), från ECB (som signalerat om låg tillväxt i EU), från Spanien, som flaggar för förestående kris (värre ändå). Detta påverkar konsumtionsförväntningarna.
Väderleksprognosen (ENSO) har inte uppmärksammats alls, men den indikerar att det kan bli en ordentlig skördefest i sommar.
Odlingsväder
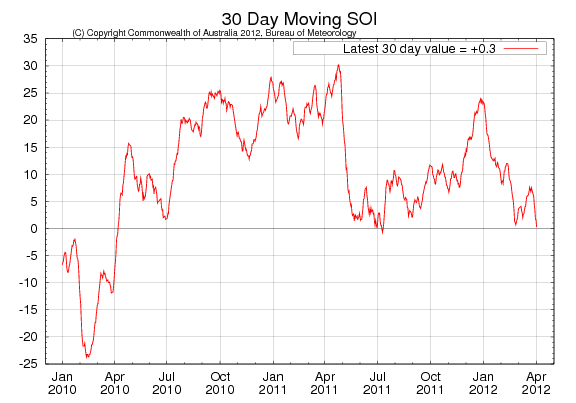
Australiens meteorologiska byrå annonserade förra veckan att ”La Niña reaches its end”. Nedan ser vi Southern Oscillation Index, som mäter ENSO och indikerar La Niña om SOI > +8 och El Niño om SOI < -8. Vi ser att SOI är noll nu.
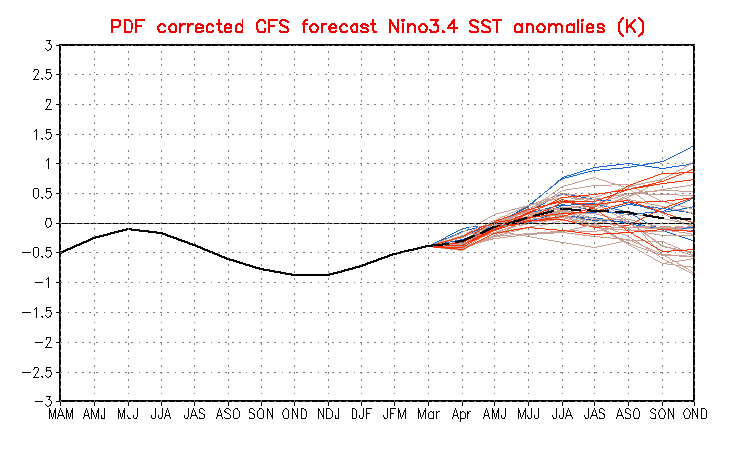
NOAA är inte lika tvärsäkra som Australiensarna, utan säger bara att man når neutrala förhållanden i april (som ju faktiskt just nu betyder ungefär samma sak). NOAA kör två prognosmodeller för ENSO. Nedan ser vi först CFS.v1, som vi ser förutspår neutrala förhållanden från april.
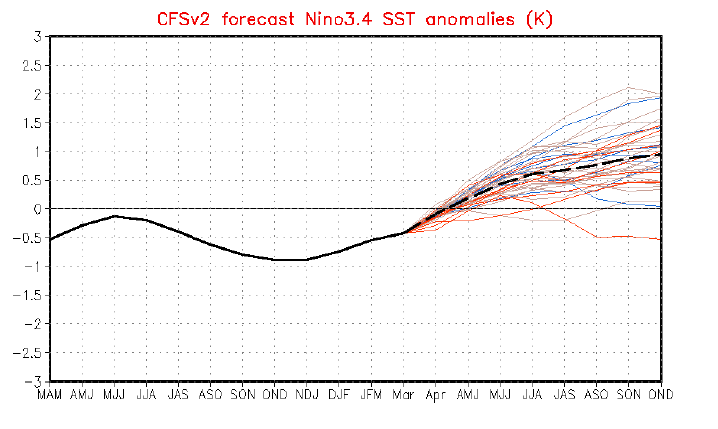
Nedan ser vi den andra modellen, CFS.v2, som också förutspår neutrala ENSO-förhållanden, men är kraftigare på El Niño-sidan för hösten.
För odlingsväder gäller La Niña = dåligt. El Niño = bra.
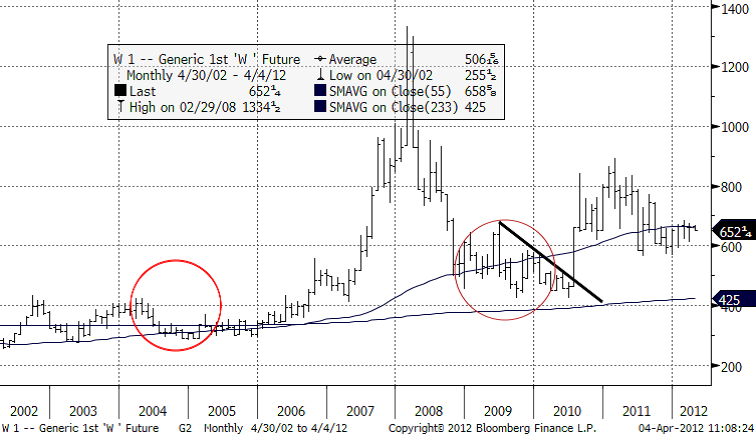
Fru Martell på Martell Crop Projections skriver att det finns en slående likhet med odlingsåren 2004 och 2009. Både 2004 och 2009 började med neutrala ENSO-förhållanden och utvecklade sig senare till El Niño-förhållanden under sommaren.
Utsikterna för vädret är alltså rejält ”bearish”. Nedan ser vi vad som hände med vetepriset i Chicago 2004 och 2009.
Vete
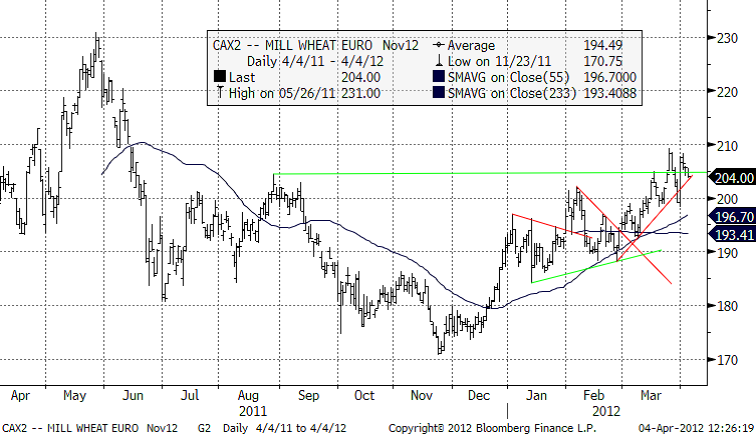
Matifs novemberkontrakt förmådde inte nå upp till en ny toppnotering, men den stigande trenden är ännu intakt.
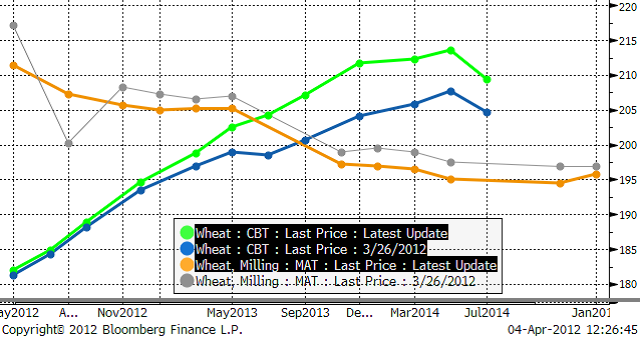
Nedan ser vi terminskurvorna för Chicagovete och Matif-vete. Notera att marknaden på Matif är kraftigt utökad i löptid, vilket gör det möjligt att tillämpa den effektiva ”trappstegsmetoden” för att prissäkra variation i priser över flera år.
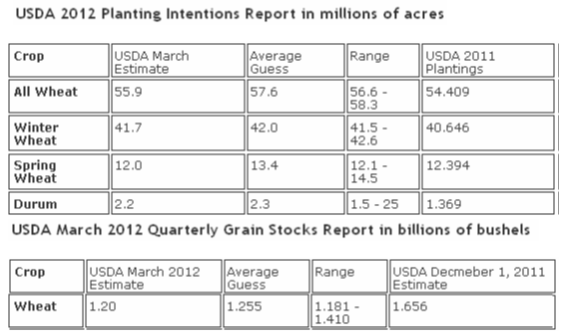
USDA:s efterlängtade prospective planting rapport visar att arealen för vete (alla sorter) under 2012 förväntas uppgå till 55.9 miljoner acres (ca 23 miljoner hektar), en ökning med 3 procent från förra året. Arealen för höstvete på 41.7 miljoner acres (ca 17 miljoner hektar) är en ökning med 3 procent från förra året, men en minskning med 1 procent från tidigare prognos. Arealen för vårvete minskar däremot med 3 procent till 12 miljoner acres (ca 4,9 miljoner hektar).
Lagren av vete per den 1 mars 2012 uppgick till 1.20 miljarder bushels, en minskning med 16 procent från samma tidpunkt förra året.
Arealen för vete på 55.9 kom in under det förväntade nivåintervallet på 56.6-58.3, då lantbrukare i de norra regionerna, t.ex North Dakota och South Dakota, väljer att odla majs istället för vårvete. Estimatet var dessutom ca 2 miljoner lägre än prognosen på 58 som USDA kom ut med på Outlook Forum 2012 i slutet på februari.
Även lagernivån kom in under den genomsnittliga förväntade nivån på 1.255 bbu.
Rapporten fick vetepriserna att rusa och CBOT vete Maj12 stängde på 6.60 ¾ – upp 48 ¼ cent.
Matif kvarnvete Maj12 stängde på 212.75 – upp 5.50 EUR medan fodervete Maj12 på Liffe stängde på 174.75 GBP – upp 3.75 GBP.
 På den internationella marknaden har Argentina bekräftat sin återkomst som prisledande på vete genom att vinna sin första order under 2012 från Egyptens GASC, och med ett pris under de som erbjöds från Svarta Havet, Europa och de flesta från USA, trots högre fraktkostnader. GASC bekräftar att de, vid sin tredje upphandling under mars månad, har köpt 60 000 ton argentinskt vete och 60 000 ton amerikanskt vete.
[ Vinnande bud; USA; 262.84$/t + frakt 26.50$/t från Toepfer I Argentina; 259.45$/t + frakt 30.31$/t från Cargill ]
Det argentinska vetet var betydligt billigare än det franska som håller ett högt ett pris förstärkt av rädsla för konsekvenserna av den köldknäpp som drabbade Europa i februari och dess påverkan på utbudet. Priset på det argentinska vetet var också lägre än det ryska/ukrainska som dominerade marknaden den sista halvan av 2011. Priset på det ryska vetet har påverkats av utarmningen på tillgång av vete i närheten av hamnar och för Ukrainas del är utsikterna för kommande skörd mindre bra efter höstens torka och vinterns kyla vilket gör lantbrukare mindre benägna att sälja och istället avvakta i en förhoppning om högre priser på den lokala marknaden.
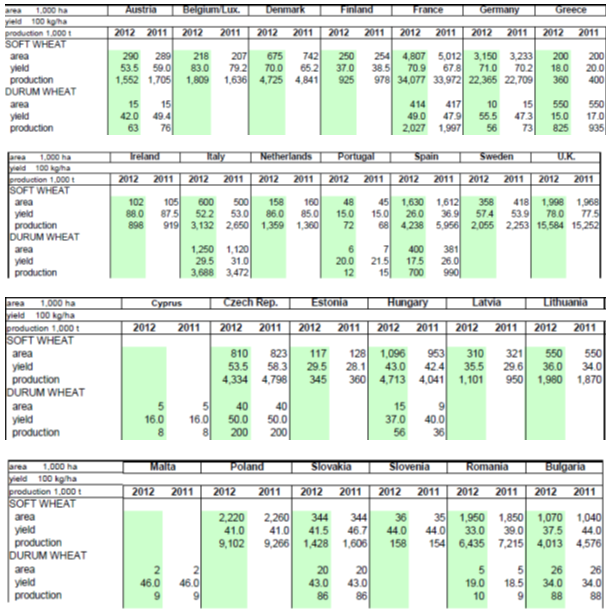
I sin första prognos för 2012/13 sänker Coceral sitt estimat för Europas produktion av vete till 126,76 mt, en minskning med 2.7 mt jämfört med året innan och det är också ett estimat som ligger under Europeiska kommissionens prognos förra månaden på 133 mt och också under Strategie Grains estimat på 131.1 mt.
I Tyskland förväntas produktion uppgå till 22.37 mt, en minskning med 340 000 ton från föregående år.
Prognosen för Spanien har också justerats ned pga av den svåra torkan och landets veteproduktion estimeras till 4.2 mt, en nedgång med 29%. Frankrikes veteproduktion estimeras till 34.08 mt och landets totala spannmålsskörd, Europas största, förväntas uppgå till 64.7 mt, en ökning med 1.7 mt YoY, till stor del beroende på ökad produktion av vårkorn. Storbritanniens veteproduktion förväntas öka med ca 330 000 ton till ett fyraårs högsta på 15.58 mt.
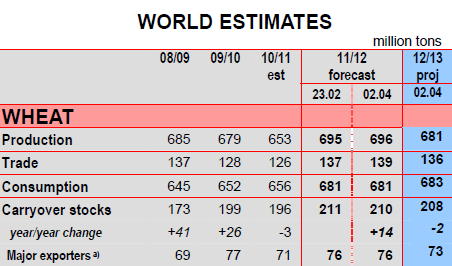
IGC skriver i sin rapport att den globala vete produktionen för 2012/13 förväntas uppgå till 681 mt, en minskning med 15 mt från förra årets rekordproduktion, till följd av en minskning i den genomsnittliga avkastningen. Produktionen kan komma att bli lägre i Australien, Kazakstan, Marocko och Ukraina, men förväntas däremot att bli bättre i Nordamerika och Ryssland. Den globala konsumtionen förväntas stiga endast marginellt, där ökningar inom livsmedelsindustri och industriell användning delvis kompenseras av en minskad foderefterfrågan. Trots detta förväntas efterfrågan på foder att ligga kvar på en relativt hög nivå.
Globala lager förväntas sjunka tillbaka från förra årets topp, men tillgången förväntas vara stabil, även hos de största exportörerna.
Vi fortsätter att ha en negativ vy på i synnerhet Matifs terminspriser och då särskilt de med kort löptid, de med leverans det närmaste året.
Maltkorn
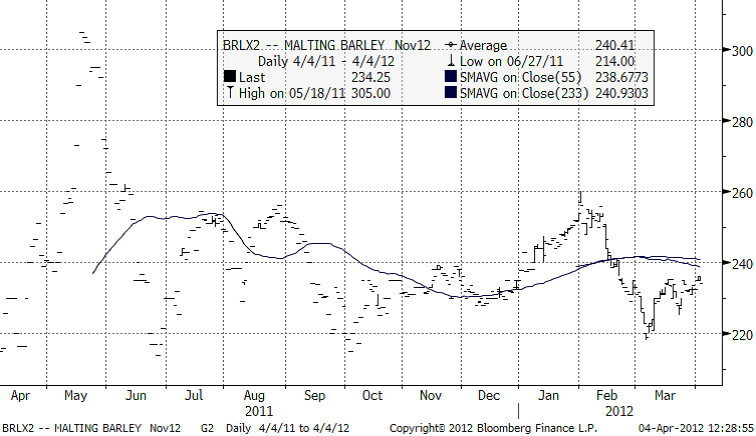
Novemberkontraktet på maltkorn ligger fortfarande under glidande medelvärden och det brukar tolkas negativt.
Potatis
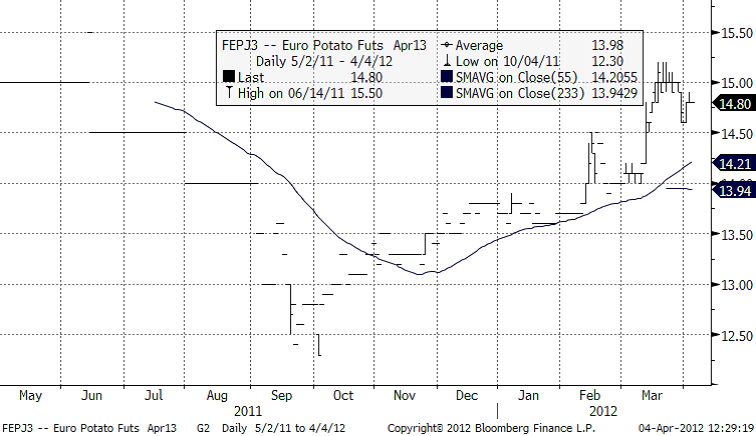
Priset på industripotatis för leverans nästa år har rekylerat något lite.
Majs
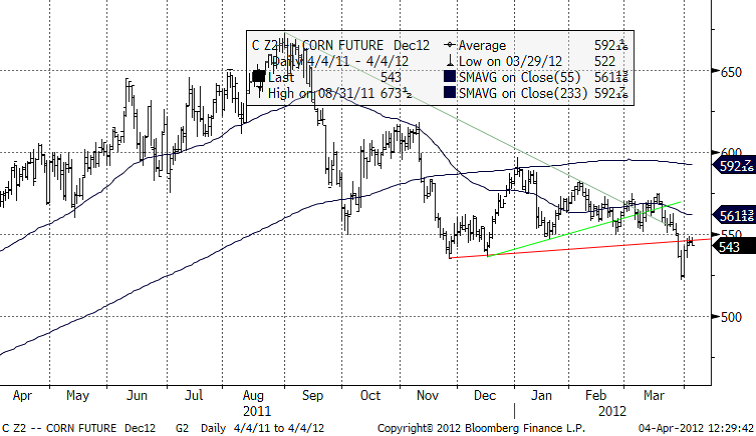
Majspriset som bröt ur konsolideringsfasen och föll kraftigt, hämtade sedan tillbaka förlorad mark. Rekylen gick upp till utbrottsnivån igen. Detta är klassiskt. Det är vår chans, vi som missade utbrottet, att sälja. Decembermajs bör kunna fall till 500 cent.
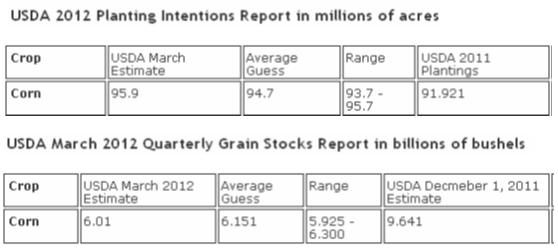
USDA:s rapport visar att arealen för majs under 2012 förväntas uppgå till 95.9 miljoner acres (ca 39 miljoner hektar), en ökning med 4 procent från förra året och en ökning med 9 procent från 2010. Om detta stämmer, blir detta den största arealen (en yta större än Japan) för majs sedan 1937 då uppskattningsvis 97.2 miljoner hektar odlades.
Lagren av majs per den 1 mars 2012 uppgick till 6.01 miljarder bushels, en minskning med 8 procent från samma tidpunkt förra året.
Arealen för majs på 95.9 kom in över det förväntade nivåintervallet på 93.7.6-95.7, då lantbrukare nu laddar för en rekordstor majsodling i USA till följd av höga attraktiva priser. Estimatet låg också över USDA´s tidgare prognos på 94 från februaris Outlook Forum. Majspriset har hållit sig på en stadig hög nivå till följd av tighta lager och USDA´s lagernivå på 6.01 bbu bekräftar detta.
Man kan säga att rapporten var blandad för majs, bullish pga av låga lagernivåer och bearish pga av en estimerad rekordareal, marknaden var dock mest intresserad av den låga lagernivån och majspriset rusade upp på Chicago och stängde på 6.44 usd, upp 40 cent.
Nu gäller det dock att lantbrukarna har vädrets makter på sin sida resten av säsongen. Den ovanligt varma vintern och den tidiga våren gjorde att sådden startade tidigare på sina ställen och ett fall i temperaturen nu skulle kunna orsaka skada.
Argentinas Jordbruksministerium har snävat till sin prognos för landets majsproduktion under 2011/12 till 21.2 mt från det tidigare intervallet på 20.5-22mt, vilket också är en nedgång från produktionen på 23 mt förra säsongen.
Den estimerade produktionen är fortfarande relativt hög men långt ifrån de första prognostiserade förväntningarna på 30 mt. Argentina är världens näst största majsexportör och skörden pågår nu för fullt.
Enligt Buenos Aires Grain Exchange förväntas landets majsproduktion för 2011/12 att uppgå till ca 20.8 mt, betydligt lägre än de ursprungliga förväntningarna på ungefär 30 mt. Det varma vädret och torkan är anledningen till nedjusteringen.
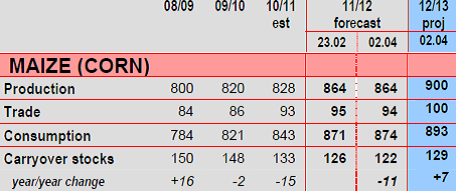
IGC kom med sin rapport i måndags och skriver där att utsikterna för utbud och efterfrågan på majs beräknas vara fortsatt tighta under 2012/13 men en ökad produktion, framförallt i USA, kommer att tillgodose efterfrågan och ge utrymme för en blygsam ökning av lagernivån. Tack vare gynnsamma priser och god potentiell avkastning förväntas den totala produktionen att nå en all-time-high och baserat på normala väderförhållanden och genomsnittlig avkastning beräknas den globala majsproduktionen för 2012/13 att uppgå till 900mt, en ökning med 4.2% jämfört med förra året. En stigande efterfrågan på kött kommer att ge stöd till ökad foderanvändning, men konkurrensen från fodervete och korn kommer återigen att vara en faktor. Tillväxten i industriell användning kommer sannolikt att vara lägre än tidigare år; stärkelseproduktionen i Kina kommer att öka ytterligare, men den amerikanska etanolproduktionen förväntas sjunka pga minskad inhemsk efterfrågan samt minskad export.
Globala lager förväntas öka något då ökad produktion i USA mer än väl kompenserar nedgången i Kina och Brasilien.
Sojabönor
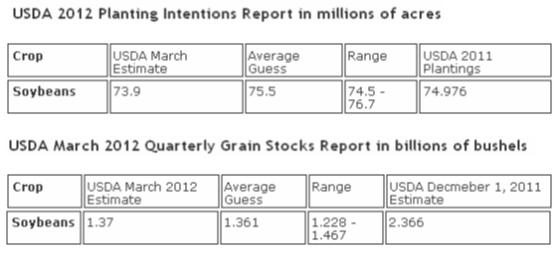
USDA:s rapport visar att arealen för sojabönor under 2012 förväntas uppgå till 73.9 miljoner acres (ca 30 miljoner hektar), en minskning med 1 procent från förra året och en minskning med 5 procent från 2010.
Lagren av sojabönor per den 1 mars 2012 uppgick till 1.37 miljarder bushels, en ökning med 10 procent från samma tidpunkt förra året.
Priset på sojabönor har behållit sin styrka under året i takt med att analysfirmor har justerat ned sina estimat för produktionen av sojabönor i Brasilien och Argentina pga torka under södra halvklotets sommar i december och januari.
Brasilianska AgRural sänker nu sin prognos för landets produktion av sojabönor under 2011/12 till 66.68 mt, ned 1.9% från tidigare estimat på 68 mt som kom i februari och en nedjustering med 11.5% jämfört med 2010/11. Förra årets skörd var 75.3 mt och innan torkan slog till i södra Brasilien trodde man att skörden skulle bli 73.1 mt. Sojaodlare i Brasilien, den näst största producenten efter USA, har skördat 69% per den 30 mars, enligt en emailad rapport från AgRural Commodities Agricolas. Det är i nivå med förra årets 70% samma tid.
USDA beräknar i sin senaste prognos att Brasiliens produktion kommer att uppgå till 68.5 miljoner ton. Detta ter sig nu alltså något högt.
Buenos Aires Grain Exchange justerade ner sin prognos för Argentinas produktion av sojabönor för 2011/12 till 45 mt, en minskning med 1.2 mt sedan veckan innan och en minskning med 8.5% jämfört med 2010/11 till följd av väderrelaterat (torka) bortfall i de norra regionerna och den senaste tidens köldknäpp.
Rosario Grain Exchange kvarstår på 44.5 mt.
Argentinas Jordbruksministerium snävar till sitt estimat för landets produktion av sojabönor för 2011/12 till 44 mt jämfört med sin tidigare prognos med intervallet 43.5-45 mt, vilket också är en minskning från förra årets 49 mt.
Argentinska Lartirigoyen justerar ned sin prognos för landets produktion av sojabönor till 42.6 mt från tidigare 45.5 mt.
Argentina är världens största exportör av av sojamjöl, som används som djurfoder, och sojaolja, som används till matlagning och biobränslen. Landet är också världens tredje största exportör av sojabönor, efter Brasilien och USA. Skörden av sojabönor i Argentina går framåt och 5,4% av skörden är avklarad jämfört med förra veckans 3.4%. USDA beräknar Argentinas produktion till 46.5 mt.
Paraguays produktion av sojabönor estimeras nu till 3.7 mt till jämfört med tidigare prognoser på 8-8.5 mt.
OilWorld sa i förra veckan att den globala produktionen av sojabönor kommer att sjunka med 22-23 mt den här säsongen och därmed minska till 242.9 mt till följd av en minskad produktion i Sydamerika (-16 mt) och USA (-7 mt). Produktionen i Sydamerika förväntas sjunka till 120.6 mt jämfört med 136.5 mt under 2010/11.
Brasiliens produktion justeras ned till 66,5 mt, från den tidigare prognosen på 70 mt i januari och betydligt lägre än förra årets 75.32 mt. men skulle kunna falla till så lågt som till 64.5 mt till följd av torka i de södra regionerna Rio Grande do Sul, Santa Catarina och Parana samt skador orsakade av asiatisk rostsvamp i Mato Grosso.
Torkan i Rio Grande do Sul anses vara den värsta på många år och skadorna från rostsvampen den värsta på 5 år.
Argentinas produktion justeras ned till 46.5 mt från 49.2 mt.
USDA uppskattar en minskning med 21 MT, men då kvarstår estimaten för Brasilien på 68.5 mt och Argentina på 46.5 mt.
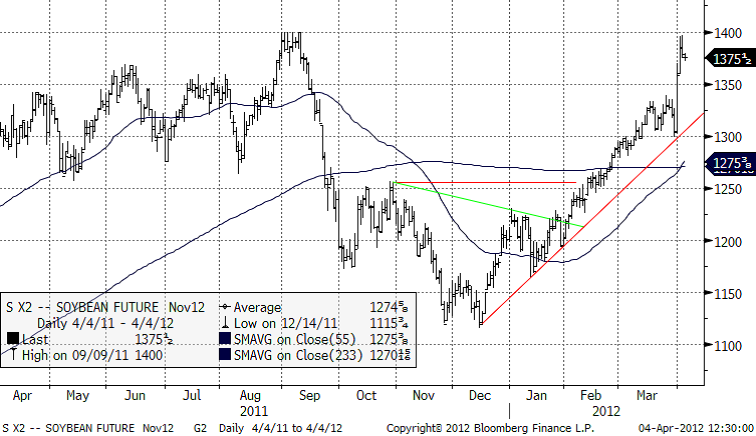
Nedan ser vi kursdiagrammet för novemberleverans av sojabönor på CBOT. 1400 cent / bushel som tidigare verkat som ett motstånd för vidare uppgång, gjorde det även den är gången.
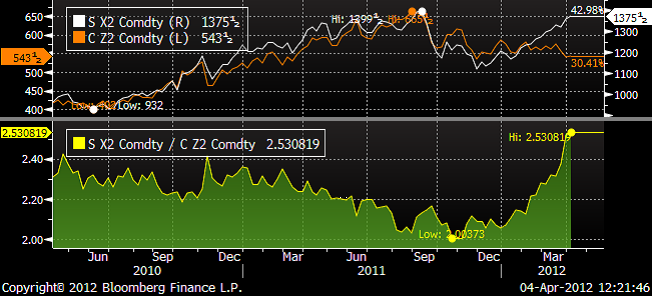
Debatten om arealens storlek för sojabönorna pågår för fullt. Sojabönorna har nått den nivå där det är lönsamt att byta från majs till bönor. Många bönder har dock redan gödslat för att odla majs. Detta verkar som en dämpande effekt i bytet till bönor. I USA gödslar man när man har tid och det är före sådd, trots att det blir stora gödselförluster. Nedan ser vi kvoten mellan priset på novemberterminen på sojabönor dividerat med priset på majs med leverans i december.
Detta gör att sojabönor kan ha nått sin toppnotering. Det stöds även av den tekniska analysen, där 1400 är ett starkt motstånd.
Raps
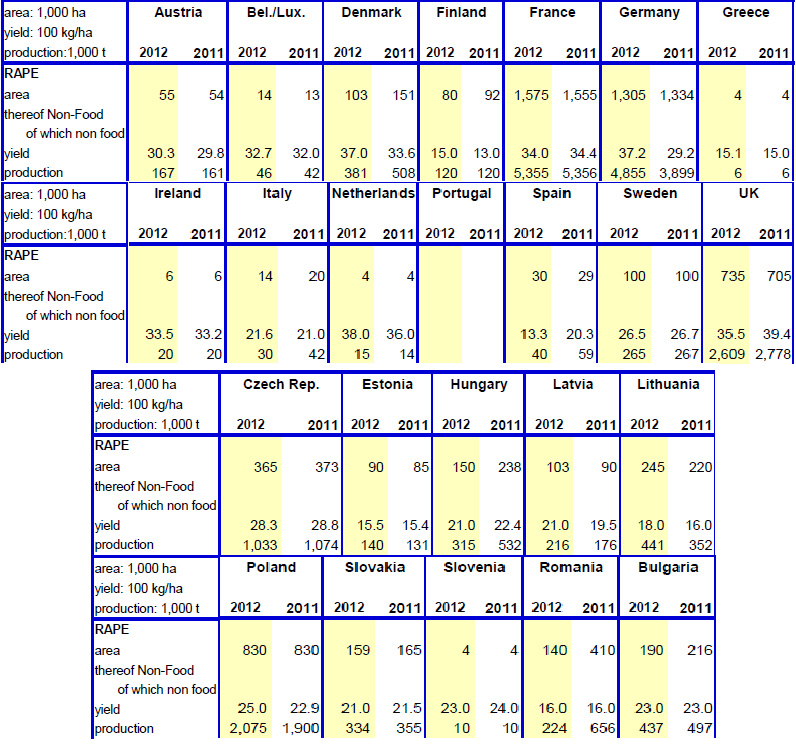
Coceral estimerar att Europas rapsproduktion kan komma att öka till 19.1 mt från 18.95 mt. Trots en återgång till en mer normal avkastning förväntas Storbritanniens produktion att uppgå till 2,6 mt, Tysklands produktion förväntas öka med 1 mt jämfört med förra året och den franska produktionen förväntas bli i stort sett oförändrad.
Oilseeds Crop Forecast March 2012
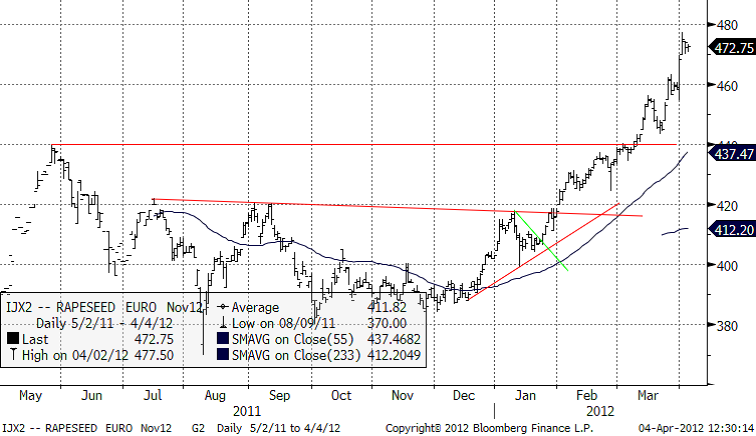
Nedan ser vi kursdiagrammet för novemberkontraktet.
Vi fortsätter att ha en neutral vy.
Gris
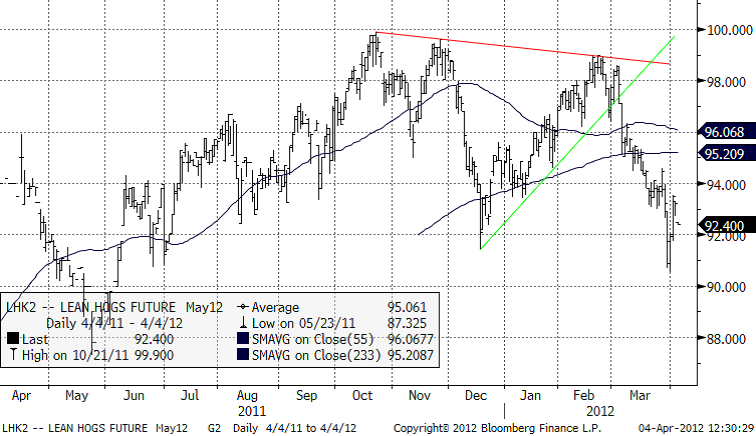
Den senaste veckan är terminskontrakten näst intill oförändrade i pris. Däremot har det varit mycket stora rörelser, med kursfall ner mot 90-cent och sedan en snabb uppgång. Trenden är dock alltjämt nedåtriktad.
[box]SEB Veckobrev Jordbruksprodukter är producerat av SEB Merchant Banking och publiceras i samarbete och med tillstånd på Råvarumarknaden.se[/box]
Disclaimer
The information in this document has been compiled by SEB Merchant Banking, a division within Skandinaviska Enskilda Banken AB (publ) (“SEB”).
Opinions contained in this report represent the bank’s present opinion only and are subject to change without notice. All information contained in this report has been compiled in good faith from sources believed to be reliable. However, no representation or warranty, expressed or implied, is made with respect to the completeness or accuracy of its contents and the information is not to be relied upon as authoritative. Anyone considering taking actions based upon the content of this document is urged to base his or her investment decisions upon such investigations as he or she deems necessary. This document is being provided as information only, and no specific actions are being solicited as a result of it; to the extent permitted by law, no liability whatsoever is accepted for any direct or consequential loss arising from use of this document or its contents.
About SEB
SEB is a public company incorporated in Stockholm, Sweden, with limited liability. It is a participant at major Nordic and other European Regulated Markets and Multilateral Trading Facilities (as well as some non-European equivalent markets) for trading in financial instruments, such as markets operated by NASDAQ OMX, NYSE Euronext, London Stock Exchange, Deutsche Börse, Swiss Exchanges, Turquoise and Chi-X. SEB is authorized and regulated by Finansinspektionen in Sweden; it is authorized and subject to limited regulation by the Financial Services Authority for the conduct of designated investment business in the UK, and is subject to the provisions of relevant regulators in all other jurisdictions where SEB conducts operations. SEB Merchant Banking. All rights reserved.
Analys
Crude oil soon coming to a port near you

Rebounding along with most markets. But concerns over solidity of Gaza peace may also contribute. Brent crude fell 0.8% yesterday to $61.91/b and its lowest close since May this year. This morning it is bouncing up 0.9% to $62.5/b along with a softer USD amid positive sentiment with both equities and industrial metals moving higher. Concerns that the peace in Gaza may be less solid than what one might hope for also yields some support to Brent. Bets on tech stocks are rebounding, defying fears of trade war. Money moving back into markets. Gold continues upwards its strong trend and a softer dollar helps it higher today as well.

US crude & products probably rose 5.6 mb last week (API) versus a normal seasonal decline of 2.4 mb. The US API last night partial and thus indicative data for US oil inventories. Their data indicates that US crude stocks rose 7.4 mb last week, gasoline stocks rose 3.0 mb while Distillate stocks fell 4.8 mb. Altogether an increase in commercial crude and product stocks of 5.6 mb. Commercial US crude and product stocks normally decline by 2.4 mb this time of year. So seasonally adjusted the US inventories rose 8 mb last week according to the indicative numbers by the API. That is a lot. Also, the counter seasonal trend of rising stocks versus normally declining stocks this time of year looks on a solid pace of continuation. If the API is correct then total US crude and product stocks would stand 41 mb higher than one year ago and 6 mb higher than the 2015-19 average. And if we combine this with our knowledge of a sharp increase in production and exports by OPEC(+) and a large increase in oil at sea, then the current trend in US oil inventories looks set to continue. So higher stocks and lower crude oil prices until OPEC(+) switch to cuts. Actual US oil inventory data today at 18:00 CET.
US commercial crude and product stocks rising to 1293 mb in week 41 if last nights indicative numbers from API are correct.

Crude oil soon coming to a port near you. OPEC has lifted production sharply higher this autumn. At the same time demand for oil in the Middle-East has fallen as we have moved out of summer heat and crude oil burn for power for air-conditioning. The Middle-East oil producers have thus been able to lift exports higher on both accounts. Crude oil and condensates on water has shot up by 177 mb since mid-August. This oil is now on its way to ports around the world. And when they arrive, it will likely help to lift stocks onshore higher. That is probably when we will lose the last bit of front-end backwardation the the crude oil curves. That will help to drive the front-month Brent crude oil price down to the $60/b line and revisit the high $50ies/b. Then the eyes will be all back on OPEC+ when they meet in early November and then again in early December.
Crude oil and condensates at sea have moved straight up by 177 mb since mid-August as OPEC(+) has produced more, consumed less and exported more.

Analys
The Mid-East anchor dragging crude oil lower

When it starts to move lower it moves rather quickly. Gaza, China, IEA. Brent crude is down 2.1% today to $62/b after having traded as high as $66.58/b last Thursday and above $70/b in late September. The sell-off follows the truce/peace in Gaze, a flareup in US-China trade and yet another bearish oil outlook from the IEA.

A lasting peace in Gaze could drive crude oil at sea to onshore stocks. A lasting peace in Gaza would probably calm down the Houthis and thus allow more normal shipments of crude oil to sail through the Suez Canal, the Red Sea and out through the Bab-el-Mandeb Strait. Crude oil at sea has risen from 48 mb in April to now 91 mb versus a pre-Covid normal of about 50-60 mb. The rise to 91 mb is probably the result of crude sailing around Africa to be shot to pieces by the Houthis. If sailings were to normalize through the Suez Canal, then it could free up some 40 mb in transit at sea moving onshore into stocks.
The US-China trade conflict is of course bearish for demand if it continues.
Bearish IEA yet again. Getting closer to 2026. Credibility rises. We expect OPEC to cut end of 2025. The bearish monthly report from the IEA is what it is, but the closer we get to 2026, the more likely the IEA is of being ball-park right in its outlook. In its monthly report today the IEA estimates that the need for crude oil from OPEC in 2026 will be 25.4 mb/d versus production by the group in September of 29.1 mb/d. The group thus needs to do some serious cutting at the end of 2025 if it wants to keep the market balanced and avoid inventories from skyrocketing. Given that IEA is correct that is. We do however expect OPEC to implement cuts to avoid a large increase in inventories in Q1-26. The group will probably revert to cuts either at its early December meeting when they discuss production for January or in early January when they discuss production for February. The oil price will likely head yet lower until the group reverts to cuts.
Dubai: The Mid-East anchor dragging crude oil lower. Surplus emerging in Mid-East pricing. Crude oil prices held surprisingly strong all through the summer. A sign and a key source of that strength came from the strength in the front-end backwardation of the Dubai crude oil curve. It held out strong from mid-June and all until late September with an average 1-3mth time-spread premium of $1.8/b from mid-June to end of September. The 1-3mth time-spreads for Brent and WTI however were in steady deterioration from late June while their flat prices probably were held up by the strength coming from the Persian Gulf. Then in late September the strength in the Dubai curve suddenly collapsed. Since the start of October it has been weaker than both the Brent and the WTI curves. The Dubai 1-3mth time-spread now only stands at $0.25/b. The Middle East is now exporting more as it is producing more and also consuming less following elevated summer crude burn for power (Aircon) etc.
The only bear-element missing is a sudden and solid rise in OECD stocks. The only thing that is missing for the bear-case everyone have been waiting for is a solid, visible rise in OECD stocks in general and US oil stocks specifically. So watch out for US API indications tomorrow and official US oil inventories on Thursday.
No sign of any kind of fire-sale of oil from Saudi Arabia yet. To what we can see, Saudi Arabia is not at all struggling to sell its oil. It only lowered its Official Selling Prices (OSPs) to Asia marginally for November. A surplus market + Saudi determination to sell its oil to the market would normally lead to a sharp lowering of Saudi OSPs to Asia. Not yet at least and not for November.
The 5yr contract close to fixed at $68/b. Of importance with respect to how far down oil can/will go. When the oil market moves into a surplus then the spot price starts to trade in a large discount to the 5yr contract. Typically $10-15/b below the 5yr contract on average in bear-years (2009, 2015, 2016, 2020). But the 5yr contract is usually pulled lower as well thus making this approach a moving target. But the 5yr contract price has now been rock solidly been pegged to $68/b since 2022. And in the 2022 bull-year (Brent spot average $99/b), the 5yr contract only went to $72/b on average. If we assume that the same goes for the downside and that 2026 is a bear-year then the 5yr goes to $64/b while the spot is trading at a $10-15/b discount to that. That would imply an average spot price next year of $49-54/b. But that is if OPEC doesn’t revert to cuts and instead keeps production flowing. We think OPEC(+) will trim/cut production as needed into 2026 to prevent a huge build-up in global oil stocks and a crash in prices. But for now we are still heading lower. Into the $50ies/b.
Analys
More weakness and lower price levels ahead, but the world won’t drown in oil in 2026

Some rebound but not much. Brent crude rebounded 1.5% yesterday to $65.47/b. This morning it is inching 0.2% up to $65.6/b. The lowest close last week was on Thursday at $64.11/b.

The curve structure is almost as week as it was before the weekend. The rebound we now have gotten post the message from OPEC+ over the weekend is to a large degree a rebound along the curve rather than much strengthening at the front-end of the curve. That part of the curve structure is almost as weak as it was last Thursday.
We are still on a weakening path. The message from OPEC+ over the weekend was we are still on a weakening path with rising supply from the group. It is just not as rapidly weakening as was feared ahead of the weekend when a quota hike of 500 kb/d/mth for November was discussed.
The Brent curve is on its way to full contango with Brent dipping into the $50ies/b. Thus the ongoing weakening we have had in the crude curve since the start of the year, and especially since early June, will continue until the Brent crude oil forward curve is in full contango along with visibly rising US and OECD oil inventories. The front-month Brent contract will then flip down towards the $60/b-line and below into the $50ies/b.
At what point will OPEC+ turn to cuts? The big question then becomes: When will OPEC+ turn around to make some cuts? At what (price) point will they choose to stabilize the market? Because for sure they will. Higher oil inventories, some more shedding of drilling rigs in US shale and Brent into the 50ies somewhere is probably where the group will step in.
There is nothing we have seen from the group so far which indicates that they will close their eyes, let the world drown in oil and the oil price crash to $40/b or below.
The message from OPEC+ is also about balance and stability. The world won’t drown in oil in 2026. The message from the group as far as we manage to interpret it is twofold: 1) Taking back market share which requires a lower price for non-OPEC+ to back off a bit, and 2) Oil market stability and balance. It is not just about 1. Thus fretting about how we are all going to drown in oil in 2026 is totally off the mark by just focusing on point 1.
When to buy cal 2026? Before Christmas when Brent hits $55/b and before OPEC+ holds its last meeting of the year which is likely to be in early December.
Brent crude oil prices have rebounded a bit along the forward curve. Not much strengthening in the structure of the curve. The front-end backwardation is not much stronger today than on its weakest level so far this year which was on Thursday last week.

The front-end backwardation fell to its weakest level so far this year on Thursday last week. A slight pickup yesterday and today, but still very close to the weakest year to date. More oil from OPEC+ in the coming months and softer demand and rising inventories. We are heading for yet softer levels.

-

 Nyheter3 veckor sedan
OPEC+ missar produktionsmål, stöder oljepriserna
-

 Nyheter3 veckor sedan
Ett samtal om guld, olja, fjärrvärme och förnybar energi
-

 Nyheter2 veckor sedan
Guld nära 4000 USD och silver 50 USD, därför kan de fortsätta stiga
-

 Analys3 veckor sedan
Are Ukraine’s attacks on Russian energy infrastructure working?
-

 Nyheter1 vecka sedan
Goldman Sachs höjer prognosen för guld, tror priset når 4900 USD
-

 Nyheter2 veckor sedan
Blykalla och amerikanska Oklo inleder ett samarbete
-

 Nyheter4 veckor sedan
Guldpriset uppe på nya höjder, nu 3750 USD
-

 Nyheter2 veckor sedan
Ett samtal om guld, olja, koppar och stål


