

Analys
SEB Jordbruksprodukter, 3 november 2014


 Priset på sojamjöl för omedelbar leverans fortsatte att stiga kraftigt i veckan, +11%, vilket drog med sig sojabönorna. Det var uppåt även för majs och vete. Marknadens förhoppningar om att den nya skörden av sojabönor skulle råda bot på bristen som rådde under förra året har kommit på skam. Skörden har varit sen och även om den är rekordstor, har det varit svårt att ordna transport bort från gården. USA:s framgångar med fracking gör att lokomotiven är upptagna med att frakta bort oljan.
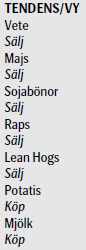
Riksbanken sänkte sin styrränta till noll i veckan som gick. Om man jämför, hade detta en liten effekt på den svenska kronans växelkurs. Det har varit en hel del valutarörelser den senaste tiden och de verkar höra ihop med effektiviteten i ekonomierna som valutorna representerar och förtroendet för den politiska ledningens förmåga att bedriva tillväxtfrämjande ekonomisk politik. Den svenska kronan har sedan marknaden stängde fredagen den 12 september, gått från 9.23 kronor per Euro till 9.38 som dyrast för en Euro, i tisdags. Senare under veckan föll växelkursen tillbaka och stängde på 9.26. Dollarn är väldigt stark mot kronan och har gått från 7.12 till 7.40 sedan den 12 september. Dollarn har varit stark mot de flesta valutor. Tillväxten är stark i USA.
Efter valet i Brasilien, föll en BRL från 2.95 kr till 2.80 på måndagen. Därefter har valutan återhämtat sig och var i måndags uppe på 3.05 kr, men stängde på 2.99 i fredags, dvs det har inte varit några stora förändringar. Det mesta av förändringen i växelkursen skedde under upptakten till valet.
Den ryska rubeln har tappat 23% mot dollarn sedan månadsskiftet juni/ juli. Valutafallet hejdades temporärt i torsdags, men tog ny fart på fredagen.
Odlingsväder
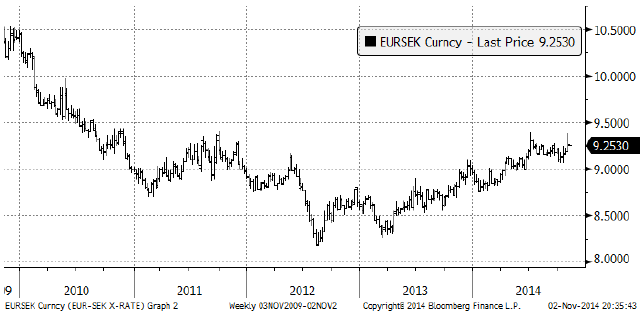
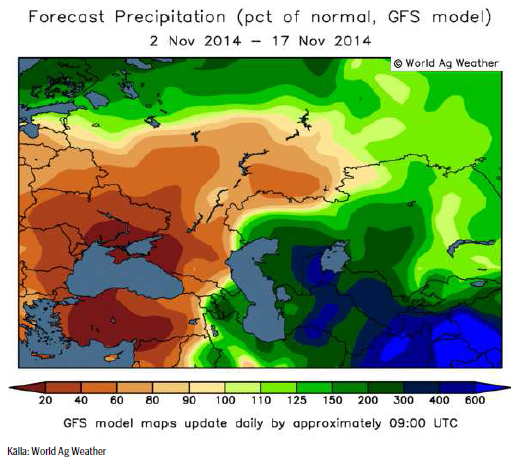
Efter att ha varit torrt i prognosen för Frankrike och Spanien, ser vi nu en tvåveckors prognos med extra mycket nederbörd där, upp till 300% av normal nederbörd. Tyskland, Polen och Östeuropa, samt området runt Svarta havet får torrt väder, ner till 40% av normal nederbörd nära Svarta Havet. Hela Norden och England, som även i förra veckans prognos hade 200-300% av normal nederbörd, väntas få detta även de kommande två veckorna. Vi noterar också att Nordafrika väntas få del av Spaniens och Frankrikes blöta väder. Hela norra Italien och sydöstra Frankrike väntas få upp till 6 gånger så mycket regn som normalt. Det kommer vi säkert att få höra mer om i den ordinarie nyhetsrapporteringen.
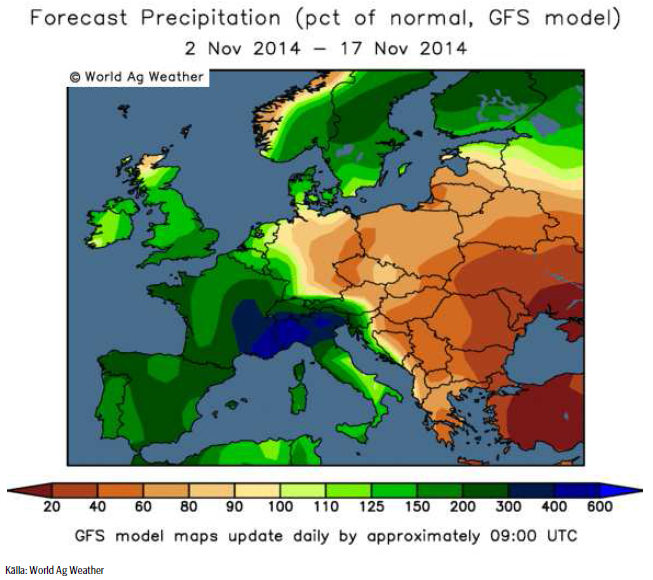
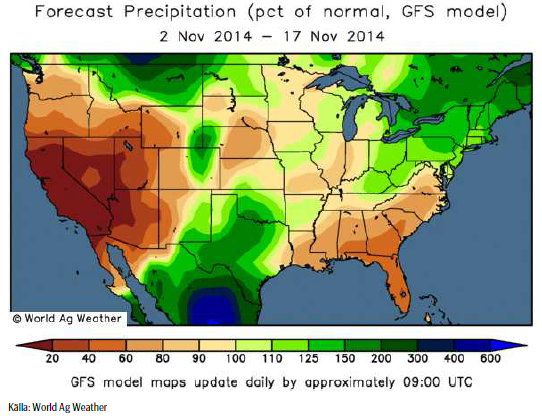
Prognoskartan för nederbörden i USA visar fortsatt torrt väder i ’corn belt’. Texas och Mexiko är blötare än normalt. Kalifornien vänas få 20% av normal nederbörd, även de norra delarna av delstaten.
Det blev en kort episod av blötare väder för Ryssland, Ukraina och västra Asien. Tvåveckorsprognosen visar ännu torrare väder än förra gången det var torrt. Södra Ryssland och Ukraina väntas få mindre än 20% av normal nederbörd.
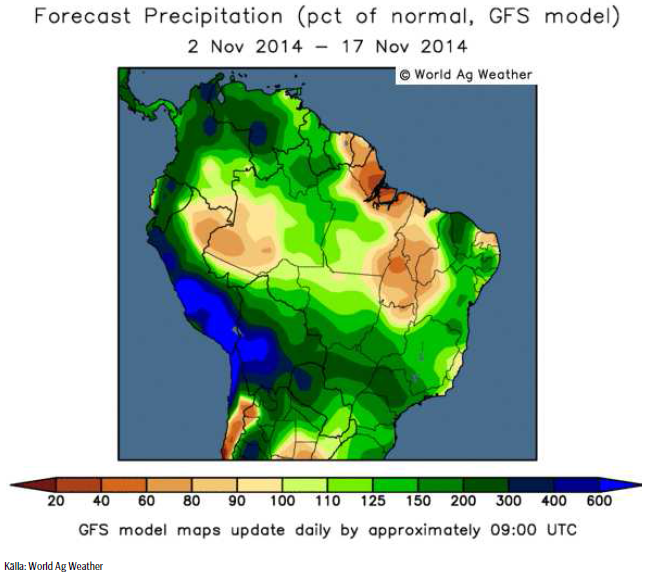
Brasilien ser nu riktigt blött ut i den senaste tvåveckorprognosen. Alla viktiga odlingsområden för soja, majs, vete, kaffe och socker väntas få upp 150 – 300% av normal nederbörd.
Indiens väder väntas fortsätta vara blötare än normalt i öster och torrare än normalt i väster. Australien väntas få normal nederbörd, i vissa odlingsområden något mindre än normalt, de kommande två veckorna.
Vete
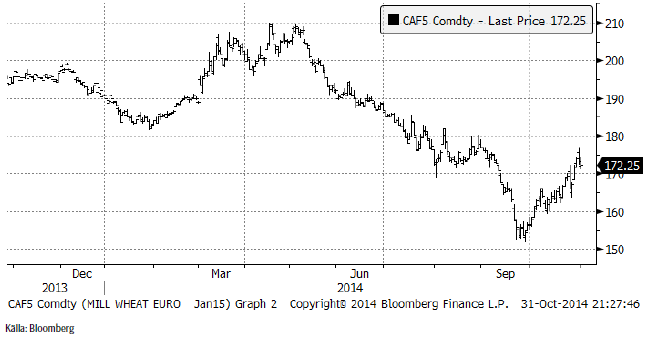
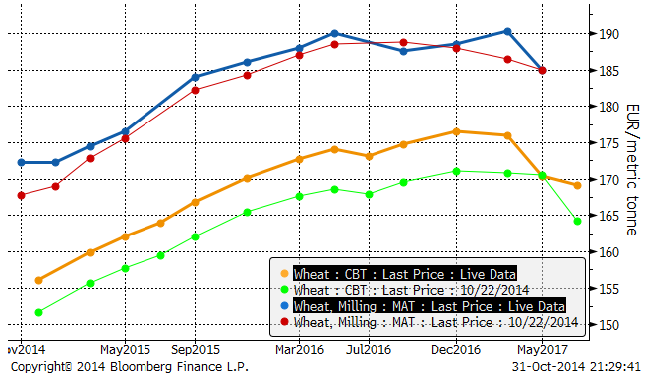
Vetepriset (novemberterminen på Matif) stängde på 172.25, som är exakt samma nivå som januarikontraktet stängde på i fredags. GASC köpte 60 kt franskt vete under helgen till 260 dollar (208 euro per ton, inklusive frakt).
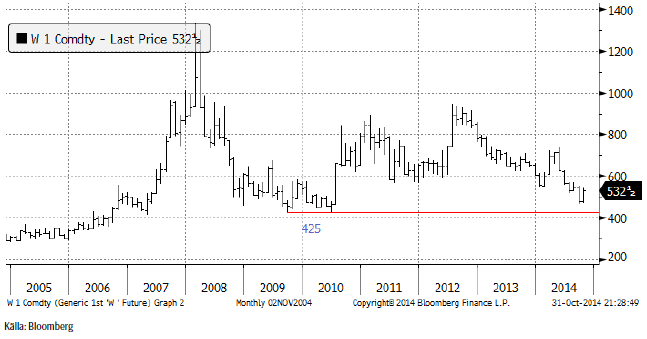
Chicagovetet (december) har återhämtat sig den senaste månaden, men utan att den tekniska bilden har förändrat sig. Pristrenden är fortfarande nedåtriktad, men med ett starkt stöd på 425. Priset stängde på 532 cent i fredags. I veckan kom säsongens första crop ratings för det nya höstvetet. 59% var i good/excellent condition, vilket bara är 2% lägre än förra året.
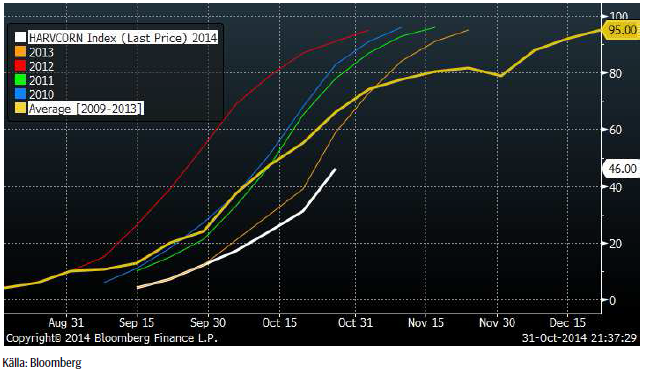
Nedan ser vi terminskurvorna i fredags och en vecka tidigare för Matif respektive Chicago. Det är contango på båda marknader.
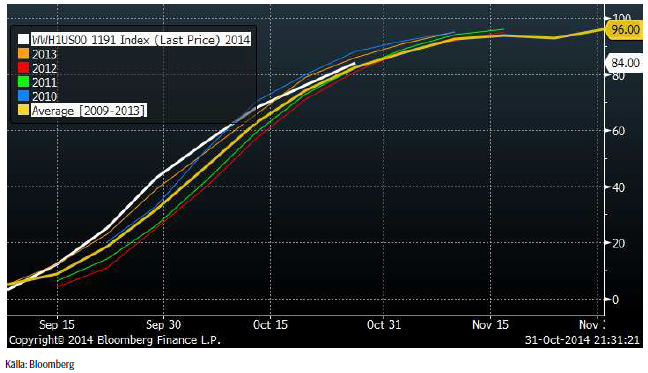
Sådden av höstvete har avancerat till 84% färdigt.
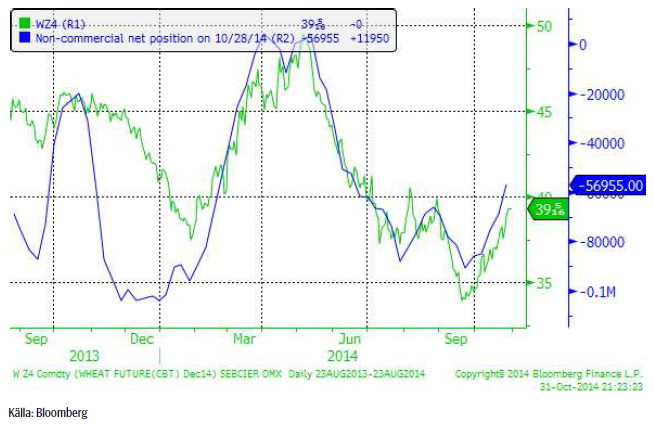
Non-commercials i CFTC:s rapport köper tillbaka den korta positionen i allt snabbare takt. I veckan köpte de netto 12,000 kontrakt och har minskat den sålda positionen till netto en såld position med 57,000 kontrakt. Som mest var det drygt 90,000 kontrakt sålda.
Veckans största nyhet var den månatliga rapporten från International Grains Council som kom i torsdags den 30 oktober. IGC höjde estimatet för global veteproduktion med 0.1% till 718 mt. IGC anser att produktionen 2014/15 trots uppgraderingar av spannmålsskörden i USA och i EU, fortfarande är mindre än förra årets rekord.
Skörden av vete i Australien håller precis på att börja. USDA:s jordbruksattaché i Canberra, Australien, estimerar att veteskörden i Australien blir 24 mt. Det är lägre än de 25 mt som USDA angav i den senaste WASDE-rapporten för tre veckor sedan. IGC:s rapport är också baserad på 24 mt i produktion. Orsaken till den lägre produktionen är den torka vi har rapporterat om. Vi har sagt att skörden kan bli ännu lägre och är inte ensamma om det. Rabobank estimerar den till 23 mt och mäklarfirman RJ O’Brien säger att den kan bli 20-22 mt. Lokala ANZ Bank estimerar skörden till 22-23 mt.
Det börjar utveckla sig till köpläge i vete. Det finns antagligen utrymme för en liten nedgång på kort sikt, men på längre sikt finns en klar uppsidespotential.
Majs
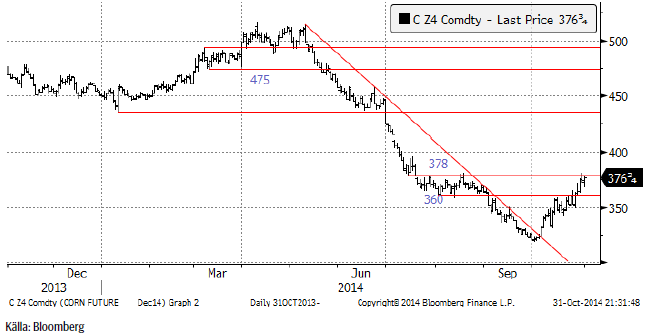
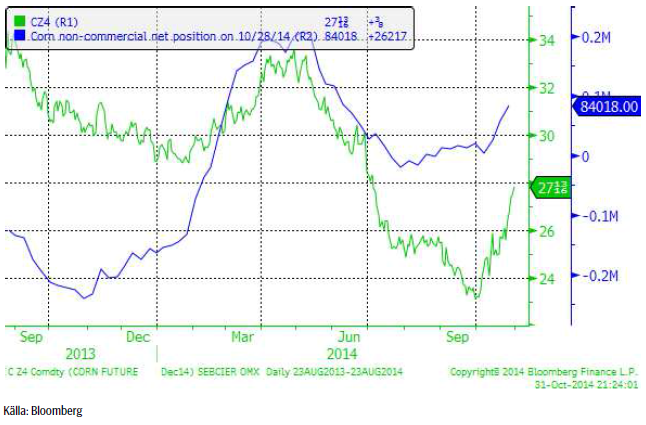
Decemberkontraktet CZ4 fortsatte upp med 7% sedan förra veckan. Priset stängde på 376.75 cent per bushel, som är precis under det tekniska motståndet från juli och augusti på 378 cent.
IGC estimerade i torsdagen rapport att global produktion av majs blir 980 mt, en höjning med 0.6% från förra månadens estimiat på 974 mt.
Skörden av majs accellererade enligt måndagens rapport. 46% var då skördat jämfört med normala 70%.
Etanolproduktionen tog ett ordentligt skutt uppåt, enligt den veckovisa statistiken från US DOE.
Non-commercials köpte 26,000 kontrakt i veckan som gick. De är nu nettoköpta med 84,000 kontrakt.
Sentimentet har blivit tydligt positivt och mycket fortare än någon räknat med. Det borde dock komma en rekyl nedåt och därför behåller vi säljrekommendationen.
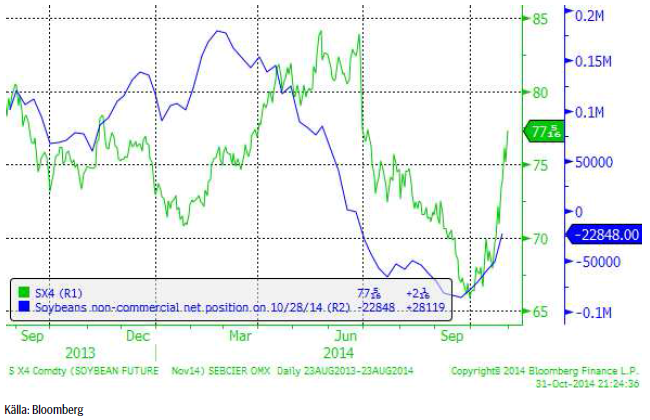
Sojabönor
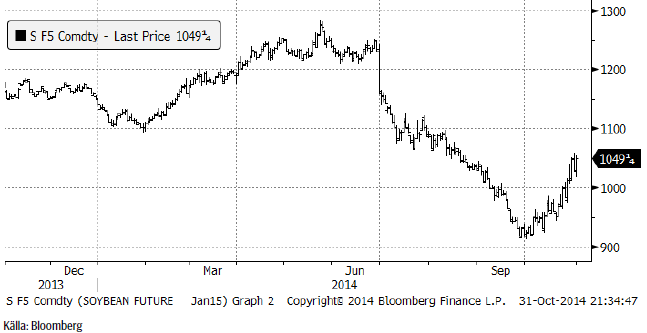
Sojabönorna för leverans i november lämnar vi nu, eftersom de gått in i leveransperioden. Priset har handlats upp våldsamt på dem. Vi tittar nu på januarikontraktet för 2015 (SF5), som inte rusat lika mycket i pris. På 1049 cent per bushel ligger det strax under 1100 som är ett tekniskt motstånd. Det är märkligt att se sojabönor handla så högt, när det efter den senaste WASDE-rapporten egentligen pekade rakt ner för priset. I veckan kom dock den tredje av de tre stora estimerarna i världen (USDA, FAO/AMIS och IGC) med sin rapport: IGC sänkte estimatet för global produktion av sojabönor med 1% till 307 mt. Det är den första rapporten som faktiskt sänker estimatet för global skörd. IGC sänker skörden i Brasilien med 3 mt till 91 mt, därför att det varit lite för torrt i samband med sådden, framförallt i delstaten Mato Grosso. IGC sade att en del fält måste sås om, eftersom torkan gjort att sådden inte slagit rot.
Prisuppgången beror dock troligtvis inte på farhågor för skördad volym, utan verkar bero på att det uppstått en bristsituation av andra skäl.
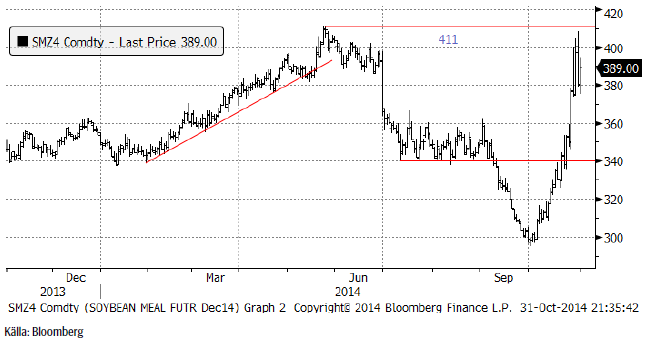
Decemberkontraktet på sojamjöl gick upp med 11% i veckan, januari med 8% och mars med 6%. Förra säsongens brist på sojamjöl i världen och därmed stor backwardation i terminspriserna har ”rullat in” på den här säsongens början. Orsaken till att bristsituationen består sägs vara en kombination av att skörden försenats av vädret i USA och att det är brist på såväl lastbilar som lokomotiv. Anledningen till det är att dessa används för att frakta bort den allt ymnigare skifferoljan. USA har ökat produktionen av råolja med ungefär 1 miljon fat per dag sedan förra året. Enligt Congressional Research Service kommer amerikanska järnvägar att transportera 650,000 vagnslaster med råolja i år, vilket är väsentligt mycket mer än förra årets 434,000. År 2008 var samma siffra bara 9,500 vagnslaster. Det är alltså knappast konstigt att det blir brist på lokomotiv för att transportera bort sojabönor och majs från lantbrukare till silo och export.
I Brasilien, där Dilma Rousseff från Arbetarpartiet (’PT’), återvaldes till president förra söndagen, föll valutan kraftigt. Vi noterade inte det så mycket i Sverige, eftersom den svenska kronan faller i samma takt. Brasilie har dock en ganska hög inflationstakt, och sojabönor är en tillgång som är opåverkad av detta. Brasilianska lantbrukare har länge haft en inställning att lagrad vara är säkrare än pengar (Reais) på banken. Det talas nu om att brasilianska lantbrukare allt mer håller igen med försäljning, vilket även det troligtvis bidrar till obalansen i marknaden.
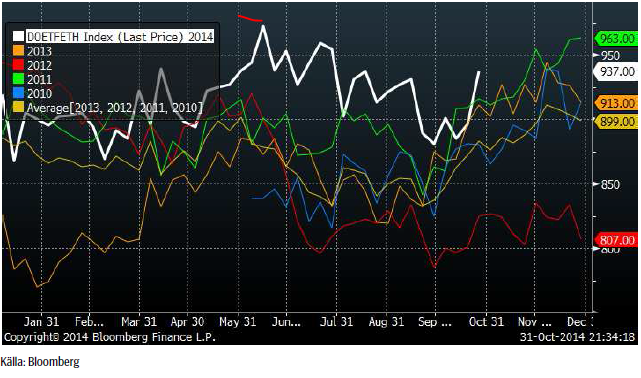
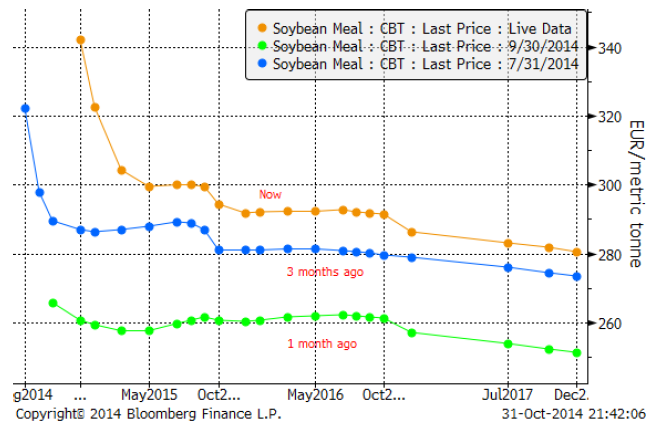
I diagrammet nedan ser vi vad som hänt. Det är tre terminskurvor. Den brandgula visar terminskurvan nu. Vi ser att marknaden räknar med att bristsituationen är avhjälpt i maj. Då planar priset ut på ca 300 euro per ton. Terminskurvan har samma form som den hade för tre månader sedan. Då var det extrem brist på sojamjöl, men vi ser att marknaden förväntade sig att den nya skörden skulle bota detta problem. För en månad sedan tänkte marknaden att skörden skulle råda bot på bristsituationen. Det fanns inte heller någon brist. Decemberkontraktet handlades då i motsvarande 260 euro per ton, väsentligt lägre än 290 euro per ton för tre månader sedan. Den senaste månaden har det alltså återigen blivit brist på sojamjöl och priset är över 340 euro per ton om man vill ha leverans i december.
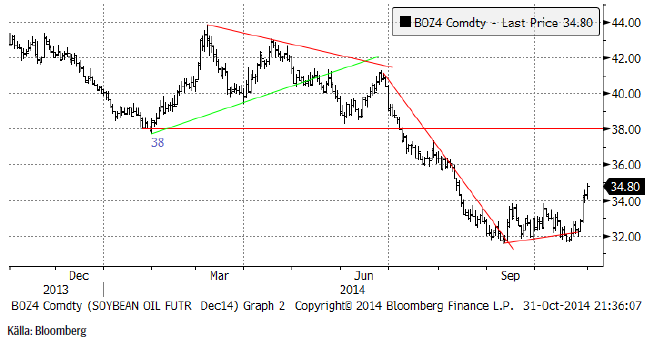
Sojaoljan steg, till skillnad från sojamjölsterminer, ungefär lika mycket för såväl korta som långa löptider. Det tyder på att det inte är brist som driver priset uppåt, utan mer en fundamentalt motiverad prisuppgång överlag. När prisuppgången bröt 34 dollar, innebar det en teknisk köpsignal. Nästa motstånd är 36 dollar och jag det är troligt att prisuppgången på kort sikt når dit. Nästa motstånd är 38 dollar. Det verkar som om botten för sojaoljan var vid 32 dollar. Jag tror att det är klokt att vara köpt terminer på sojaolja.
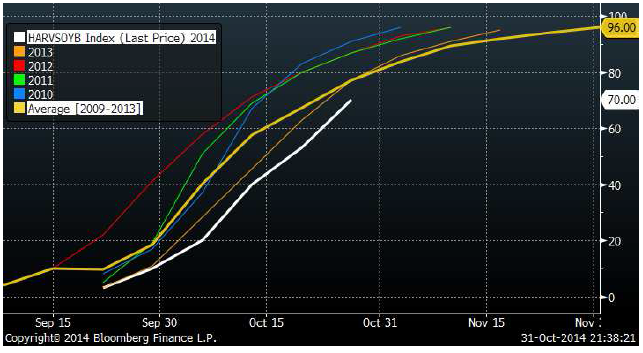
Skörden av sojabönor i USA tog fart efter att vädret torkade upp. I måndagens rapport var 70% skördat och det är bara ett par procent mindre än vad som är normalt för veckan. Som vi ser fortsätter vädret att vara gynnsamt för skörd, vilket gör att skörden kan ha kommit ikapp normal takt den här veckan.
Non-commercials köpte tillbaka ytterligare 28,000 kontrakt i veckan och är nu nettosålda bara 23,000 kontrakt. 28,000 kontrakt är väldigt mycket på köpsidan och våldsamheten i prisuppgången är sannolikt påverkad av detta.
Priset på sojabönor har gått upp väldigt fort och på sojamjöl ännu fortare när marknaden försöker ransonera den bristsituation som av allt att döma blivit kvar från den förra säsongen och helt oväntat. Ingen räknade tydligen med att det skulle saknas transportmöjligheter i USA, på samma sätt som nästan hela oljemarknaden underskattat tillväxten i amerikansk produktion av skifferolja.
Med det sagt, så borde det bli en rekyl nedåt i pris och vi behåller säljrekommendationen.
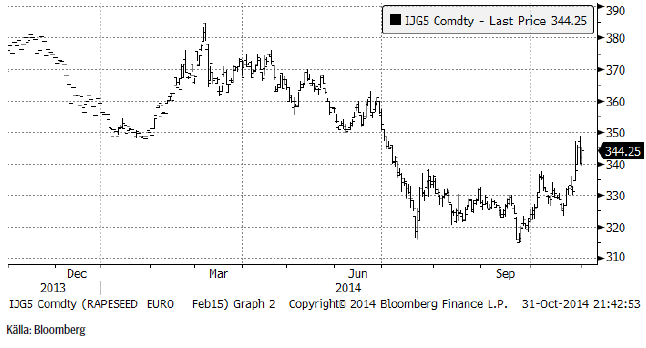
Raps
Novemberkontraktet för rapsfrö steg med 2% till 330 euro per ton. Den går nu in i leverans och vi fortsätter därför att tita på marskontraktet. Det steg med 3% till 344 euro. Vid mitten av veckan steg priset kraftigt upp mot 350 euro per ton. Det är en nivå med tekniskt motstånd, markerat av en botten under januari och en till i juni. I princip varje tiotal är antingen ett motstånd (på uppsidan) eller ett stöd (på nedsidan). Rekylen nedåt från nära 350 fick därför stöd av köpare på 340 euro. Det borde bli en rekyl nedåt, i synnerhet om sojabönorna handlas lite svagare.
EU är världens största producent av rapsfrö. IGC sänkte sitt estimat för EU:s produktion under 2015/16. De sänkte också skördeestimatet för Ukraina. IGC tror att skörden nästa år sjunker till under årets rekord på 23.8 mt. Orsaken till detta är att höstsådden minskat med 4% (Strategie Grains estimerade minskningen till 3%), vilket sänker arealen till 6.5 mHa. IGC för fram flera skäl till varför arealen kommer att bli lägre: EU:s stödsystem missgynnar rapsfröodling, menar de, priset är lägre (men det är lägre för nästan allt), men kanske störst effekt får det generella förbudet att bekämpa skadeinsekter med neonikotinoider. Neonikotinoider sägs skada bisamhällen. IGC skriver att rapsfält i hög grad drabbats av insektsangrepp efter förbudet, främst i Tyskland och Storbritannien. Detta stöds av rapporter från andra håll och förbudet kan minska lönsamheten i odlingen så mycket att dagens pris inte motiverar odling.
IGC väntar sig också att Ukrainas rapsproduktion som till 95% är höstsådd, minskar kraftigt. Detta beror dels på att arealen minskar med 9% till 0.86 mHa och dels på utvintring pga torrt väder.
Vi fortsätter med säljrekommendation på rapsterminer.
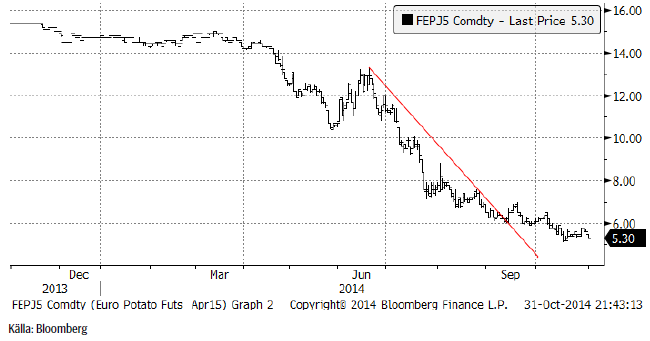
Potatis
Potatispriset handlades svagt i synnerhet mot slutet av veckan. Enligt MARS Bulletin för november som publicerades i veckan, ökar produktionen i EUREX börsområde. Tysklands produktion ökar med nästan 14% från förra året, medan Holland och Frankrike ökar med drygt 8% var och Belgien med drygt 2%. Produktionen ökar dock inte överallt. I Sverige minskar den med nästan 2%.
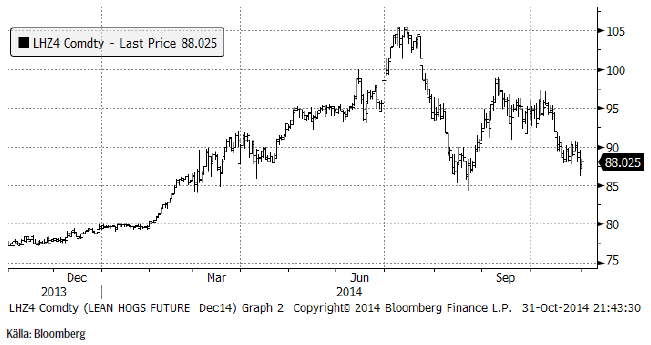
Gris
Lean hogs decemberkontrakt tog ett kliv nedåt från den konsolideringsfas som priset var inne i strax under 90 cent. Prisfallet dämpades och hejdades temporärt av köpintressen strax över 85 cent. Trenden är dock nedåtriktad och det är troligt att det kommer ett nytt test nedåt.
Fredagens hog slaughter-statistik kom in på 409,000 mot tidigare 432,000.
Mjölk
Terminerna på smör på EUREX fortsatte att handlas ungefär på samma nivå som de senaste veckorna, alltså strax under 3000 euro per ton. SMP-terminerna föll dock av och stängde på 1850 för spotterminskontraktet. Det är en nedgång med 7% den senaste veckan.
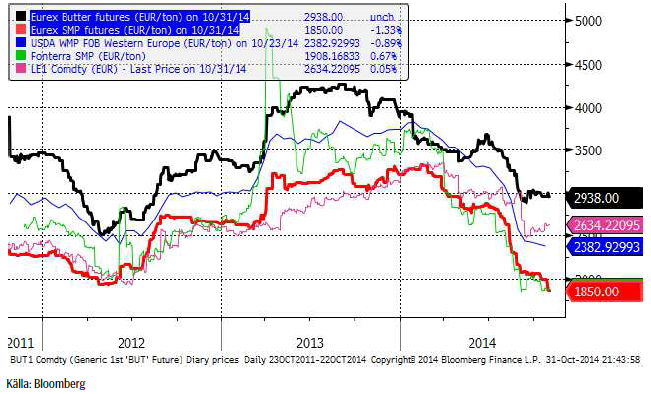
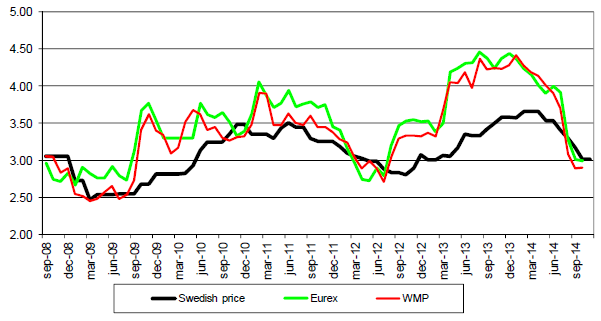
Arla har lämnat priset för november oförändrat från oktober, som jag skrev om förra veckan. I det stora hela har även priserna på EUREX och prisindex för WMP enligt USDA också planat ut. Som vi såg av den förnyade svagheten i SMP, kan det dock vara lite för tidigt att blåsa faran över för ytterligare nedgångar. Arlas notering för mjölkråvara ligger sedan en tid över priset för produkterna smör och SMP, vilket alltså innebär att den kalkylen ger förluster på minst 50 öre per Kg. Produktionskostnaden estimerar jag då till ca 40 öre och priset ligger dessutom under den skillnaden. Detta är naturligtvis inte långsiktigt hållbart och antingen måste EUREX pris gå upp, eller så måste Arla sänka sitt avräkningspris. Den senaste veckans prisnedgång på 7% i SMP, vilket med nästan oförändrat pris på smör innebär en prisnedgång på 4% för mjölkråvara basis smör och SMP, tyder på att det är mer sannolikt att det kommer en prissänkning från Arla i december. Priset på mjölkråvara basis EUREX priser är 2.90 Kr/Kg och Arlas pris är i genomsnitt 40 öre lägre, dock oftast inte när priset är lågt, vilket kompenseras med lägre Arla pris när priset är högt.
I USA noterar man att bensinen ($3.37/gallon) återigen är billigare än mjölken ($3.73). Mjölkpriset har inte fallit på samma sätt i USA som i EU.
Socker
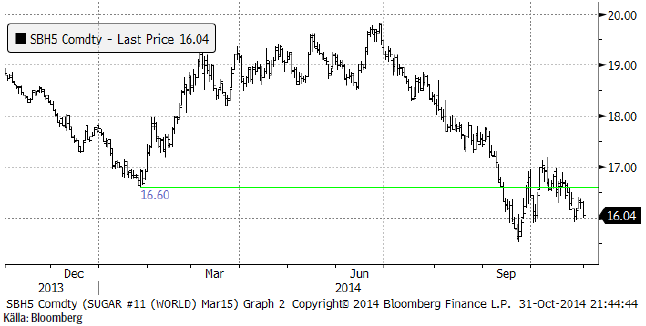
Den senaste veckan har priset på socker gått ner från 16.60 till 16.04. Det låga priset skapar problem för odlarna. Det torra vädret och lägre incitament att sköta odlingen av sockerrör optimalt bör få en påverkan på produktionsvolymen på lite längre sikt. I år ligger ’cane crush’ 8.5% lägre än förra året.
Dilma Rousseff, som vann presidentvalet förra veckan, har sagt att man från PT:s sida vill höja inblandningen av etanol i bensinen till minst 27.5%.
Tekniskt stängde priset strax över det tekniska stödet vid 16 cent. Trenden är fortfarande nedåtriktad, men skulle marknaden handla upp mars-kontraktet till 16.50 den kommande veckan, kan det vara ett tecken på att en trendvändning uppåt kan ha skett.
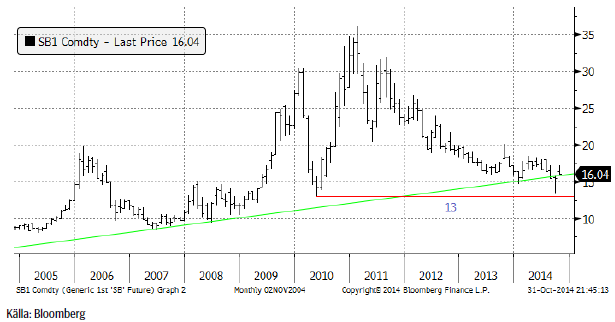
Nedan ser i prisutvecklingen för spotkontraktet de senaste tio åren. Priset står nu och väger mellan att falla under 16 cent, och därmed fortsätta ”sidledes” eller svagt nedåt i pris, eller att stanna över 16 cent och därmed kanske inleda en successiv uppgång till 20 cent i första hand.
Kaffe
Kaffepriset backade med 2% i veckan som gick. Det borde ha varit mer, därför att regnen nu verkar ha återkommit till södra och mellersta Brasilien.
São Paulo-baserade Somar Meteorologia sade i torsdags att den brasilianska kaffeodlingen kommer att få en ”ordentlg lättnad” i form av regn. Det har regnat ganska mycket i São Paulo den här veckan och under helgen. Det är dock inte tillräckligt. Det är fortfarande slut på vatten i staden. Mer regn väntas dock enligt Somar under den andra veckan i november.
Regnen har gjort att kaffebuskarna verkar sätta nya blommor. Den vanliga blomningen under oktober var dålig eftersom det var så torrt, men nu försöker alltså kaffebuskarna reperara detta genom att blomma igen.
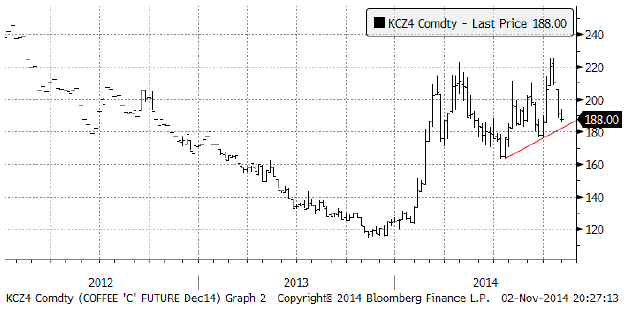
Tekniskt står priset och väger, strax över stödlinjen för den stigande pristrenden sedan i somras. Vi fortsätter med neutral rekommendation.
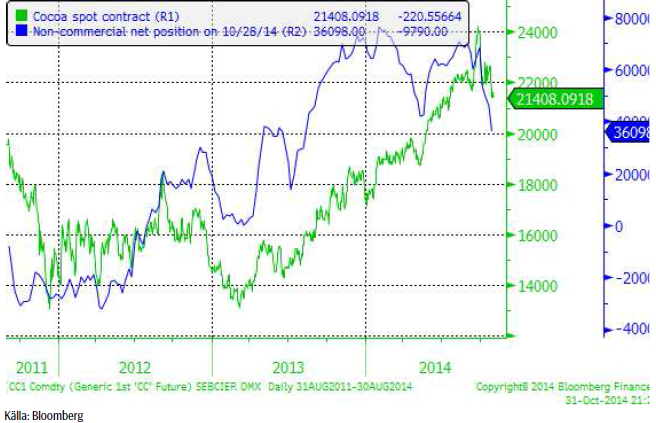
Kakao
Kakaopriset föll kraftigt i veckan och när veckan var slut stängde spotkontraktet på 2899 dollar, 5% lägre än för en vecka sedan. Nästa tekniska stöd ligger vid eller strax över 2800 dollar.
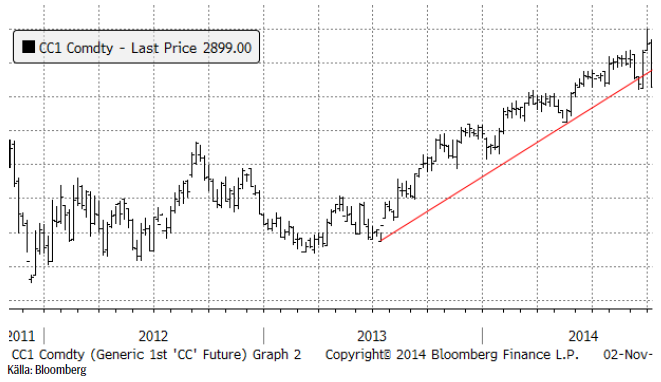
Non-commercials fortsätter att vräka ut terminer. I veckan såldes 10,000 kontrakt av non-commercials, som tar hem vinster efter att ha byggt upp en köpt position sedan 2012 när priset var 800 dollar lägre än det är nu.
[box]SEB Veckobrev Jordbruksprodukter är producerat av SEB Commodities Sales desk och publiceras i samarbete och med tillstånd på Råvarumarknaden.se[/box]
Detta marknadsföringsmaterial, framtaget av SEB’s Commodities Sales desk, har upprättats enbart i informationssyfte.
Även om innehållet är baserat på källor som SEB bedömt som tillförlitliga ansvarar SEB inte för fel eller brister i informationen. Den utgör inte oberoende, objektiv investeringsanalys och skyddas därför inte av de bestämmelser som SEB har infört för att förebygga potentiella intressekonflikter. Yttranden från SEB’s Commodities Sales desk kan vara oförenliga med tidigare publicerat material från SEB, då den senare hänvisas uppmanas du att läsa den fullständiga rapporten innan någon åtgärd vidtas.
Dokumentationen utgör inte någon investeringsrådgivning och tillhandahålls till dig utan hänsyn till dina investeringsmål. Du uppmanas att självständigt bedöma och komplettera uppgifterna i denna dokumentation och att basera dina investeringsbeslut på material som bedöms erforderligt. Alla framåtblickande uttalanden, åsikter och förväntningar är föremål för risker, osäkerheter och andra faktorer och kan orsaka att det faktiska resultatet avviker väsentligt från det förväntade. Historisk avkastning är ingen garanti för framtida resultat. Detta dokument utgör inte ett erbjudande att teckna några värdepapper eller andra finansiella instrument. SEB svarar inte för förlust eller skada – direkt eller indirekt, eller av vad slag det vara må – som kan uppkomma till följd av användandet av detta material eller dess innehåll.
Observera att det kan förekomma att SEB, dess ledamöter, dess anställda eller dess moder- och/eller dotterbolag vid olika tillfällen innehar, har innehaft eller kommer att inneha aktier, positioner, rådgivningsuppdrag i samband med corporate finance-transaktioner, investment- eller merchantbankinguppdrag och/eller lån i de bolag/finansiella instrument som nämns i materialet.
Materialet är avsett för mottagaren, all spridning, distribuering mångfaldigande eller annan användning av detta meddelande får inte ske utan SEB:s medgivande. Oaktat detta får SEB tillåta omfördelning av materialet till utvald tredje part i enlighet med gällande avtal. Materialet får inte spridas till fysiska eller juridiska personer som är medborgare eller har hemvist i ett land där sådan spridning är otillåten enligt tillämplig lag eller annan bestämmelse.
Skandinaviska Enskilda Banken AB (publ) är ett [publikt] aktiebolag och står under tillsyn av Finansinspektionen samt de lokala finansiella tillsynsmyndigheter i varje jurisdiktionen där SEB har filial eller dotterbolag.

Selling down on a ”deal”. Brent crude fell 6.2% last week with accelerated weakness towards the end of the week. Close of the week at $87.33/b and low of the week (and on Friday) of $85.8/b. Brent is falling another 4% this morning to $83.7/b on confirmation by Iran that a MoU text has been reached and that it will be signed on Friday this week.

So what is this ”deal” worth? Talk on the desk here this morning is that it is much like ”putting lipstick on a pig” where Trump has to sell this at home as a victory where ”the SoH has reopened”, the nuclear issue will be ironed out over the coming 60 days (or maybe 600 days?) and US consumers are getting a lower gasoline price and maybe US republicans survives the midterm elections.
The importance for Iran is that it emerges as the defacto winner of this war in the eyes of the non-US public world. That Iran now onwards is the ”ruler of the SoH” (combo of geography and new weapons systems like drones) or more softer: ”the guarantor of safe passage through the SoH”.
Iran doesn’t need nuclear weapons any more. Nuclear deterrence doesn’t work any more. Ukraine has made many attacks deep into Russia without being nuked in return. Plenty of Iranian ballistic rockets blasts over Israel but Iran wasn’t nuked in return.
There is no trust between the US and Iran. We don’t know all the details yet of the MoU. But what we do know is that there is no trust between the US and Iran what so ever. This is probably more like a descriptive text on how they can cooperate in a way where both sides keeps tactical leverage. Neither side makes irreversible concessions. Violations can be punished quickly. Cooperation produces immediate benefits.
This is a fragile structure. It can easily break down. There may be details which cannot be overcome. To be seen on Friday. The US has to show that it is willing put enough force behind managing and restraining Israel versus Hezbollah in Lebanon. We have seen that Netanyahu hasn’t listened all that much to Trump’s directives and wishes. This could be a major obstacle.
A gradual reopening is tactically preferable for Iran. A tactical leverage for Iran right now is that global oil stocks have been drawn down towards painful and increasingly dangerous levels with increasing risks for oil price spikes in mid-July to August. This together with US midterm elections on 3 November gives tactical leverage to Iran. Iran probably doesn’t want to fully give up on that leverage. A rapid, full reopening where global stocks are able to refill over the coming 60 days will significantly erode that leverage. If Iran reinstates a closure of the SoH after 60 days (if talks break down again), then the effect won’t be that impactful in terms of prices and the US midterm elections.
So a gradual and partial reopening where global markets gets the oil they need while they are unable to rebuild stocks could be a practical middle way for both parties. Trump can sell it as ”the SoH has reopened” and get affordable gasoline for US consumers. Iran can sell it as ”the SoH has fully reopened, but there is some friction” so flow is only 60-80% of normal.
Not much real demand destruction below $100/b. What we do know is that there is not much real price pain demand destruction for oil globally at an oil price below $100/b. A lot of demand-shock destruction. Fear. But demand should now come roaring back towards normal with fear for exceptionally high prices now is rapidly receding.
Sudden China demand destruction due to EVs? Bullocks. EV share of total Chinese carpool now around 13%. Share of new sales of EVs has reached 50%. This is a very gradual process. It doesn’t make oil demand fall like a rock over night. When EV new sales share reaches 100%, then the gasoline car pool will contract by some 5-10% per year. But that is only gasoline. Sudden reduction in Chinese oil demand is more about shock and risk.
Chinese crude oil imports will come roaring back. At what price? Today’s ”neutral” oil price is $70/b. That is the five year price which has steadily traded around the $70/b mark over the past 3-4 years. With still a risky picture one would think that China and the rest of the world will be big buyers of oil in the range of $70-85/b.
Global demand will likely snap back towards normal, forecasted demand and growth at such prices.
Physical reopening is a gradual process. The physical and practical reopening of the SoH will likely be gradual rather than sudden. And that probably suites Iran tactically as well.
Brent M1 price versus the Brent 5-yr (today’s ”normal” price)

Market is starting to take US/Iran headlines with a pinch of salt. Brent crude rose $2.8/b yesterday to an official close of $112.1/b. But after that it traded as low as $108.05/b before ending late night at around $109.7/b. Through the day it traded in a range of $106.87 – 112.72/b amid a flurry of news or rumors from Iran and the US. ”US temporary sanctions during negotiations” (falls alarm). ”We will bomb Iran” (not anyhow),… etc. While the market is still fluctuating to this kind of news flow, it is starting to take such headlines with a pinch of salt.
We’ll see. Maybe, maybe not. The Brent M1 contract is trading at $110.2/b this morning which very close to the average ticks through yesterday of $110.4/b.
Trump with bearish, verbal intervention whenever Brent trades above $110/b it seems. What seems to be a pattern is that Trump states something like ”very good negotiations going on with Iran”, ”New leaders in Iran are great,..”, ”Great progress in negotiations,…”, ”Deal in sight,..” etc whenever the Brent M1 contract trades above $110/b. An effort to cool the market. These hot air verbal interventions from Trump used to have a heavy bearish impact on prices, but they now seems to have less and less effect unless they are backed by reality.
As far as we can see there has been no real progress in the negotiations between the US and Iran with both sides still standing by their previous demands.
Iran is getting stronger while the cease fire lasts making a return to war for Trump yet harder. Iran is naturally in constant preparation for a return to war given Trump’s steady threats of bombing Iran again. Iran is naturally doing what ever is possible to prepare for a return to war. And every day the cease fire lasts it is better prepared. This naturally makes it more and more difficult and dangerous for the US to return to warring activity versus Iran as the consequences for energy infrastructure in the Persian Gulf will be more and more severe the longer the cease fire lasts. Israel seems to see it this way as well. That the war is not won and that current frozen state of a cease fire gives Iran opportunity to rebuild military and politically.
Global inventories are drawing down day by day. How much? In the meantime the Strait of Hormuz stays closed. There is varying measures and estimates of how much global inventories are drawing down. Our rough estimate, back of the envelope, is that global inventories are drawing down by at least some 10 mb/d or about 300 mb/d in a balance between loss of supply versus demand destruction. Other estimates we see are a monthly draw of 250-270 mb/d. The IEA only ’measured’ a draw in global observable stocks of 117 mb in April with oil on water rising 53 mb while on shore stocks fell 170 mb. But global stocks are hard to measure with large invisible, unmeasured stocks. As such a back of the envelope approach may be better.
Oil products is what the world is consuming. Oil product prices likely to rise while product stocks fall. Strategic Petroleum Reserves (SPR) are predominantly crude oil. Discharging oil from OECD SPR stocks, a sharp reduction in Chinese crude imports and a reduction in global refinery throughput of 6-7 mb/d has helped to keep crude oil markets satisfactorily supplied. But global inventories are drawing down none the less. And oil products is really what the world is consuming. So if global refinery throughput stays subdued, then demand will eventually have to match the supply of oil products. The likely path forward this summer is a steady draw down in jet fuel, diesel and gasoline. Higher prices for these. Then, if possible, higher refinery throughput and higher usage of crude in response to very profitable refinery margins. And lastly sharper draw in crude stocks and higher prices for these. But some 6 mb/d of oil products used to be exported through the Strait of Hormuz. And it may not be so easy to ramp up refinery activity across the world to compensate. Especially as Ukraine continues to damage Russian refineries as well as Russian crude production and export facilities.
Watch oil product stocks and prices as well as Brent calendar 2027. What to watch for this summer is thus oil product inventories falling and oil product premiums to crude rising. Another measure to watch is the Brent crude 2027 contract as it rises steadily day by day as the Strait of Hormuz stays closed and global oil inventories decline. The latter is close to the highest level since the start of the war and keeps rising.
The Brent M1 contract and the Brent 2027 prices and current price of jet fuel in Europe (ARA). All in USD/b

Our back of the envelope calculation of the global shortage created by the closure of the Strait of Hormuz. Note that 3.5 mb/d of discharge from SPR is also a draw. Note also that ’Forced demand loss’ of 2.5 mb/d is probably temporary and will fall back towards zero as logistics are sorted out leaving ’Price demand loss’ to do the job of balancing the market. Thus a shortfall of at least 9 mb/d created by the closure. More if SPR discharge is included and more if Forced demand loss recedes.

Brent is climbing higher. Front-month is at USD 106.3/bl this morning, close to a weekly high and a USD 9/bl jump from Mondays open. This is the move we flagged as a risk earlier in the week: the market shifting from ”a deal is around the corner” to ”this is going to take longer than we thought”.

Analyst Commodities, SEB
During April, rest-of-year Brent remained remarkably stable around USD 90/bl. A stability which rested on one single assumption: the SoH reopens around 1 May. That assumption is now slowly falling apart.
As we highlighted yesterday: every week of delay beyond 1 May adds (theoretically) ish USD 5/bl to the rest-of-year average, as global inventories draw 100 million barrels per week. i.e., a mid-May reopening implies rest-of-year Brent closer to USD 100/bl, and anything pushing into June or July takes us meaningfully higher.
What’s changed in the last 48 hours:
#1: The US military has formally warned that clearing suspected sea mines from SoH could take up to six months. That is a completely different timescale from what the financial market is pricing. Even a political deal tomorrow does not immediately reopen the strait.
#2: Trump has shifted his tone from urgency to ”strategic patience”. In yesterday’s press conference: ”Don’t rush me… I want a great deal.” The market is reading this as a president no longer feeling pressured by timelines, with the naval blockade running in the background.
#3: So far, the military activity is escalating, not de-escalating. Axios reports Iran is laying more mines in SoH. The US 3rd carrier strike group (USS George H.W. Bush) is arriving with two countermine vessels. Trump yesterday ordered the US Navy to destroy any Iranian boats caught laying mines. While CNN reports that the Pentagon is actively drawing up plans to strike Iranian SoH capabilities and individual Iranian military leaders if the ceasefire collapses. i.e., NOT a attitude consistent with an imminent deal!
Spot crude and product prices eased off the early-April highs on a combination of system rerouting and deal optimism. Both now weakening. Goldman estimates April Gulf output is reduced by 14.5 mbl/d, or 57% of pre-war supply, a number that keeps getting worse the longer this drags on.
Demand-side adaptation is ongoing: S. Korea has cut its Middle East crude dependence from 69% to 56% by pulling more from the Americas and Africa, and Japan is kicking off a second round of SPR releases from 1 May. But SPRs are finite.
Ref. to the negotiations, we should not bet on speed. The current Iranian leadership is dominated by genuine hardliners willing to absorb economic pain and run the clock to extract concessions. That is not a setup for a rapid resolution. US/Israeli media briefings keep framing the delay as ”internal Iranian divisions”, the reality is more complicated and points toward weeks and months, not days.
Our point is that the complexity is large, and higher prices have only just started (given a scenario where the negotiations drag out in time). The market spent April leaning on the USD 90/bl rest-of-year assumption; that case is diminishing by the hour. If ”early May reopening” is replaced by ”June, July or later” over the next week or two, both crude and products have meaningful room to reprice higher from here. There is a high risk being short energy and betting on any immediate political resolution(!).


Vattenfalls och Industrikrafts kärnkraftsbolag Videberg Kraft har valt Rolls-Royce SMR
Selling down on a ”deal”

Sommarväder skapar prisrally på elbörsen
Oil product price pain is set to rise as the Strait of Hormuz stays closed into summer

