

Analys
SEB Jordbruksprodukter, 25 juni 2013

 Odlingsväder
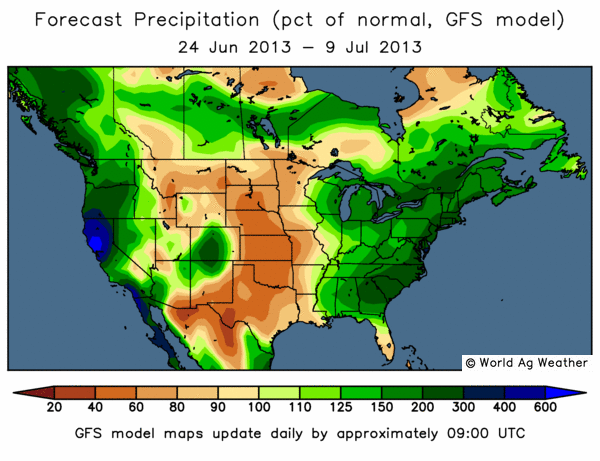
GFS-modellens prognos för de kommande två veckorna visar på ordentlig nederbörd längs väst- och östkusterna i USA och i södra Kanada. GFS-modellen (Global Forecast System) används av de amerikanska vädercentralerna för att göra globala väderleksprognoser. Kalifornien har varit torrt i ungefär tio år, men får nu ordentligt med nederbörd. Däremot fortsätter klassiska vete-områden i USA att vara torrare än normalt.
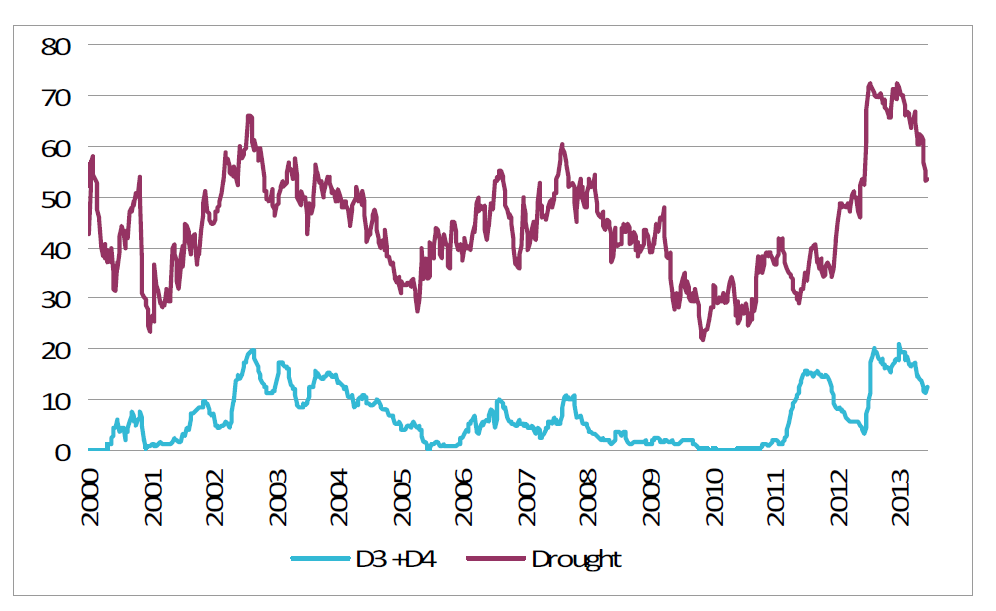
Som vi ser i nedanstående uppdaterade diagram över hur många procent av USA som är drabbat av torka, ser vi att andelen visserligen fallit snabbt, men att det allt jämt är mycket torrare än normalt.
Nedan ser vi en prognoskarta för norra Sydamerika. Vi ser att det nederbördsmönster Brasilien haft tidigare väntas fortsätta. São Paulo-staten får dock nu upp till sex gånger den normala nederbörden. I SP odlas nuförtiden mest sockerrör, då kaffet trängts undan.
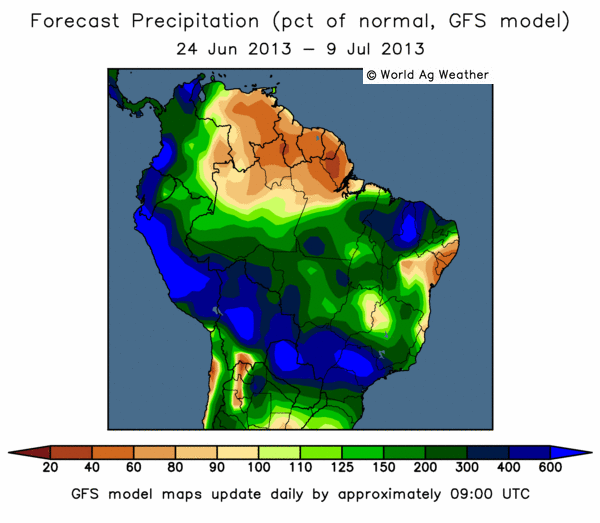
Argentina fortsätter dock att få 60-80% av normal nederbörd.
Indiens monsun har börjat rekordtidigt och täcker hela landet med nederbörd.
Vete
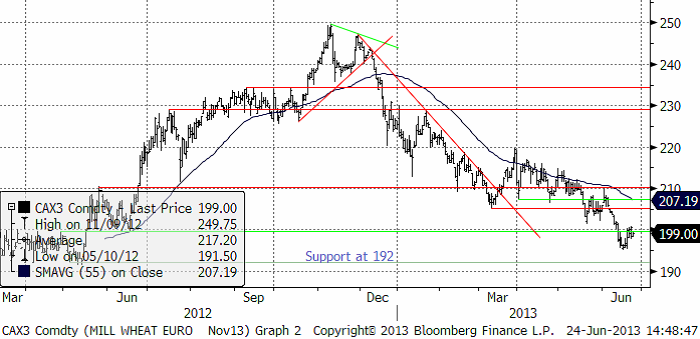
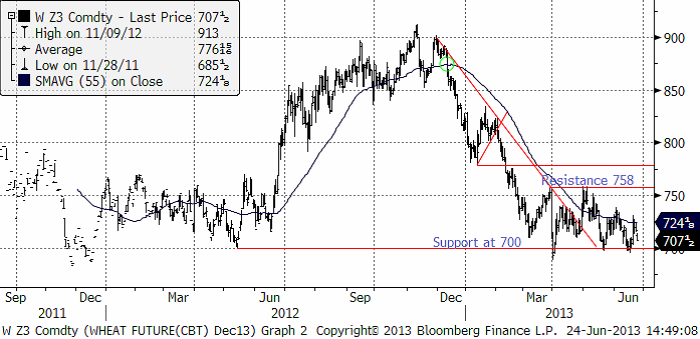
Nyheten att Kina köpt 200 kt vete från Frankrike fick prisfallet på Matifs novembertermin att stanna upp. GASC meddelade att de kommer att bjuda in till en tender före 30 juni. De har varit borta från marknaden sedan i februari. Vi betraktar rekylen upp mot 200 euro som just en rekyl mot trenden och att prisfallet fortsätter.
Decemberkontraktet på CBOT har funnit stöd på 700 cent och priset har inte velat gå under den nivån.
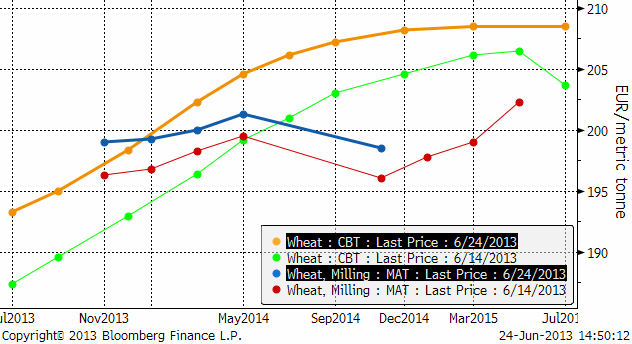
Nedan ser vi förändringen i terminskurvorna från fredagen för drygt en vecka sedan, till måndag.
Vädret i Europa är huvudsakligen gynnsamt för produktionen av vete.
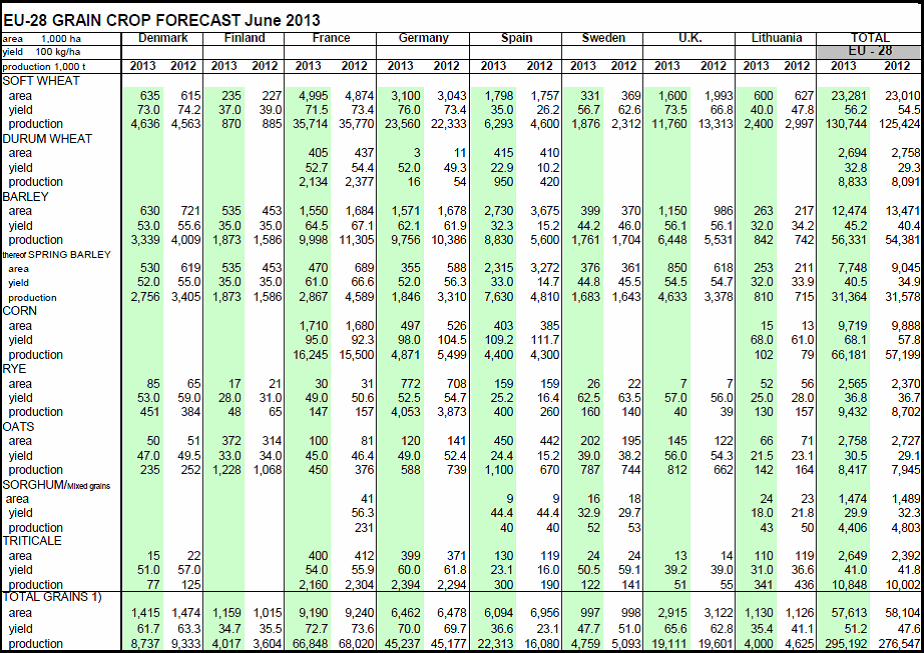
Coceral, den europeiska branschföreningen för spannmåls- och oljeväxthandlare, justerar upp sitt estimat för EU-28:s veteproduktion 2013/14 till 130.7 mt, vilket är en ökning från den tidigare prognosen i mars på 127.8 mt och från förra årets 125.4 mt. Revideringen kommer från såväl ökad areal som ökad avkastning. Även estimatet för EU-28:s produktion av korn förväntas öka, trots lägre areal än förra året men på indikationer att avkastningen återhämtar sig i år. Den totala produktionen av korn förväntas uppgå till 56.3 mt, en ökning från det tidigare estimatet på 54.8 mt och förra årets 54.4 mt. Produktionen av majs förväntas uppgå till 66.2 mt, en ökning med 9 mt jämfört med förra året.
EU Kommissionens MARS-enhet gjorde även de en marginell justering uppåt i sin senaste rapport gällande den genomsnittliga avkastningen för vete. För majs och korn gjordes också justeringar uppåt medan avkastningen för raps justeras marginellt nedåt. Rapporteringsperioden har präglats av skarpa väderkontraster i hela Europa, där nederbörd och kalla temperaturer har hämmat grödornas utveckling stora delar av Centraleuropa. Däremot har väderförhållandena varit gynnsamma i Rumänien, Ungern och framförallt i Spanien där en utmärkt säsong ökar estimatet för avkastningen av vårkorn i EU-27. Mest utmärkande för perioden har dock varit de skyfall i Centraleuropa, som ledde till stora översvämningar i närheten av floder och ökad markfuktighet till kritiska nivåer, vilket ökar risken för skadedjur och begränsar grödornas utveckling.
Prognosen för hektarskörden avseende vete inom EU-27 lämnades i stort sett oförändrad på 5.55 t/ha från förra månadens 5.54 t/ha, vilket fortfarande är en ökning med 2.3% jämfört med förra året men strax under det femåriga genomsnittet på 5.63 t/ha. Detta som en följd av en betydande uppjustering av hektarskörden i Spanien, Rumänien och Ungern, som kompenserar för nedjusteringar i Tyskland, Slovakien och Tjeckien. Estimatet för Storbritannien fortsätter att justeras ner, den här gången från 7.68 t/ha till 7.63 t/ha. Grödorna har blivit hårt drabbade av förra årets rekordregn, som inte bara påverkade förra årets skörd utan även sådden av årets grödor.
Rapporten från USDA på fredag handlar mest om majs och sojabönor. Vetemarknaden kommer dock att ta intryck av situationen för majs.
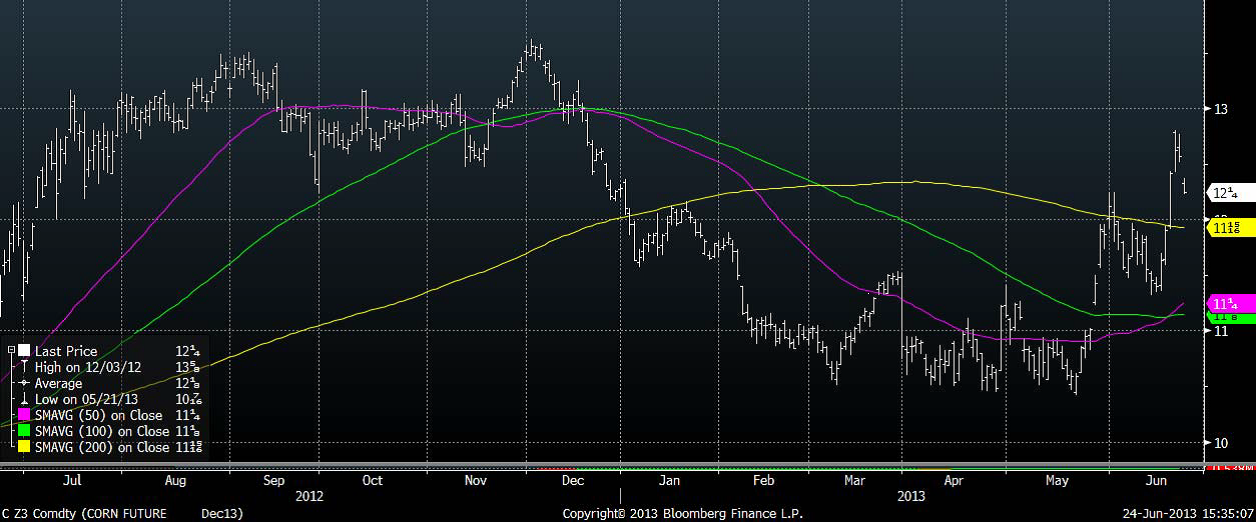
Majs
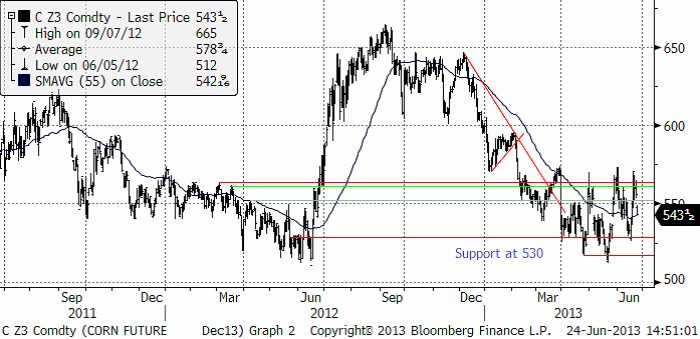
Majspriset (december 2013) har liksom vetet på Chicago funnit stöd på förra årets bottennivåer med 530 cent som den huvudsakliga bottennivån. Marknaden har visat en tendens att försöka stiga de senaste månaderna. Vi har noterat högre toppar och lägre bottnar i de senaste månadernas handel. Helhetsbilden ser dock ut som en rekyl efter den stora prisnedgången från 650 cent / bu. Om det handlar om det, kan nästa prisrörelse bli nedåt, mot 400 cent.
EU-Kommissionens MARS-enhet reviderade i sin senaste rapport upp hektarskörden avseende majs inom EU-27, från förra månadens 6.87 t/ha till 7.13 t/ha. På årsbasis är det en ökning med 16.3% i förhållande till förra årets 6.13. Det är även högre än det femåriga genomsnittet på 7.01 t/ha. Förklaringen är de väsentligt förbättrade utsikterna för Rumänien och Ungern. Sådden av majs i norra Italien blev kraftigt försenad och låga temperaturer i kombination med kraftig nederbörd gav grödorna en dålig start på säsongen. Väderförhållandena under den kommande månaden kommer att vara avgörande för avkastningen.
Brasilianska Safras prognosticerar att Brasiliens majsskörd hamnar på 82.7 mt. USDA estimerade i den senaste WASDE-rapporten en skörd på 77 mt (en höjning från 76 mt i maj-rapporten). USDA estimerar också att skörden i Brasilien nästa år (2013/14) blir 72 mt. Efter det fall i den brasilianska valutan de senaste månaderna finns dock anledning att tro att produktionen kan bli större än 72 mt, eftersom priset i Brasilien automatiskt har stigit med valutans fall. Se nedanstående diagram, som visar decemberkontraktet på CME uttryckt i BRL / bushel.
Slutsatsen är att vi behåller vår säljrekommendation på majs.
Sojabönor
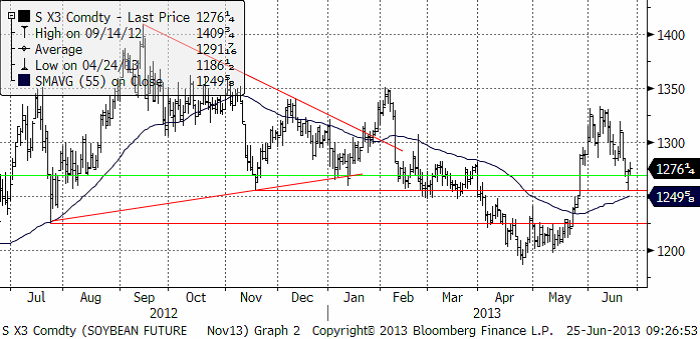
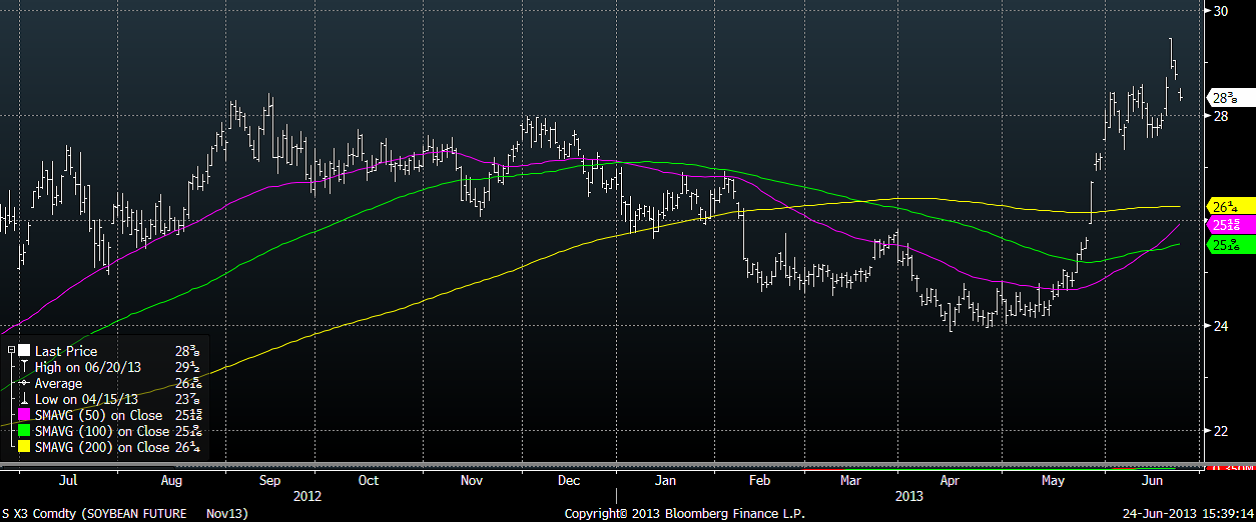
Priset på novemberkontraktet på sojabönor har rekylerat ner till stödet på 1250 cent. Teknisk analys säger egentligen ”köp”. Nästan all fundamental information säger sälj. Vi har övervägt om vi skulle gå över till åtminstone ”neutral” rekommendation, men väljer på grund av följande faktorer att behålla säljrekommendationen: 1. USDA förutspår väsentligt högre lager, 2. Brasiliens valuta har fallit kraftigt vilket torde öka produktionen i landet, 3. Kinas ekonomi bromsar in ännu mer enligt PMI. 4. Stigande obligationsräntor efter FED:s besked om ett slut på QE dämpar konsumtionen av dyrare mat.
Sådden av sojabönor hade i måndags förra veckan nått till 85% färdigt. Det ska jämföras med 98% samma vecka förra året och 91% som femårigt medelvärde. Däremot är sojabönorna i utmärkt skick. 64% är i good eller excellent kondition. Samma tid förra året var 56% i samma klass.
På fredag publicerar USDA statistik på sådd areal och lager. Det spekuleras i att den sena sådden har minskat arealen, men den sena sådden kan också ha minskat majsarealen och ökat sojaarealen. Marknaden förväntar sig faktiskt att sojaarealen har ökat. Den förväntar sig också att exportsiffrorna har varit för höga och att lagren därmed är större än man tidigare trott. Detta skulle kunna få priset att falla ner mot 10 dollar per bushel, resonerar man.
Den brasilianska valutans fall får liksom för majs, förmodligen konsekvenser för produktionen. Ett högre pris leder till högre produktion, allt annat lika. Nedan ser vi priset på sojabönor (november kontraktet) omräknat till brasilianska reais (BRL):
Det är som vi ser ett pris som är högre än förra året, som stimulerade till en produktion av 82 mt. USDA förväntar sig i den senaste WASDE-rapporten att produktionen i vinter (2013/14) stiger till 85 mt, men det kan faktiskt bli ännu mer, eftersom priset har stigit så kraftigt den senaste månaden.
Vi väljer alltså att ligga kvar med ”sälj” rekommendation på sojabönor.
Raps
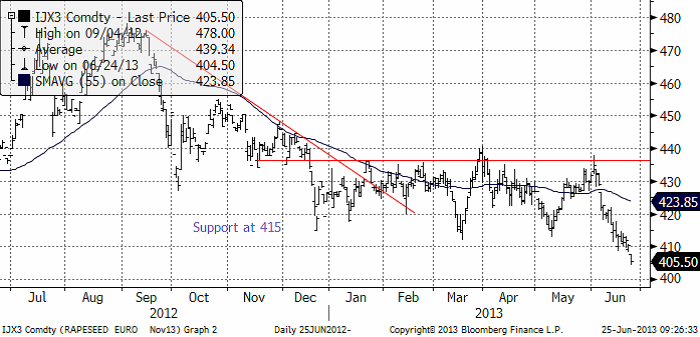
Rapspriset (November 2013) bröt genom stödet som hållit i ett halvår. När ett så ihärdigt stöd bryts är det alltid viktigt. Om inget ”bullish” kommer ur fredagens rapport om areal och lager för sojabönor på fredag, bör vi kunna se rapspriset testa och kanske falla under 400 euro per ton.
COCERAL justerar i sin senaste rapport i juni upp väntad produktion av oljeväxter marginellt från estimatet man gjorde i mars om 28.85 mt till 28.89 mt. I denna siffra så har den förväntade produktionen av raps nu glidit under 20 mt-strecket och förväntas uppgå till 19.9 mt – ner från mars månads prognos på 20.1 mt men fortfarande högre än förra årets 19.5 mt.
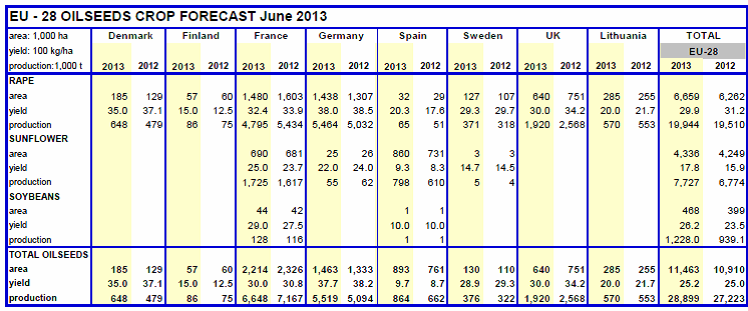
EU-Kommissionens MARS-enhet justerade i sin juni-rapport ner hektarskörden för raps och rybs 3.06 t/ha till 3.02 t/ha. Den bedöms för närvarande att bli lägre än förra året. Utsikterna för EU:s tre största producentländer Tyskland, Frankrike och Polen har försämrats. Om prognosen besannas blir det här året i så fall det fjärde året i rad för Frankrike med medioker avkastning. Även för mindre producenter som Bulgarien, Slovakien och Tjeckien görs betydande nedjusteringar (med mer än 5%).
Kaffe
Kaffepriset har fallit ytterligare och har nu uppnått den storlek på prisfall som en nedgångsfas i kaffe brukar uppnå (-60%).
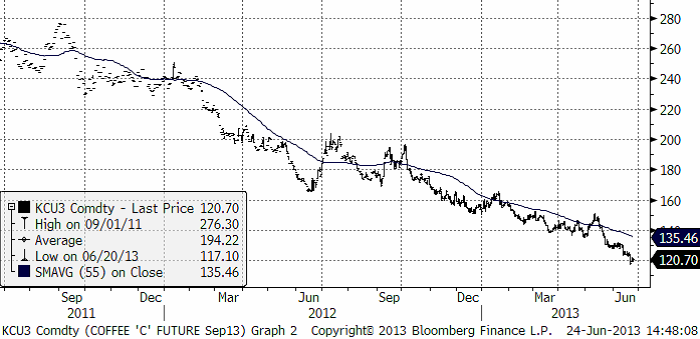
Skörden av robusta i nordöstra Brasilien väntas bli mindre och av sämre kvalitet än normalt. Bönorna är både mindre än normalt och mörkare än normalt. Detta beror på att området har varit ovanligt torrt. CEPEA rapporterar att lagren är i stort sett tömda från förra året. Ett positivt tecken, trots allt.
Socker
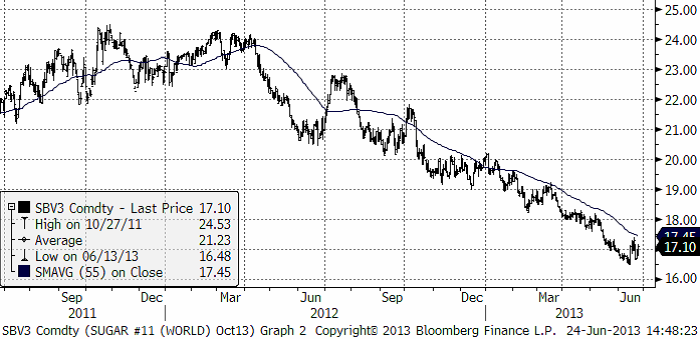
Priset på socker som tvärvände uppåt för en dryg vecka sedan, föll tillbaka, men inte hela vägen ner. Därefter har priset faktiskt vänt uppåt igen. Detta är en mikrorörelse i förhållande till det stora prisfallet som har pågått i över två år, men eftersom det sker på en så låg nivå att en botten kan vara nära, är det värt att hålla ett öga på utvecklingen framöver. Vi fortsätter tills vidare med neutral rekommendation. En uppgång till 18 cent skulle nog göra att vi bytte till köprekommendation.
[box]SEB Veckobrev Jordbruksprodukter är producerat av SEB Merchant Banking och publiceras i samarbete och med tillstånd på Råvarumarknaden.se[/box]
Disclaimer
The information in this document has been compiled by SEB Merchant Banking, a division within Skandinaviska Enskilda Banken AB (publ) (“SEB”).
Opinions contained in this report represent the bank’s present opinion only and are subject to change without notice. All information contained in this report has been compiled in good faith from sources believed to be reliable. However, no representation or warranty, expressed or implied, is made with respect to the completeness or accuracy of its contents and the information is not to be relied upon as authoritative. Anyone considering taking actions based upon the content of this document is urged to base his or her investment decisions upon such investigations as he or she deems necessary. This document is being provided as information only, and no specific actions are being solicited as a result of it; to the extent permitted by law, no liability whatsoever is accepted for any direct or consequential loss arising from use of this document or its contents.
About SEB
SEB is a public company incorporated in Stockholm, Sweden, with limited liability. It is a participant at major Nordic and other European Regulated Markets and Multilateral Trading Facilities (as well as some non-European equivalent markets) for trading in financial instruments, such as markets operated by NASDAQ OMX, NYSE Euronext, London Stock Exchange, Deutsche Börse, Swiss Exchanges, Turquoise and Chi-X. SEB is authorized and regulated by Finansinspektionen in Sweden; it is authorized and subject to limited regulation by the Financial Services Authority for the conduct of designated investment business in the UK, and is subject to the provisions of relevant regulators in all other jurisdictions where SEB conducts operations. SEB Merchant Banking. All rights reserved.


The latest weekly report from the US DOE showed a substantial drawdown across key petroleum categories, adding more upside potential to the fundamental picture.

Commercial crude inventories (excl. SPR) fell by 5.8 million barrels, bringing total inventories down to 415.1 million barrels. Now sitting 11% below the five-year seasonal norm and placed in the lowest 2015-2022 range (see picture below).
Product inventories also tightened further last week. Gasoline inventories declined by 2.1 million barrels, with reductions seen in both finished gasoline and blending components. Current gasoline levels are about 3% below the five-year average for this time of year.
Among products, the most notable move came in diesel, where inventories dropped by almost 4.1 million barrels, deepening the deficit to around 20% below seasonal norms – continuing to underscore the persistent supply tightness in diesel markets.
The only area of inventory growth was in propane/propylene, which posted a significant 5.1-million-barrel build and now stands 9% above the five-year average.
Total commercial petroleum inventories (crude plus refined products) declined by 4.2 million barrels on the week, reinforcing the overall tightening of US crude and products.


A classic case of “buy the rumor, sell the news” played out in oil markets, as Brent crude has dropped sharply – down nearly USD 10 per barrel since yesterday evening – following Iran’s retaliatory strike on a U.S. air base in Qatar. The immediate reaction was: “That was it?” The strike followed a carefully calibrated, non-escalatory playbook, avoiding direct threats to energy infrastructure or disruption of shipping through the Strait of Hormuz – thus calming worst-case fears.
After Monday morning’s sharp spike to USD 81.4 per barrel, triggered by the U.S. bombing of Iranian nuclear facilities, oil prices drifted sideways in anticipation of a potential Iranian response. That response came with advance warning and caused limited physical damage. Early this morning, both the U.S. President and Iranian state media announced a ceasefire, effectively placing a lid on the immediate conflict risk – at least for now.
As a result, Brent crude has now fallen by a total of USD 12 from Monday’s peak, currently trading around USD 69 per barrel.
Looking beyond geopolitics, the market will now shift its focus to the upcoming OPEC+ meeting in early July. Saudi Arabia’s decision to increase output earlier this year – despite falling prices – has drawn renewed attention considering recent developments. Some suggest this was a response to U.S. pressure to offset potential Iranian supply losses.
However, consensus is that the move was driven more by internal OPEC+ dynamics. After years of curbing production to support prices, Riyadh had grown frustrated with quota-busting by several members (notably Kazakhstan). With Saudi Arabia cutting up to 2 million barrels per day – roughly 2% of global supply – returns were diminishing, and the risk of losing market share was rising. The production increase is widely seen as an effort to reassert leadership and restore discipline within the group.
That said, the FT recently stated that, the Saudis remain wary of past missteps. In 2018, Riyadh ramped up output at Trump’s request ahead of Iran sanctions, only to see prices collapse when the U.S. granted broad waivers – triggering oversupply. Officials have reportedly made it clear they don’t intend to repeat that mistake.
The recent visit by President Trump to Saudi Arabia, which included agreements on AI, defense, and nuclear cooperation, suggests a broader strategic alignment. This has fueled speculation about a quiet “pump-for-politics” deal behind recent production moves.
Looking ahead, oil prices have now retraced the entire rally sparked by the June 13 Israel–Iran escalation. This retreat provides more political and policy space for both the U.S. and Saudi Arabia. Specifically, it makes it easier for Riyadh to scale back its three recent production hikes of 411,000 barrels each, potentially returning to more moderate increases of 137,000 barrels for August and September.
In short: with no major loss of Iranian supply to the market, OPEC+ – led by Saudi Arabia – no longer needs to compensate for a disruption that hasn’t materialized, especially not to please the U.S. at the cost of its own market strategy. As the Saudis themselves have signaled, they are unlikely to repeat previous mistakes.
Conclusion: With Brent now in the high USD 60s, buying oil looks fundamentally justified. The geopolitical premium has deflated, but tensions between Israel and Iran remain unresolved – and the risk of missteps and renewed escalation still lingers. In fact, even this morning, reports have emerged of renewed missile fire despite the declared “truce.” The path forward may be calmer – but it is far from stable.
Analys
A muted price reaction. Market looks relaxed, but it is still on edge waiting for what Iran will do
Brent crossed the 80-line this morning but quickly fell back assigning limited probability for Iran choosing to close the Strait of Hormuz. Brent traded in a range of USD 70.56 – 79.04/b last week as the market fluctuated between ”Iran wants a deal” and ”US is about to attack Iran”. At the end of the week though, Donald Trump managed to convince markets (and probably also Iran) that he would make a decision within two weeks. I.e. no imminent attack. Previously when when he has talked about ”making a decision within two weeks” he has often ended up doing nothing in the end. The oil market relaxed as a result and the week ended at USD 77.01/b which is just USD 6/b above the year to date average of USD 71/b.

Brent jumped to USD 81.4/b this morning, the highest since mid-January, but then quickly fell back to a current price of USD 78.2/b which is only up 1.5% versus the close on Friday. As such the market is pricing a fairly low probability that Iran will actually close the Strait of Hormuz. Probably because it will hurt Iranian oil exports as well as the global oil market.
It was however all smoke and mirrors. Deception. The US attacked Iran on Saturday. The attack involved 125 warplanes, submarines and surface warships and 14 bunker buster bombs were dropped on Iranian nuclear sites including Fordow, Natanz and Isfahan. In response the Iranian Parliament voted in support of closing the Strait of Hormuz where some 17 mb of crude and products is transported to the global market every day plus significant volumes of LNG. This is however merely an advise to the Supreme leader Ayatollah Ali Khamenei and the Supreme National Security Council which sits with the final and actual decision.
No supply of oil is lost yet. It is about the risk of Iran closing the Strait of Hormuz or not. So far not a single drop of oil supply has been lost to the global market. The price at the moment is all about the assessed risk of loss of supply. Will Iran choose to choke of the Strait of Hormuz or not? That is the big question. It would be painful for US consumers, for Donald Trump’s voter base, for the global economy but also for Iran and its population which relies on oil exports and income from selling oil out of that Strait as well. As such it is not a no-brainer choice for Iran to close the Strait for oil exports. And looking at the il price this morning it is clear that the oil market doesn’t assign a very high probability of it happening. It is however probably well within the capability of Iran to close the Strait off with rockets, mines, air-drones and possibly sea-drones. Just look at how Ukraine has been able to control and damage the Russian Black Sea fleet.
What to do about the highly enriched uranium which has gone missing? While the US and Israel can celebrate their destruction of Iranian nuclear facilities they are also scratching their heads over what to do with the lost Iranian nuclear material. Iran had 408 kg of highly enriched uranium (IAEA). Almost weapons grade. Enough for some 10 nuclear warheads. It seems to have been transported out of Fordow before the attack this weekend.
The market is still on edge. USD 80-something/b seems sensible while we wait. The oil market reaction to this weekend’s events is very muted so far. The market is still on edge awaiting what Iran will do. Because Iran will do something. But what and when? An oil price of 80-something seems like a sensible level until something do happen.


Sommarvädret styr elpriset i Sverige

Samtal om flera delar av råvarumarknaden
Tightening fundamentals – bullish inventories from DOE

Jonas Lindvall är tillbaka med ett nytt oljebolag, Perthro, som ska börsnoteras

Oljan, guldet och marknadens oroande tystnad

Stor uppsida i Lappland Guldprospekterings aktie enligt analys

Brookfield ska bygga ett AI-datacenter på hela 750 MW i Strängnäs
Silverpriset släpar efter guldets utveckling, har mer uppsida

Tradingfirman XTX Markets bygger datacenter i finska Kajana för 1 miljard euro

Uppgången i oljepriset planade ut under helgen
-
 Nyheter3 veckor sedan
Stor uppsida i Lappland Guldprospekterings aktie enligt analys
-
 Nyheter4 veckor sedan
Brookfield ska bygga ett AI-datacenter på hela 750 MW i Strängnäs
-
 Nyheter3 veckor sedan
Silverpriset släpar efter guldets utveckling, har mer uppsida
-
 Nyheter4 veckor sedan
Tradingfirman XTX Markets bygger datacenter i finska Kajana för 1 miljard euro
-
 Nyheter2 veckor sedan
Uppgången i oljepriset planade ut under helgen
-

 Nyheter2 veckor sedan
Låga elpriser i sommar – men mellersta Sverige får en ökning
-
Analys2 veckor sedan
Very relaxed at USD 75/b. Risk barometer will likely fluctuate to higher levels with Brent into the 80ies or higher coming 2-3 weeks
-

 Nyheter1 vecka sedan
Mahvie Minerals växlar spår – satsar fullt ut på guld