

Analys
SEB Jordbruksprodukter, 24 mars 2014


 Fokus den senaste veckan har varit på Ryssland och Ukraina .Ryssland har visat för omvärlden att internationell lag inte gäller för dem. Annekteringen av Krim har godkänts av endast två stater i världen: Nordkorea och Syrien, nummer ett och nummer två av världens skurkstater. Det är i det sällskapet Ryssland nu är. Men Ryssland är till skillnad från dessa, ett handlingskraftigt och mäktigt land. Av allt att döma har Rysslands offensiv mot Ukraina inte avslutats. Jag tror det är ett misstag att utgå från att kriget är över. Även om vi kan räkna ut att bortfallet av produktion även för ett extremfall för Ukraina redan finns i priserna, kommer säkert en Putin-premie att finnas kvar i priserna och volatiliteten gissningsvis drivas av ny information från ett Ryssland som är helt opålitligt i sin laglösa aggressivitet. Att som importland, exempelvis Egypten, sätta sin tillit till att ett köp från Ukraina verkligen kommer fram, gör man bara om man har en buffert av egna lager redan. Man tar inte risker med människors livsmedelsförsörjning.
Odlingsväder i de stora produktionsområdena spelar en större roll för den långsiktiga prisnivån än Ukraina/Ryssland-krisen. Det är torrt i USA och crop ratiings för höstvetet är förskräckande i Texas och Kansas. Det ser inte ut att bli bättre där, men frågan är hur det är i resten av USA, som inte börjat rapportera än.
Torkan i Brasilien är slut. Skörden ser dessutom ut att bli större än befarat. Torkan är också temporärt i alla fall slut vad gäller palmolja. Detta har fått framförallt priset på vegetabilisk olja att falla i veckan.
Kanada tinade upp, som jag skrev om förra veckan. Det fick priset på havreterminer i Chicago att falla med 25% sedan förra veckan. Det har också fått terminerna på Canola i Winnipeg att falla med 5%, vilket nu kommer att sätta press på Matifs rapsterminer och framförallt på sojaolja och sojabönor, eftersom rapsen just nu är ”billig” i förhållande till sojabönor.
PED-virusets spridning i USA har kulminerat, vilket innebär att haussen på Lean Hogs förmodligen är över.
Sammanfattningsvis blir slutsatsen att marknaden såväl på spannmål som oljeväxter kan stå inför en rekyl nedåt den närmaste tiden. Vi går därför över till säljrekommendation – på allt. Volatiliteten är kommer dock att vara hög, främst drivet av vad Ryssland hittar på och av crop ratings på höstvetet i USA.
På måndag nästa vecka kommer den årliga ”Propective Plantings” rapporten för majs och sojabönor i USA. Med anledning av den kommer vi att hålla seminarier i Malmö, Lidköping, Vadstena och i Stockholm på tisdagen, onsdagen och torsdagen. Är du intresserad av att komma och lyssna på dessa och de speciellt inbjudna gästtalarna, hör gärna av dig till oss.
Odlingsväder
Indien är nästan helt torrt och väntas få ca 20% av normal nederbörd den kommande tvåveckorsperioden. Skörden av vete är i full gång där. Kina väntas få normalt till lite mer nederbörd än normalt. I det nedanstående går vi igenom läget lite mer i detalj i USA, Europa, Sydamerika och fd Sovjetunionen, där vädret just nu har störst marknadspåverkan.
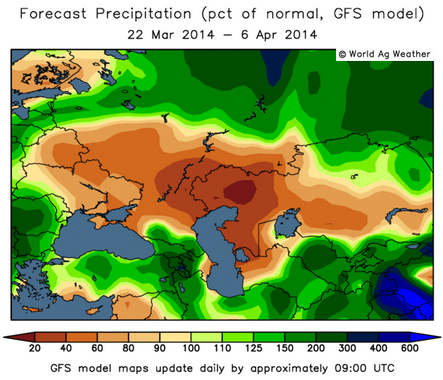
I USA är det återigen torrare än normalt och detta väntas bestå de kommande två veckorna, som vi ser av prognoskartan nedan.
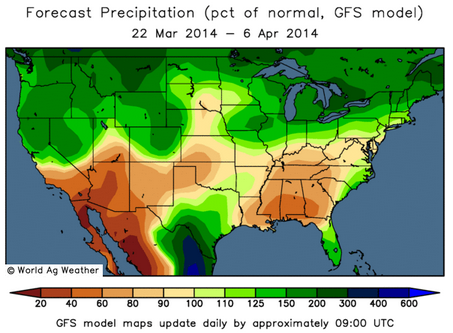
Enligt US Drought Monitor ökade andelen av arealen i USA:s Great Plains som är drabbad av medel- till exceptionell torka från 23% till 28% från förra veckan. Detta drabbar framförallt höstvetet. Meteorologer har talat om att torkan i USA ska avta, men det ser verkligen inte så ut enligt GFS-modellens prognoser.
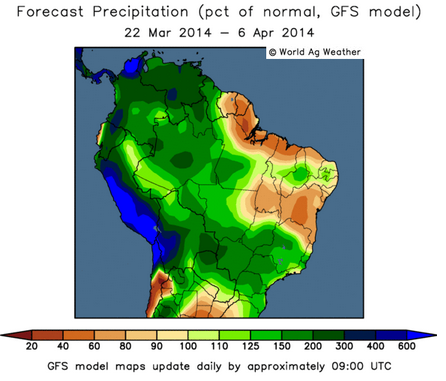
Sydamerika har fått riktlig nederbörd, särskilt över delstaterna Minas Gerais och São Paulo, där kaffe respektive sockerrör odlas. Goiás och Mato Grosso har dock varit åt det torra hållet. Som vi ser av prognoskartan framställd med GFS-modellen väntas såväl alla dessa viktiga delstater få riklig nederbörd. I och med detta borde prisuppgångarna på majs, soja, kaffe och socker sluta att få bränsle.
Europa som har varit ganska blött, fortsätter att få mer nederbörd över det normala över Polen, där det har talats om ett behov för mer nederbörd. Frankrike och södra Tyskland fortsätter att få rikligt med nederbörd. Finland får del av det torra väder som också finns över Ryssland, Ukraina och Vitryssland. Sverige och Danmark är också torrare än normalt, liksom Schleswig-Holstein och Niedersachsen i Tyskland.
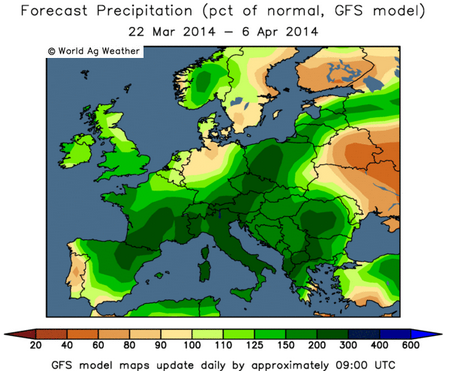
Som nämnt ovan, ser Ryssland, Ukraina och Vitryssland torrt ut. Prognoskartan nedan ger en tydligare bild av detta, vilket naturligtvis är ett potentiellt hot mot produktionsnivåerna framförallt för höstvetet, som odlas i de södra delarna. Värst är det i Kazakstan.
Vete
Vetepriset (november) stängde upp 1% på veckan, men rörde sig i ett intervall om 4%. Volatiliteten (prisrörligheten) har varit högre än på mycket länge, nästan i nivå med hur det var 2010. Detta återspeglar osäkerheten och oron i marknaden. Vad gäller utvecklingen i Ukraina har marknaden diskuterat väldigt lite fakta men det har funnits mycket oro. Det finns också en oro för torka i USA och de crop ratings som kommit för Texas och Kansas är riktigt dåliga och har försämrats. Nu är Texas och södra Kansas de torraste vetedistrikten i USA, men det finns en oro för hur det ser ut i resten av USA och att torkan ska förvärras.
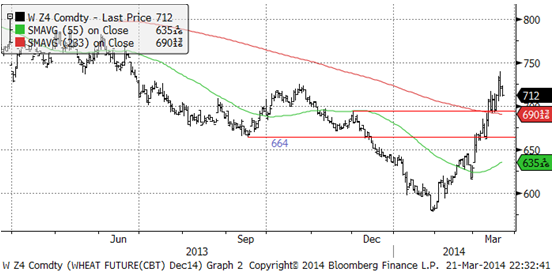
Chicagovetet steg kraftigt, men har nått upp till tekniska motståndsnivåer vid 700 -725 cent per bushel, där uppgången borde stöta på patrull.
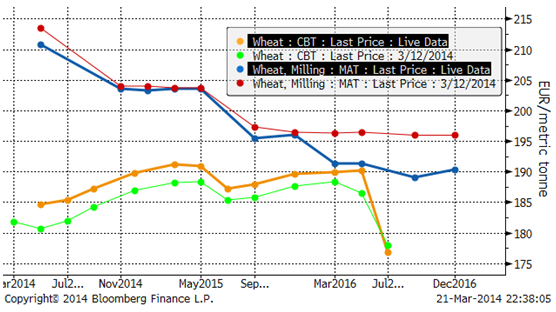
Nedan ser vi terminskurvorna för Chicagovete och Matif i fredags och veckan innan. Två saker är slående och har viktiga orsaker. För det första ser vi att terminskontrakt med kort återstående löptid föll i pris på Matif, men steg i Chicago. Orsaken till detta är bland annat att crop condition fortsatte att försämras i Texas och Kansas enligt veckans statistik från NASS (USDA). Samtidigt förbättrades crop condition i Frankrike enligt veckans statistik från FranceAgriMer. Dessutom ser sjönk exporten från Rouen, som är Frankrikes största exporthamn för spannmål och leveranspunkt för Matifkontrakten. Det andra vi noterar i diagrammet nedan är de väsentligt lägre priserna på terminer för leverans efter skörd 2015. Detta är en återspegling av rapporterna om väsentligt högre skörd även om två år, bland annat vad gäller Brasilien, men också i USA.
I Kansas steg andelen av vetet i ”poor” och ”very poor condition” från 18% förra veckan till 20% i måndags. I Texas steg andelen poor/very poor till 52% från 31%. I Frankrike å andra sidan steg andelen i good/excellent till 75% från 74% veckan innan enligt FranceAgriMer.
Prisuppgången har nått så långt att den gör att köpare avvaktar. Flera har redan legat i framkant. Egypten meddelade i veckan att de har köpt vete för att täcka behoven fram till juni/juli. I torsdags rapporterade hamnen i Rouen att spannmålsexporten från hamnen minskat med 14% på sju dagar till i onsdags. Exporten i sjudagarsperioden som slutade 19 mars minskade till 148.5 kt från 173 kt veckan innan. Av 148.5 kt var 121 kt vete och 27.5 kt korn. Algeriet står för huvuddelen av exporten och de minskade köpen med 25 kt till 108 kt. Rouen stod för 38% av Frankrikes export förra året och Algeriet är det största exportlandet.
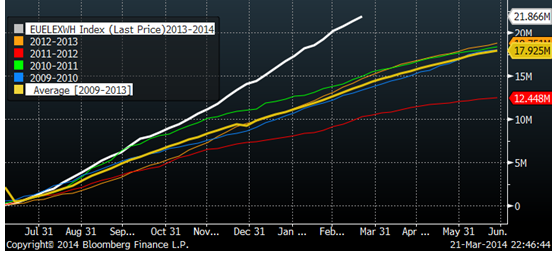
EU i sin helhet fortsätter att exportera vete i hög takt. Takten avtar, som den brukar, men inte alls lika mycket som tidigare år. Export inspections ligger nu på 21.866 mt (21.3 mt förra veckan), som är 8 mt högre än normalt. Frågan är – och jag har inte svaren – är detta ett resultat av de låga grispriserna i EU, att EU importerat majs från Ukraina (och USA) eller att spannmålsskörden generellt i världen är större än efterfrågan – med EU som symptom på överskottet?
Crop conditions i USA är ett observandum. De södra delstater som har börjat rapportera via NASS är också de som varit torrast och allra torrast har Texas varit. Frågan är hur det ser ut i resten av USA och det bör vi få svar på på måndag kväll, om jag uppfattat kalendern rätt.
Situationen för majsmarknaden ser ljusare mer bearish ut efter veckan som gått och förmodligen kommer den att påverka och kanske avgöra vart vetepriset ska ta vägen. För Matif ser det i vilket fall mindre positivt ut än för Chicagovetet. Eftersom vi fokuserar på Matif här, så blir det en kortsiktig säljrekommendation.
Maltkorn
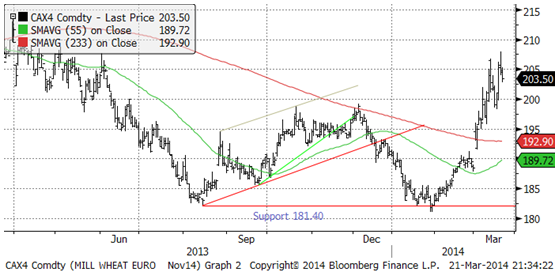
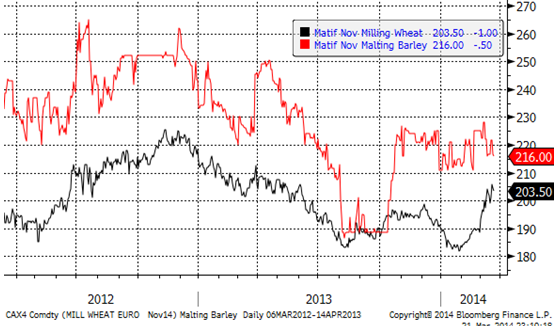
Maltkornsterminerna har gått ner den senaste tiden, samtidigt som vetet stärkts. Skillnden är nu 12.5 euro i pris för novemberkontrakten, vilket är ovanligt lite.
Majs
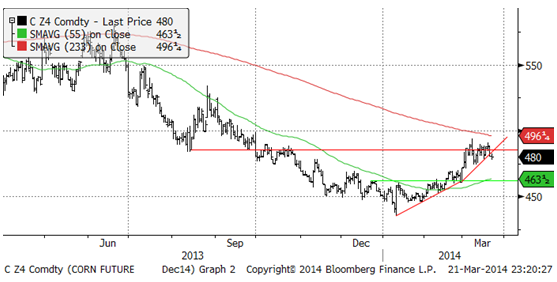
Decemberkontraktet på majs stängde i fredags under stödlinjen för den senaste månadens prisuppgång, vilket signalerar en svagare marknad i den närmaste framtiden – en rekyl nedåt.
Till viss del är det oron för att Ukraina inte ska kunna så och skörda majs i år som har drivit upp priset. Vi, liksom förmodligen många andra, har gjort kalkylen där vi sätter Ukrainas produktion till noll och ser hur det påverkar utgående lager på global basis. Utgående lager har en nästan linjär relation till priset. Tar vi bort Ukrainas 30 mt produktion förra året i den senaste WASDE-rapporten sänks utgående lager från 55 dagar av global konsumtion till 44 dagar. Förhållandet mellan lager och pris indikerar ett pris på ca 800 cent / bushel eller ca 65% högre än nu. Men då har vi antagit att ingen subsitution till andra spannmål sker och att ingen ransonering av konsumtionen sker. I verkligheten kommer konsumtionen av t ex vete att stiga, vilket innebär en prisuppgång på vete och en mindre prisuppgång än 65% på majs. Ransonering av konsumtionen minskar också prisuppgången. Det är inte heller sannolikt att hela Ukrainas produktion går om intet och det är inte heller troligt att det Ukraina är borta som producent för all framtid. Man kan tåla lägre lager ett år om man vet att utbudet kommer tillbaka.
En sansad bedlömning är att Ukrainas produktion av majs i år uppgår till mellan 20 och 27 miljoner ton. Orsaken är att mindre lantbruk med sämre sämre finansiering, som inte redan köpt utsäde, gödsel, drivmedel och bekämpningsmedel, har svårt att få finansiering till detta. Det är också troligt att lantbruksföretag som har köpt eller har råd med utsäde, saknar pengar för tillräckligt med gödsel och bekämpningsmedel, vilket också leder till en lägre skörd totalt sett. Om vädret också blir riktigt dåligt kan man se en skörd på 20 mt, annars faktiskt ganska bra.
En konsekvens av de lokala (lokalt finansierade) spannmålshandelsföretagen har svårt att få finanansiering och därmed ge finansiering till sina leverantörer, är att de stora globala företagen tar marknadsandelar. Värst drabbade är därför kanske inte lantbrukarna, utan de lokala spannmålshandlarna.
Om vi nu slutligen resonerar kring att bortfallet på globala balanser inte blir 30 mt, utan som värst 10 mt, blir effekten på prisuppgången drygt 20% på majs, allt annat lika. Med substitution till andra spannmål, främst vete, stannar kanske prisuppgången på 10%. Och detta är precis den prisuppgång vi har sett. Och då ges 10% av det värsta utfallet vi kan se nu. Slutsatsen av resonemanget är att prisuppgången är omotiverat stor. Ett annat sätt att uttrycka sig är att priset innehåller en rejäl riskpremie för en osannolik försämring av läget i Ukraina.
Den 31 mars publicerar USDA den viktiga rapporten ”prospective plantings”. Gissningarna om vad den kommer att säga är i full gång. I torsdags sade analyschefen på AgResource i ett tal i Geneve att arealen för majs, sojabönor, vete och bomull i USA kan bli 242.2 miljoner acres i år, jämfört med USDA:s estimat från Outlook Forum i Februari på 238.5 miljoner acres. AgResource väntar sig 93.5 miljoner acres majs (förra året 95.4 enligt USDA), sojabönor 81.7 miljoner acres (77.7 förra året), vete 56 miljoner acres och bomull 11 miljoner acres. AgResource menade också att det kalla vädret inte påverkar sådden, eftersom hela vårbruket nuförtiden kan klaras av på en vecka om det blir bra väder.
Vi har tidigare pekat på att sojabönor har högre lönsamhet efter att majs fallit och sojabönor hållit ställningarna på marknaden. Detta gäller dock inte överallt och alla gör inte samma kalkyl.
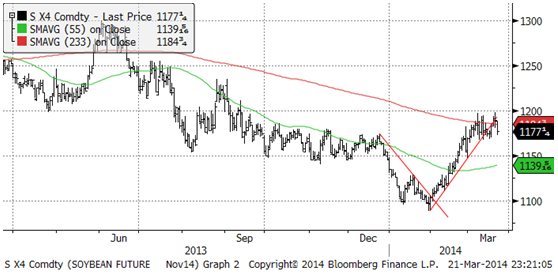
Farmdoc vid University of Illinois skrev i fredags om kostnaderna för att producera en bushel majs respektive en bushel sojabönor under 2013 i Illinois. Den genomsnittliga kostnaden för majs var 5.03 dollar per bushel. För sojabönor var det 12.45 dollar per bushel. Vi kan jämföra dessa kostnader med priset på terminskontraktet för december 14 för majs och november 14 för sojabönor. Majsterminen står just nu i 480 cent, vilket är 4.5% under den genomsnittliga kostnaden. Sojaterminen står i 1177, vilket är 5.5% under kostnaden. Det är möjligt att kostnaden är lägre i år. Priset på kväve (urea FOB New Orleans) är på samma prisnivå som för ett år sedan, på 400 dollar per ton. Under hösten var dock priset 25% lägre och lantbrukare kan ha köpt på de priserna. Drivmedel ligger på ungefär samma prisnivå som förra året. Återstår förhoppningen om att skörden blir större (vilket sänker kostnaden per bushel). Skörden per acre var 158.8 bushels per acre förra året i genomsnitt per skördad acre, vilket faktiskt är ganska högt i ett historiskt perspektiv. När kostnaden är så hög i förhållande till priset, kan man kanske undra om mindre kommer att bli sått. Då måste man betänka att vissa kostnader finns ändå, mest uppenbar är kostnaden för marken. Detta gör att det trots allt kan vara bättre att odla än att inte odla, även om det leder till en förlust. Förlusten kanske är större om man inte odlar. Den här räkneövningen pekar ändå på att majs inte längre är det sämsta alternativet för lantbrukarna, i vart fall inte i Illinois.
Lantbrukarna I Mato Grosso hade per i torsdags sått 99.8% av majs som andragröda. CONAB estimerar att förstaskörden som odlas i södra Brasilien ger 31.4 mt och andraskörden som tas i Mato Grosso ger 43.8 mt, totalt alltså 74.9 mt. Det är något lägre än förra året, men högre än USDA:s estimat på 70 mt. Det är väntat att lantbrukarna i Mato Grosso odlar mer soja som andragröda efter första skörden av soja. IMEA, Mato Grossos lantbruksinsitut bekräftade i en rapport i fredags att majsarealen blir 12% lägre i år pga de lägre priserna på majs.
Ska man sammanfatta läget, så talar det mesta för att uppgången fått slut på bränsle. Till viss del utgörs priset av en riskpremie för ett värsta utfall i Ukraina, som troligtvis inte kommer att besannas. Vi tror att en kortsiktig rekyl nedåt kommer och rekommenderar kortsiktigt att ha en kort position i majs.
Sojabönor
Novemberkontraktet på sojabönor i Chicago har gjort två misslyckade försök att handla över 1200 cent per bushel. Istället vände priset ner och bröt den tekniska stödlinjen för uppgången från 1100 cent. Detta signalerar att en rekyl nedåt kan vara nära förestående i det kortsiktiga perspektivet.
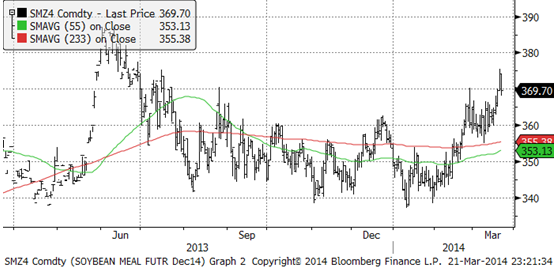
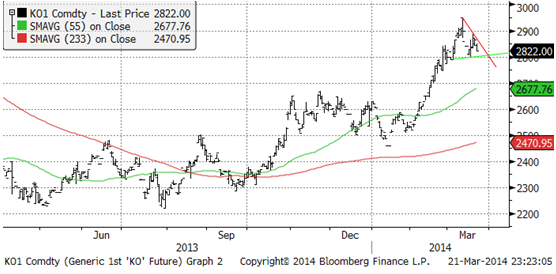
Sojamjölet steg med 360 dollar som stödnivå. Prisuppgången kan troligtvis gå lite högre ur ett tekniskt perspektiv, men vi skulle inte rekommendera att ta nya långa (köpta) positioner vid dagens nivå. Uppåtrörelsen borde vara nästan avklarad ur ett tekniskt perspektiv.
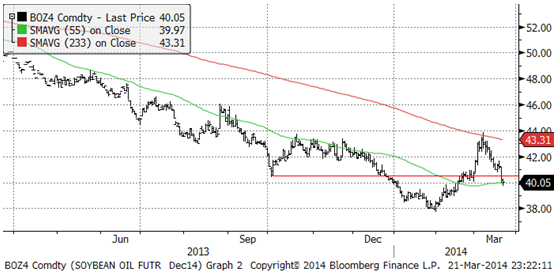
Sojaoljan föll fritt ner till det tekniska stödet på 40 cent per pund. Momentum i prisrörelsen är för starkt för att priset ska tvärvända uppåt och ur tekniskt perspektiv borde vi se priset fortsätta falla.
I fredags rapporterades att produktionen av palmolja väntas öka med 11% till 2.1 mt i mars. Detta är baserat på fem estimat från industrin. Det blir första gången på sex månader som produktionen stiger. Priset på palmolja har fortsatt fallet. Jag skrev förra veckan om att ”det kan bli en kraftig rekyl nedåt”. Det visade sig korrekt. Rekylen nedåt har dock ännu inte riktigt börjat på allvar. Sätter den igång, kan priset rasa ner till 2650 MYR.
Sojaskörden i Brasiliens delstat Mato Grosso som producerar mest sojabönor, är i det närmaste avslutad, 7.5% av arealen återstår att skörda. I hela landet är 67% klart (förra veckan 59%) skördat, enligt en rapport från Safras & Mercados i fredags. Det är lite snabbare än förra året samma tid då 64% var skördat.
I Mato Grosso estimeras skörden uppgå till 26.8 mt. Det är 13% mer än förra året. Mato Grosso har inte drabbats av torka, men det har andra delstater med sojaproduktion. CONAB estimerar nu därför en nationell produktion på 85.44 mt (82 mt förra året), vilket är ett nytt rekord.
Raps
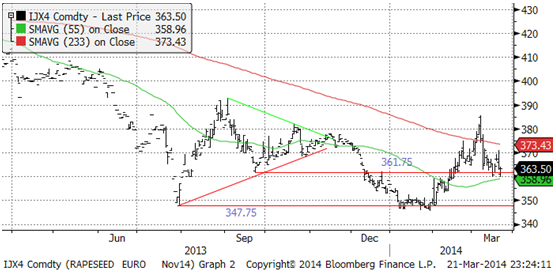
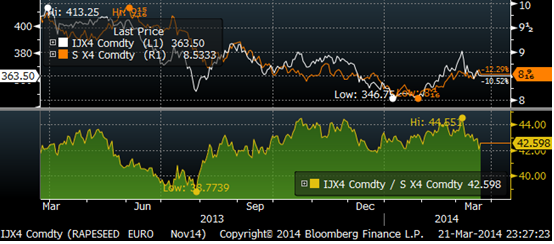
Rapspriset stängde i princip oförändrat på veckan. Det tekniska stödet på 361.75 verkar hålla emot väl. Om det bryts kan priset gå ända ner till 347.50 och böra ett tredje försök att gå genom det.
Kanada har nu ”tinat” och pressningen av canola tar fart. Det har fått priset på canola att falla. Vi ser inte motsvarande prisfall i rapsfröet på Matif. Spreaden mellan novemberkontrakten på Matif och i Winnipeg har vidgats genom från 15% till 20%. Det ger dem som missade tillfället förra gången en ny möjlighet att ta en position i spreaden genom att köpa Winnipeg november canola i eurotermer och sälja Matif.
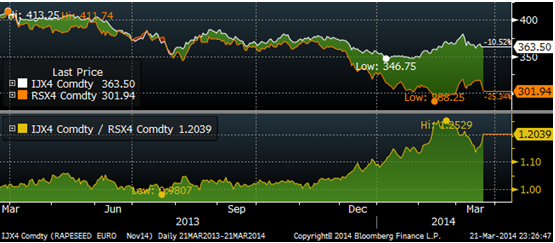
Nedanför ser vi kvoten mellan rapsfrö (november) och sojabönor (november, omräknat till euro). Vi ser att priserna hänger ihop och sällan avviker mycket från sin relation. Rapsfröet var på en ”dyr” nivå i början av mars, men prisfallet på Matif och en stark marknad för sojabönor, har gjort rapsen billig. Detta talar mot ett stort prisfall på raps, i vart fall om det inte blir ett ännu större prisfall på sojabönor.
Vi fortsätter med säljrekommendation på raps.
Potatis
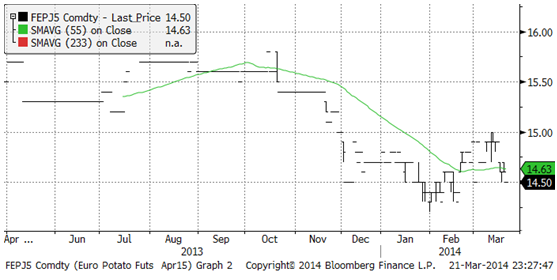
Potatis för leverans i april nästa år föll 40 eurocent till 14.50 euro per 100 Kg.
Gris
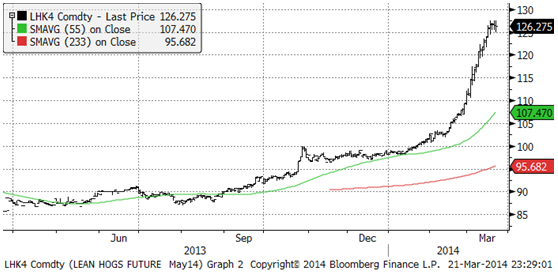
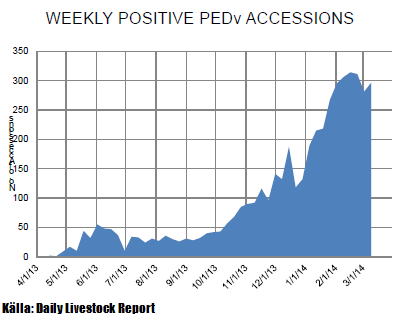
Prisuppgången i Lean Hogs tycks ha hejdats mellan 125 och 130 cent per pund, för maj-kontraktet. Anledningen till detta är att spridningen av PED-viruset tycks ha kulminerat i USA. Marknaden är också spänd inför Quarterly Hogs and Pigs Report från USDA på fredag.
På fredag publicerar USDA den kvartalsvisa Hogs and Pigs Report. Inför den kan det vara bra att ta en titt på läget med PED-viruset (porcine diarrhea virus). Den upptäcktes först på en gård i Iowa i maj förra året. Virusstammen är identisk med en stam som finns i Kina. Det har tillkommit två andra stammar, som också har kommit in från Kina. PED sprids som alla virus bäst i kyla och därför är det inte förvånande att spridningen ökade har ökat under vintern. Antalet nyrapporterade fall per vecka nådde en topp på drygt 310 fall i februari och har nu sjunkit till under 300. Den senaste veckan noterades dock en uppgång, men förhoppningsvis har epidemin kulminerat.
Det finns inget vaccin mot viruset och eftersom det är ett virus finns ingen medicin att ge grisarna. Det enda motmedlet är att föda tillbaka smitta via maten till suggorna. Suggorna utvecklar då antikroppar, som kommer smågrisarna till del via hennes råmjölk. Detta innebär också att immuna suggor blir värdefulla och behålls längre än vad de annars skulle göra.
PED är inte en smittskyddsklassad sjukdom som mul- och klövsjuka, svinpest och afrikansk svinpest. Därför påverkar den inte exporten. Även om priset är högt på fläskkött i USA, har uppfödarna allt för mycket att göra med sjukdomen för att öka produktionen. Eftersom sjukdomen drabbar smågrisar och kulmen precis har nåtts, kommer effekten på utbudet av fläskkött med ca 6 – 8 veckors eftersläpning. Terminspriserna på Lean Hogs är högst för juni, 130 cent, medan de är väsentligt lägre efter oktober. För december 2014 är terminspriset 90 cent. Dessa priser bygger förstås på att sjukdomen verkligen kulminerat och kan utrotas under sommaren.
I EU kämpar man med att återuppta exporten till länder som stoppat den pga de två vildsvinen från Vitryssland. Inga nya fall har rapporterats, varken från tamgrisar eller vildsvin.
Spotkontraktet på EUREX Hogs är på ungefär samma pris som förra veckan.
Mjölk
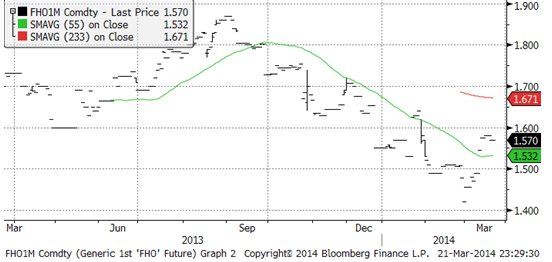
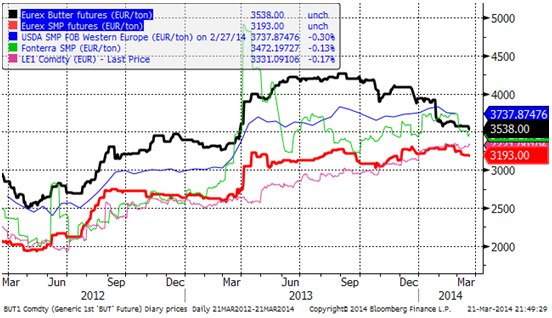
Smörterminerna på Eurex fortsatte sjunka i veckan: från 3575 euro per ton till 3538 euro. Förra veckan skrev vi hur ”dyrt” smör är i förhållande till vegetabilisk olja och jämförde med rapsolja. Vid sommaren förra året var smöret 6 gånger dyrare än rapsoljan och har nu sjunkit till 4.8 gånger dyrare. Det är dock fortfarande väsentligt över relationen i april för två år sedan när smöret var 2.5 gånger dyrare än rapsolja.
SMP var dock oförändrat i veckan på 3193 euro per ton. Fonterras notering sjönk, men på CME i Chicago steg terminerna på SMP. I USA finns en oro för att Kalifornien ska drabbas av torka. Inte bara drabbar det den redan hårt ansträngda vinproduktionen i världen (Frankrike förlorade 40% av sin skörd i höstas i Bordeaux och Bourgogne pga hagel), utan även mjölkproduktionen i Kalifornien.
I diagrammet nedan är alla priser omräknade till Euro per ton.
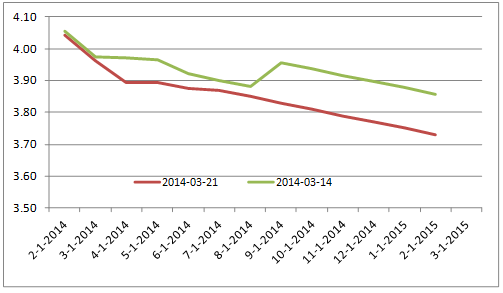
Nedan ser vi terminspriserna man får i svenska kronor från terminspriserna på SMP och smör på Eurex, omräknat till kronor per kilo mjölkråvara. Notera att hela den här prisnivån alltid ska ligga över avräkningspriset på mjölkråvara med ca 50 öre, som är en uppskattning av kostnaden för att förädla mjölkråvara till SMP och smör. Fram till och med augusti finns nu regelmässigt priser på Eurex. Därefter är det mina estimat om var jag tror en köpkurs är.
Förra veckan fanns en köporder på smör i oktoberkontraktet (men ingen säljorder) som låg i nivå med augusti månads säljsida. Den ordern och det priset finns nu inte kvar, därför har terminspriskurvan fallit ner igen den här veckan. Den (mjölkbonde) som skaffat sig avtal och limit-utrymme hos banken att göra affärer, kan utnyttja den sortens tillfällen i t ex smör eller SMP och sälja dessa, när det dyker upp frikostiga köpordrar i marknaden. Man måste inte handla ”paketet” av smör och SMP, som vi för enkelhets skull har tagit fram. Man kan handla kontrakt i smör och SMP på börsen som OTC. Det är då fem ton SMP respektive smör per kontrakt.
Förra veckan fanns en köporder på smör i oktoberkontraktet (men ingen säljorder) som låg i nivå med augusti månads säljsida. Den ordern och det priset finns nu inte kvar, därför har terminspriskurvan fallit ner igen den här veckan. Den (mjölkbonde) som skaffat sig avtal och limit-utrymme hos banken att göra affärer, kan utnyttja den sortens tillfällen i t ex smör eller SMP och sälja dessa, när det dyker upp frikostiga köpordrar i marknaden. Man måste inte handla ”paketet” av smör och SMP, som vi för enkelhets skull har tagit fram. Man kan handla kontrakt i smör och SMP på börsen som OTC. Det är då fem ton SMP respektive smör per kontrakt.
Vi tycker att dagens nivå på terminer på mjölk är en bra nivå för prissäkring i ett längre perspektiv.
Socker
Väderleksprognosen för Brasiliens Sao Paulo, den viktigaste producenten av sockerrör, visar nederbörd över det normala för de kommande två veckorna. Det har redan regnat ordentligt de senaste två veckorna och om väderleksprognosen som nu ligger slår in, kan man sätta punkt för torkan i Brasilien.
En rundringning bland sockerhandlare som Bloomberg genomförde i fredags visar att dessa är mer negativa till marknaden än de varit på sju veckor.
Torkan har egentligen inte primärt drabbat sockerrörsdelstaten Sao Paulo, utan kaffeproducerande delstaten Minas Gerais. Macquarie sänkte estimatet för sockerrörsskörden från 585 mt till 575 mt pga torkan. Det blev inte mer.
Tekniskt har priset på maj-terminen rasat ner till en stödnivå, där prisfallet kan hejdas i vart fall temporärt.
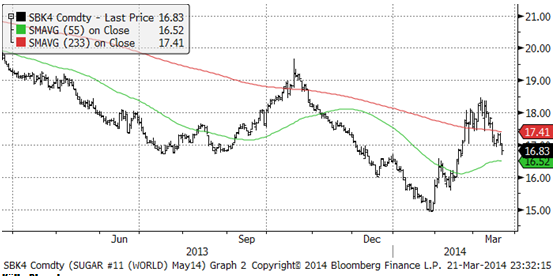
Vi fortsätter att ha neutral vy på sockerpriset.
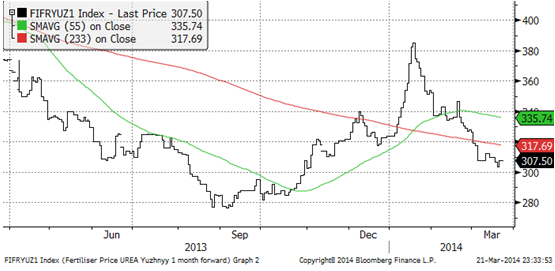
Gödsel
Urea-priset, FOB Yuzny, ligger kvar på låg nivå vid 310 dollar per ton.
[box]SEB Veckobrev Jordbruksprodukter är producerat av SEB Commodities Sales desk och publiceras i samarbete och med tillstånd på Råvarumarknaden.se[/box]
Detta marknadsföringsmaterial, framtaget av SEB’s Commodities Sales desk, har upprättats enbart i informationssyfte.
Även om innehållet är baserat på källor som SEB bedömt som tillförlitliga ansvarar SEB inte för fel eller brister i informationen. Den utgör inte oberoende, objektiv investeringsanalys och skyddas därför inte av de bestämmelser som SEB har infört för att förebygga potentiella intressekonflikter. Yttranden från SEB’s Commodities Sales desk kan vara oförenliga med tidigare publicerat material från SEB, då den senare hänvisas uppmanas du att läsa den fullständiga rapporten innan någon åtgärd vidtas.
Dokumentationen utgör inte någon investeringsrådgivning och tillhandahålls till dig utan hänsyn till dina investeringsmål. Du uppmanas att självständigt bedöma och komplettera uppgifterna i denna dokumentation och att basera dina investeringsbeslut på material som bedöms erforderligt. Alla framåtblickande uttalanden, åsikter och förväntningar är föremål för risker, osäkerheter och andra faktorer och kan orsaka att det faktiska resultatet avviker väsentligt från det förväntade. Historisk avkastning är ingen garanti för framtida resultat. Detta dokument utgör inte ett erbjudande att teckna några värdepapper eller andra finansiella instrument. SEB svarar inte för förlust eller skada – direkt eller indirekt, eller av vad slag det vara må – som kan uppkomma till följd av användandet av detta material eller dess innehåll.
Observera att det kan förekomma att SEB, dess ledamöter, dess anställda eller dess moder- och/eller dotterbolag vid olika tillfällen innehar, har innehaft eller kommer att inneha aktier, positioner, rådgivningsuppdrag i samband med corporate finance-transaktioner, investment- eller merchantbankinguppdrag och/eller lån i de bolag/finansiella instrument som nämns i materialet.
Materialet är avsett för mottagaren, all spridning, distribuering mångfaldigande eller annan användning av detta meddelande får inte ske utan SEB:s medgivande. Oaktat detta får SEB tillåta omfördelning av materialet till utvald tredje part i enlighet med gällande avtal. Materialet får inte spridas till fysiska eller juridiska personer som är medborgare eller har hemvist i ett land där sådan spridning är otillåten enligt tillämplig lag eller annan bestämmelse.
Skandinaviska Enskilda Banken AB (publ) är ett [publikt] aktiebolag och står under tillsyn av Finansinspektionen samt de lokala finansiella tillsynsmyndigheter i varje jurisdiktionen där SEB har filial eller dotterbolag.

The latest weekly report from the US DOE showed a substantial drawdown across key petroleum categories, adding more upside potential to the fundamental picture.

Commercial crude inventories (excl. SPR) fell by 5.8 million barrels, bringing total inventories down to 415.1 million barrels. Now sitting 11% below the five-year seasonal norm and placed in the lowest 2015-2022 range (see picture below).
Product inventories also tightened further last week. Gasoline inventories declined by 2.1 million barrels, with reductions seen in both finished gasoline and blending components. Current gasoline levels are about 3% below the five-year average for this time of year.
Among products, the most notable move came in diesel, where inventories dropped by almost 4.1 million barrels, deepening the deficit to around 20% below seasonal norms – continuing to underscore the persistent supply tightness in diesel markets.
The only area of inventory growth was in propane/propylene, which posted a significant 5.1-million-barrel build and now stands 9% above the five-year average.
Total commercial petroleum inventories (crude plus refined products) declined by 4.2 million barrels on the week, reinforcing the overall tightening of US crude and products.


A classic case of “buy the rumor, sell the news” played out in oil markets, as Brent crude has dropped sharply – down nearly USD 10 per barrel since yesterday evening – following Iran’s retaliatory strike on a U.S. air base in Qatar. The immediate reaction was: “That was it?” The strike followed a carefully calibrated, non-escalatory playbook, avoiding direct threats to energy infrastructure or disruption of shipping through the Strait of Hormuz – thus calming worst-case fears.
After Monday morning’s sharp spike to USD 81.4 per barrel, triggered by the U.S. bombing of Iranian nuclear facilities, oil prices drifted sideways in anticipation of a potential Iranian response. That response came with advance warning and caused limited physical damage. Early this morning, both the U.S. President and Iranian state media announced a ceasefire, effectively placing a lid on the immediate conflict risk – at least for now.
As a result, Brent crude has now fallen by a total of USD 12 from Monday’s peak, currently trading around USD 69 per barrel.
Looking beyond geopolitics, the market will now shift its focus to the upcoming OPEC+ meeting in early July. Saudi Arabia’s decision to increase output earlier this year – despite falling prices – has drawn renewed attention considering recent developments. Some suggest this was a response to U.S. pressure to offset potential Iranian supply losses.
However, consensus is that the move was driven more by internal OPEC+ dynamics. After years of curbing production to support prices, Riyadh had grown frustrated with quota-busting by several members (notably Kazakhstan). With Saudi Arabia cutting up to 2 million barrels per day – roughly 2% of global supply – returns were diminishing, and the risk of losing market share was rising. The production increase is widely seen as an effort to reassert leadership and restore discipline within the group.
That said, the FT recently stated that, the Saudis remain wary of past missteps. In 2018, Riyadh ramped up output at Trump’s request ahead of Iran sanctions, only to see prices collapse when the U.S. granted broad waivers – triggering oversupply. Officials have reportedly made it clear they don’t intend to repeat that mistake.
The recent visit by President Trump to Saudi Arabia, which included agreements on AI, defense, and nuclear cooperation, suggests a broader strategic alignment. This has fueled speculation about a quiet “pump-for-politics” deal behind recent production moves.
Looking ahead, oil prices have now retraced the entire rally sparked by the June 13 Israel–Iran escalation. This retreat provides more political and policy space for both the U.S. and Saudi Arabia. Specifically, it makes it easier for Riyadh to scale back its three recent production hikes of 411,000 barrels each, potentially returning to more moderate increases of 137,000 barrels for August and September.
In short: with no major loss of Iranian supply to the market, OPEC+ – led by Saudi Arabia – no longer needs to compensate for a disruption that hasn’t materialized, especially not to please the U.S. at the cost of its own market strategy. As the Saudis themselves have signaled, they are unlikely to repeat previous mistakes.
Conclusion: With Brent now in the high USD 60s, buying oil looks fundamentally justified. The geopolitical premium has deflated, but tensions between Israel and Iran remain unresolved – and the risk of missteps and renewed escalation still lingers. In fact, even this morning, reports have emerged of renewed missile fire despite the declared “truce.” The path forward may be calmer – but it is far from stable.
Analys
A muted price reaction. Market looks relaxed, but it is still on edge waiting for what Iran will do
Brent crossed the 80-line this morning but quickly fell back assigning limited probability for Iran choosing to close the Strait of Hormuz. Brent traded in a range of USD 70.56 – 79.04/b last week as the market fluctuated between ”Iran wants a deal” and ”US is about to attack Iran”. At the end of the week though, Donald Trump managed to convince markets (and probably also Iran) that he would make a decision within two weeks. I.e. no imminent attack. Previously when when he has talked about ”making a decision within two weeks” he has often ended up doing nothing in the end. The oil market relaxed as a result and the week ended at USD 77.01/b which is just USD 6/b above the year to date average of USD 71/b.

Brent jumped to USD 81.4/b this morning, the highest since mid-January, but then quickly fell back to a current price of USD 78.2/b which is only up 1.5% versus the close on Friday. As such the market is pricing a fairly low probability that Iran will actually close the Strait of Hormuz. Probably because it will hurt Iranian oil exports as well as the global oil market.
It was however all smoke and mirrors. Deception. The US attacked Iran on Saturday. The attack involved 125 warplanes, submarines and surface warships and 14 bunker buster bombs were dropped on Iranian nuclear sites including Fordow, Natanz and Isfahan. In response the Iranian Parliament voted in support of closing the Strait of Hormuz where some 17 mb of crude and products is transported to the global market every day plus significant volumes of LNG. This is however merely an advise to the Supreme leader Ayatollah Ali Khamenei and the Supreme National Security Council which sits with the final and actual decision.
No supply of oil is lost yet. It is about the risk of Iran closing the Strait of Hormuz or not. So far not a single drop of oil supply has been lost to the global market. The price at the moment is all about the assessed risk of loss of supply. Will Iran choose to choke of the Strait of Hormuz or not? That is the big question. It would be painful for US consumers, for Donald Trump’s voter base, for the global economy but also for Iran and its population which relies on oil exports and income from selling oil out of that Strait as well. As such it is not a no-brainer choice for Iran to close the Strait for oil exports. And looking at the il price this morning it is clear that the oil market doesn’t assign a very high probability of it happening. It is however probably well within the capability of Iran to close the Strait off with rockets, mines, air-drones and possibly sea-drones. Just look at how Ukraine has been able to control and damage the Russian Black Sea fleet.
What to do about the highly enriched uranium which has gone missing? While the US and Israel can celebrate their destruction of Iranian nuclear facilities they are also scratching their heads over what to do with the lost Iranian nuclear material. Iran had 408 kg of highly enriched uranium (IAEA). Almost weapons grade. Enough for some 10 nuclear warheads. It seems to have been transported out of Fordow before the attack this weekend.
The market is still on edge. USD 80-something/b seems sensible while we wait. The oil market reaction to this weekend’s events is very muted so far. The market is still on edge awaiting what Iran will do. Because Iran will do something. But what and when? An oil price of 80-something seems like a sensible level until something do happen.


Nickelmarknaden under fortsatt press – överskott väntas bestå till 2026

Westinghouse planerar tio nya stora kärnreaktorer i USA – byggstart senast 2030

Eurobattery Minerals förvärvar majoritet i spansk volframgruva

USA ska införa 50 procent tull på koppar

Ryska staten siktar på att konfiskera en av landets största guldproducenter

Mahvie Minerals växlar spår – satsar fullt ut på guld
A muted price reaction. Market looks relaxed, but it is still on edge waiting for what Iran will do

Jonas Lindvall är tillbaka med ett nytt oljebolag, Perthro, som ska börsnoteras

Oljan, guldet och marknadens oroande tystnad

Domstolen ger klartecken till Lappland Guldprospektering
-
 Nyheter4 veckor sedan
Mahvie Minerals växlar spår – satsar fullt ut på guld
-
Analys4 veckor sedan
A muted price reaction. Market looks relaxed, but it is still on edge waiting for what Iran will do
-
 Nyheter3 veckor sedan
Jonas Lindvall är tillbaka med ett nytt oljebolag, Perthro, som ska börsnoteras
-
 Nyheter3 veckor sedan
Oljan, guldet och marknadens oroande tystnad
-
 Nyheter3 veckor sedan
Domstolen ger klartecken till Lappland Guldprospektering
-
Analys3 veckor sedan
Tightening fundamentals – bullish inventories from DOE
-
 Nyheter2 veckor sedan
Ryska staten siktar på att konfiskera en av landets största guldproducenter
-
 Nyheter2 veckor sedan
Lundin Mining ska bli en av de tio största kopparproducenterna i världen