

Analys
SEB Jordbruksprodukter, 24 februari 2014

 En kund till SEB har prissäkrat mjölk i kronor per kilo för första gången, basis Eurex terminer på SMP och smör. Marknadsläget är bra för det. Dels är priset på börsen högt och dels är skillnaden till det svenska avräkningspriset stor.
EURSEK har stigit från 8.82 för en vecka sedan till 8.97 i fredags, eller med nästan 2%. Det innebär att priset på jordbruksprodukter i svenska kronor gått upp med motsvarande nästan 4 euro på vetepriset och 8 öre på mjölkpriset.
Det har varit stora prisuppgångar på jordbruksprodukter, men mest på sådant som inte produceras i Sverige. Kaffepriset steg 20% på torkan i Brasilien och amerikanska Lean Hogs, de korta kontrakten, steg med 15% pga stark ekonomi och efterfrågan och att spridningen av PED-viruset inte nått kulmen än. Gammal skörd av havre rusade också, men även det är på den amerikanska marknaden. Majspriset steg, drivet av etanolpriset, som drev av oljepriset och sojaoljan steg samtidigt som palmoljan i Malaysia nådde årshögsta. På den här sidan Atlanten var det också en positiv vecka med prisuppgångar på 2% på det mesta.
USDA:s Outlook Conference i torsdags och i fredags, som mest handlade om majs och sojabönor med vetet i skymundan, förutspår ett genomsnittpris på majs under marknadsföringsåret som börjar den första september 2014, på 390 cent per bushel (från 450 i år). För sojabönor förutspår USDA ett genomsnittligt pris på 965 cent (från 1270 i år). Priserna på december-majs ligger just nu på 464 cent och november-sojabönor på 1153.
Odlingsväder
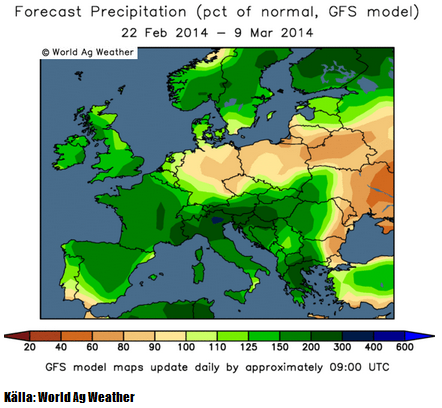
Iskylan och snöstormarna i norra USA har avlöst varandra och en ny storm väntas om några dagar. Det finns en oro för torka längre söderut. I kartbilden nedanför ser vi avvikelsen från det normala i tvåveckorsprognosen enligt GFS-modellen. Som synes väntas mindre nederbörd än normalt i de för jordbruk viktigaste delstaterna i USA.
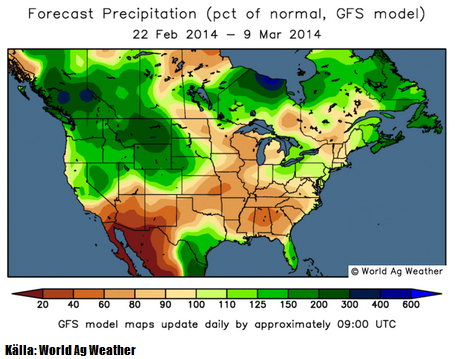
Trots det latenta hotet om torka i USA förutspår USA en hektarskörd på majs som är högre än vad som kan väntas rent statistiskt, inklusive trenden till högre hektarskörd alltså.
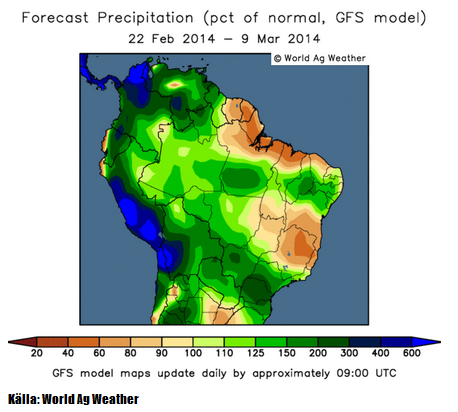
Västra Brasilien har fått – och väntas som vi ser av prognosbilden nedan, få mer nederbörd. Allt annat lika fördröjer det skörden av sojabönor i Mato Grosso, men är bra för sommargrödans start. Delstaten Minas Gerais, där kaffe odlas, väntas fortsätta få 40 – 90% av normal nederbörd. Södra delen av Brasilien väntas få upp till 3 gånger den normala nederbörden, med fokus på São Paulo och Paraná. Den främsta grödan i dessa delstater är nuförtiden sockerrör och i Paraná även sojabönor. Regnet kommer för sent för att påverka sojan där, som redan är torkskadad.
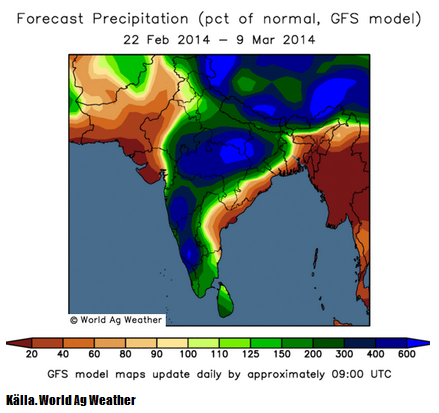
Ännu inte så uppmärksammat är den myckna nederbörd som fallit över stora delar av Indien. I den norra delen ligger Indiens centrum för sockerproduktionen. Rapporter därifrån säger att produktionen blir mindre, eftersom regnet försämrar kvaliteten på sockerrören i och med förseningarna.
EU har överlag bra väder med nederbörd något över det normala och så väntas det fortsätta. Vi ser inte ens speciellt mycket regn över England och dess massivt översvämmade Somerset Levels. Det har nu visat sig att översvämningarna där inte beror på regnet i sig, utan på att förra Labour-regeringen och Naturvårdsverket i England, i samarbete med WWF medvetet ville skapa våtmark och därmed förbjöd den sedvanliga muddringen av floden, tog bort pumpar och började vattenfylla landet redan i höstas, trots att det inte funnits våtmark generellt där sedan 1200-talet. Översvämningskatastrofen är alltså ”man made” i miljövårdande syfte och inte representativ för resten av England eller resten av EU. Istället är höstvetet i mycket gott skick i t ex Frankrike, som fått lika mycket nederbörd. Det kan tilläggas att endast 30% av arealen i Somerset Levels odlas, resten är betesmark. Påverkan på spannmålsmarknaden är noll.
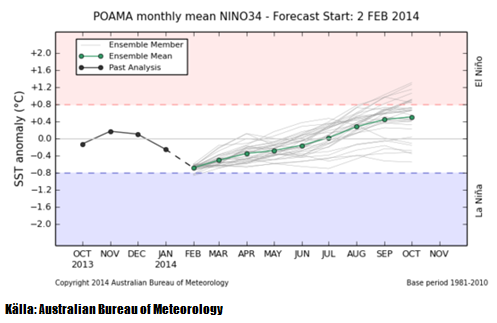
Ett hot skulle kunna vara om ett La Niña utvecklade sig till norra halvklotet sommar. Som vi ser i ensembleprognosen från Australiens meteorologiska byrå, kan man vänta sig neutral ENSO. Risken är snarare större för El Niño framåt södra halvklotets vår. El Niño gör att det blir torrt i Australien och vått Nord- och Sydamerika. Medan La Niña har en korrelation med högre pris på spannmål och oljeväxter, har El Niño ingen sådan korrelation alls. Men det mest sannolika är just nu enligt prognosen, att det blir neutrala förhållanden.
Vete
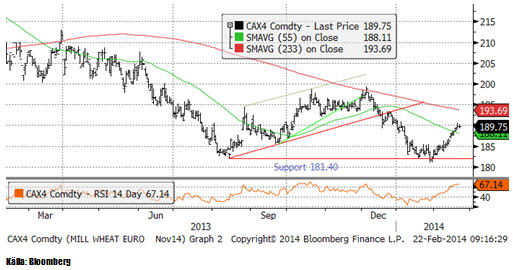
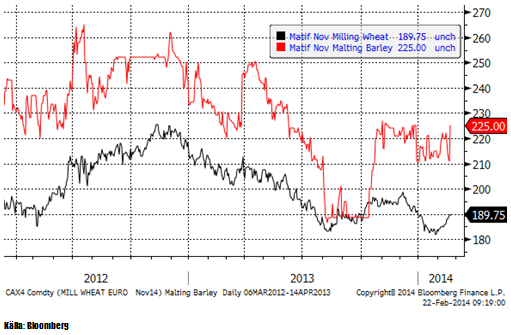
Matifs novemberkontrakt har nått upp till 190 euro, vilket tidigare har utgjort en teknisk stödnivå och nu alltså kan vara en motståndsnivå. RSI (nedre delen av diagrammet) är nästan på ”överköpt” nivå, vilket antyder att uppgången kan ha kört slut på kraft.
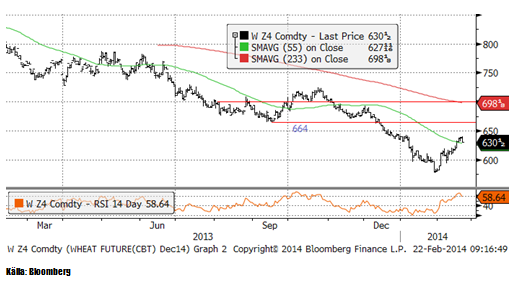
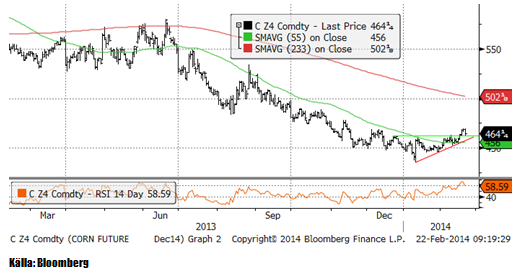
Nedanför ser vi Chicagovetet (Dec 14), som steg under nästan hela veckan, men avslutade med ett relativt stort prisfall.
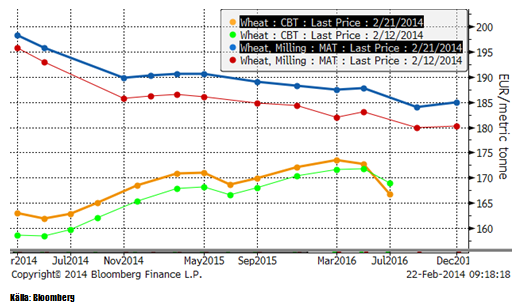
Nedan ser vi terminskurvorna för Chicagovete och Matif i fredags och veckan innan.
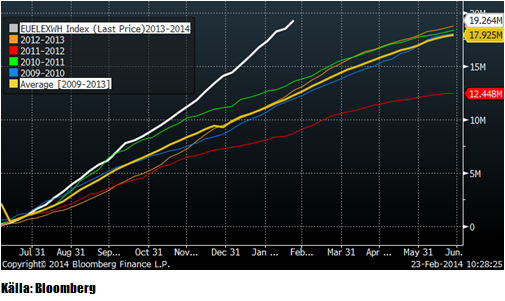
EU:s export har varit exceptionellt stark den här säsongen. Enligt EU:s statistik har 19.3 mt exporterats sedan säsongen började den 1 juli. Ett tidigare normalår skulle ligga på ungefär 12.5 mt så här års.
Oroligheterna i Ukraina verkar vara över, men det återstår att bilda en övergångsregering till dess val ska hållas i maj. Ordning, krediter, utsäde, drivmedel och gödsel ska fram för att vårbruket ska kunna starta i ett land som är bankrutt. Ryssland har stoppat köpen av Ukrainska statspapper (ett ryskt hjälpprogram) till dess oppositionen också lämnar in sina vapen, så allt är inte frid och fröjd i landet än. Höstvetet verkar dock må väldigt bra, precis som i EU, när det nu är på väg ur vintervilan.
Vid Outlook-konferensen angav USDA höstsådd areal till 57 mA, ner med 1.5 mA. Det var egentligen positiva nyheter, men vetepriset föll ändå ovanligt kraftigt på fredagen. USDA förutspådde att amerikanska lager stiger till 587 Mbu före skörden nästan år, jämfört med 558 Mbu som förutspås för den första juni i år. De väntar sig att produktionen stiger med 1.4% till 2.16 Bbu eftersom andelen skördad areal stiger. USA:s export väntas samtidigt falla med 11% till 1.05 Bbu från 1.175 Bbu i år. De förklarar detta med att Kanadas logistiska problem lättar när vädret tillåter och att Kanada tar allt mer exportefterfrågan. EU har hittills, som vi sett ovan, skördat stora framgångar på exportmarknaden.
Vi tror att prisuppgången stannar av i veckan som kommer och fortsätter med neutral rekommendation.
Maltkorn
November 2014 – kontraktet på maltkorn steg 5 euro till 225 euro per ton – trots en starkare Euro.
Majs
Vi noterade förra veckan att decemberkontraktet på majs blidat en så kallad ”triangelformation”. I veckan bröt marknaden den och steg, vilket är en teknisk köpsignal. I fredags föll dock marknaden efter att USDA presenterat en negativ framtid för majs vid sin Outlook Conference. Vi tycker att en del är märkligt och den känns väldigt världsfrånvänd med en prognos på majspriset på 390 cent i genomsnitt under kommande marknadsföringsår. Spekulantkollektivet håller inte heller med, eftersom de köpt tillbaka nästan 200,000 terminskontrakt de senaste månaderna. De är fortfarande netto korta marknaden, men bara med 20,000 kontrakt. Givet att inte priset går ner under stödlinjen, utan öppnar ungefär oförändrat på måndag, tror jag det är ett köptillfälle.
USDA:s Outlook Conference gav följande prognos för majsmarknaden i USA. Hektarskörden stiger med 4.1% och ger en rekordskörd på 13.99 miljarder bushels. Det gör att utgående lager den 31 augusti 2015 blir 2.1 miljarder bushels, det största lagret sedan år 2005 och 43% högre än 1.48 miljarder som väntas bli utgående lager i år. Detta kommer enligt USDA att ge ett pris på 390 cent / bu i genomsnitt under 2014/15.
För att beräkna den här skörden har man använt sig av en yield / acre som ligger över den som ges av trenden för de senaste åren. Det är märkligt. Vi håller med om tendensen till lagerpåfyllnad och lägre pris. Det ges av demografiska faktorer och det faktum att produktionsökningen kommer ikapp efterfrågetakten, när den avtar av demografiska skäl. Men det är alltjämt torrt i USA och det är problem både i Ukraina och i Argentina.
Det finns mer som talar för en prisuppgång i majs. Etanolpriset (vit kurva) i diagrammet nedan, har stigit ganska kraftigt de senaste veckorna. Styrkan i etanolpriset är inte förvånande, mot bakgrund av det starkare råoljepriset. Etanol har de senaste fyra månaderna handlats till ett pris som ligger lägre än relationen till råolja de senaste fem åren. Trots uppgången i etanolpriset är prisrelationen (etanol/råolja) lägre än den var i fem år, fram till september förra året, när etanolpriset föll. En väl motiverad prisuppgång i etanol, talar alltså för ett högre pris på majs. Mot detta talar på lite längre sikt (12 månader), ett lägre råoljepris pga spridningen av fracking, samt Libyens och Irans återkomst som råoljeexportörer.
Sojabönor
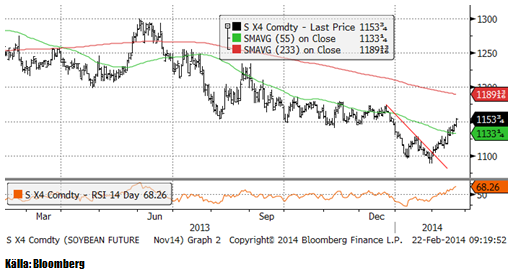
Sojabönorna handlades upp i veckan på såväl stark export från USA som hög ”crush” i USA. CONAB justerade också ner skörden i Brasilien. Trots detta har tiden i praktiken runnit ut för skador på den Brasilianska skörden. 12% är redan skördat och takten accelererar nu enligt känt mönster. Tekniskt har priset kommit upp till ”gamla bottennoteringar” från perioden augusti till december. Det gör att 1150 nu är ett starkt motstånd. Man kan vänta sig att priset får problem att gå högre och att vi istället kan få en förlängning på fredagens svaga stängning.
Sojamjölet håller sig kvar i intervallet 340 – 360 dollar per short ton. Nu är priset i den övre delen av intervallet, vilket säkerligen lockar fram säljare.

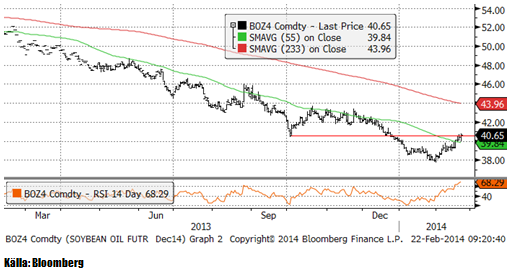
Sojaoljan testade återigen 40 dollar, men även den här gången var det säljarna som vann. Det är ett negativt tecken.
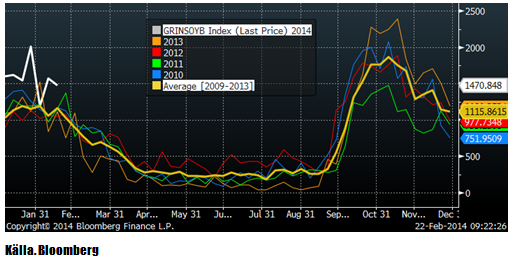
Exportstatistiken (inspections) var lite lägre än veckan innan, men fortfarande på en mycket högre nivå än något år tidigare. Inga nya avbeställningar från Kina har gjorts i veckan.
USDA:s Outlook Conference prognosticerade en produktion på 3.55 miljarder bushels och en fördubbling av utgående lager nästa år till 285 miljoner bushels, upp från estimerade 150 miljoner i år. USDA angav en prognos för priset på sojabönor under 2014/15, på 965 cent i genomsnitt. För innevarande år estimerar de 1270 cent. USDA räknar med att sådd areal ökar med 3.9% till 79.5 mA.
I takt med att skörden av sojabönor fortskrider i olika delar av Brasilien, kommer bilder på små och russinliknande bönor via nätet. Sojaskörden i södra Brasilien är skadad eftersom det varit torrt där i fyra veckor, samtidigt som baljorna fylls i februari i den södra delen av landet. I Mato Grosso innebär det torra vädret endast att skörden kan gå snabbare. Södra Brasilien får som vi sett på odlingsvädret, rejält med nederbörd nu, men det är för sent för stora delar av sojan där.
Privata firmor har justerat ner skörden till ca 89 mt. Det är troligt att ytterligare nedjusteringar kommer. För bara drygt en månad sedan talade jordbruksministern om 95 mt, så det har gått fort utför i förväntningarna. Om skörden stannar på 89 mt, blir det ändå, trots allt, en mycket större skörd än förra årets.
Vi fortsätter med säljrekommendation på sojabönor.
Raps
November 2014-kontraktet på raps fortsatte stiga kraftigt i veckan som gick, pga oron för möjligheterna att importera oljefrön från Ukraina. Med helgens lösning på den politiska toppnivån, torde den värsta oron kunna stillas. Därmed inte sagt att det är slut på volatiliteten som krisen i Ukraina skapat. För novemberkontraket är 370 euro en teknisk motståndsnivå och det kan vara en nivå som säljare tycker är lämplig att sälja på.
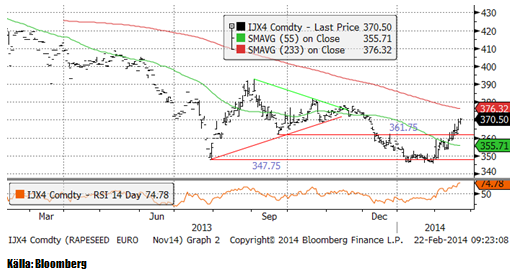
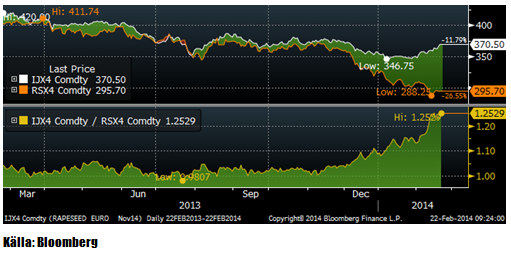
Canolan i Winnipeg steg i veckan som gick, men prisrelationen till Matifs rapsfrö är fortfarande på rekordnivå. Skillnaden är, alldeles bortsett att det inte omedelbart går att köpa importera canola till EU pga GMO-problematiken. Frankrike har sin vana trogen, fattat ett preliminärt förbud mot all GMO inom landet.. Det problematiska med relativ-värde-positioner av typen ”köp raps, sälj canola” är att det är svårt att ta en stop-loss, eftersom en försämring för positionen innebär att skillnaden ser ännu mer attraktiv ut. Det är svårt att tänka sig att den här prisskillnaden inte skulle rätta till sig fram till november.
Vi fortsätter med säljrekommendation på raps.
Potatis
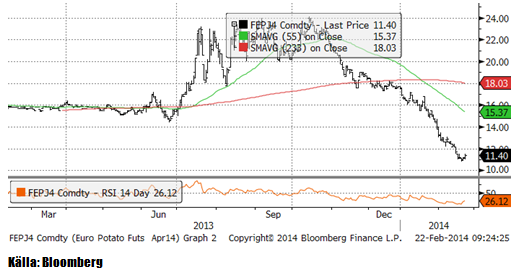
Potatis av gammal skörd har halverats sedan oktober och föll i fredags ner från 11.70 euro per 100 Kg förra veckan till 11.40 i fredags, efter att ha varit nere på 10.80 tidigare i veckan.
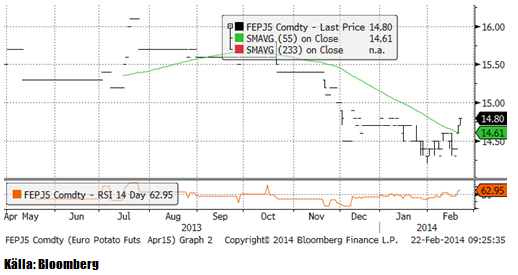
Kontraktet för den kommande skörden börjar nu handlas allt mer. Nedan ser vi kurdiagrammet för april 2015-kontraktet. Kontraktet fortsätter att handlas upp. För två veckor sedan låg det på 14.40, förra veckan på 14.50 och i fredags när börsen stängde, hade den nått 14.80 Euro per 100 Kg.
Gris
Lean hogs maj-kontrakt steg i veckan till 107 cent från förra veckans 104 cent. Efterfrågan i USA är stark, samtidigt som PED-virusets fortsatta spridning, som ännu inte nått kulmen, gör det svårt att möta efterfrågan. Priset får uppgiften att ransonera efterfrågan.
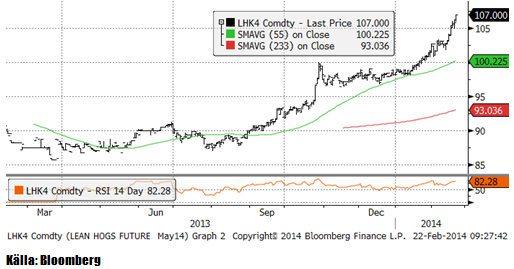
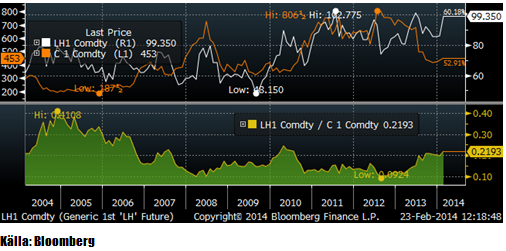
Relationen mellan grispris och majspris har dragit iväg. Just nu säger den att efterfrågan på majs kan väntas öka, då ett attraktivt pris på gris leder till högre produktion och därmed högre foderefterfrågan. Så skulle det vara under normala förhållanden, men inte när antalet grisar inte kan öka, på grund av PED-viruset. På lite längre sikt kommer dock sjukdomen att bemästras och efterfrågan öka.
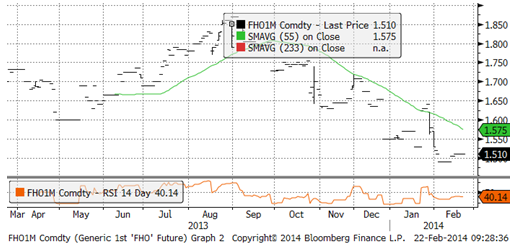
Spotkontraktet på EUREX Hogs har forsätter att handlas till bottennivåer på 1.51 Euro per kilo.
Mjölk
Både smör och skummjölkspulver handlades till oförändrade terminspriser, i några fall ett par procent lägre i eurotermer, jämfört med förra veckan. Eftersom euron steg mot svenska kronor med ett par procent, blev det en liten prisuppgång i svenska kronor räknat.
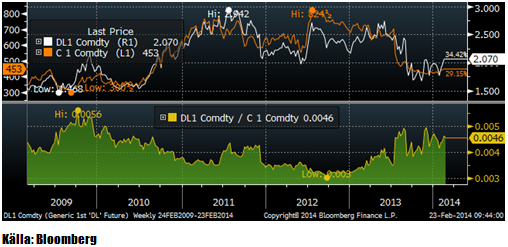
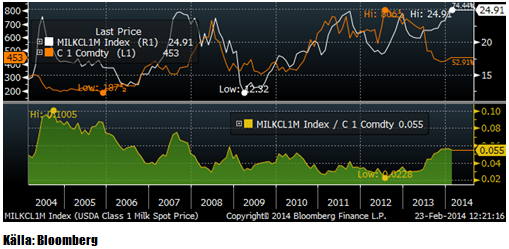
Om vi jämför priset på majs (typiskt foder i USA) med USDA:s spotprisnotering för First Class Milk, ser vi att relationen mellan foderpris och mjölkpris nästan fördubblades från mitten av förra året. Om man tittar noggrant ser man också att mjölkpriset ser ut att följa majspriset med några månaders eftersläpning. Om man ska tro på detta, kan det komma en rekyl nedåt på mjölkpriset.
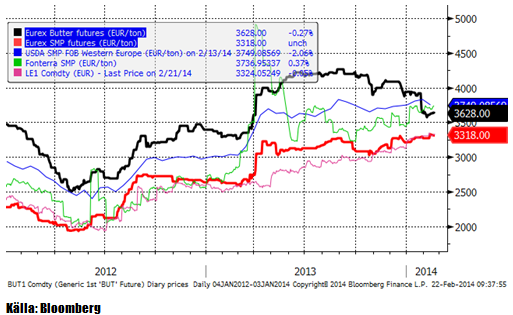
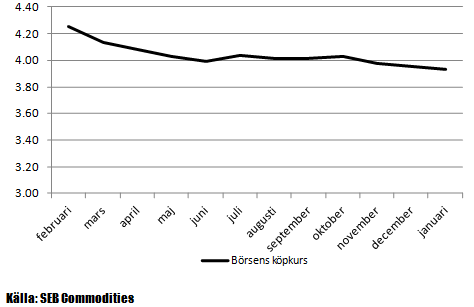
Nedan ser vi terminspriserna man får i svenska kronor från terminspriserna på SMP och smör på Eurex, omräknat till kronor per kilo mjölkråvara. Notera att hela den här prisnivån alltid ska ligga över avräkningspriset på mjölkråvara med ca 50 öre, som är en uppskattning av kostnaden för att förädla mjölkråvara till SMP och smör.
Som vi ser är genomsnittspriset som det är möjligt att säkra in över 4 kr både de närmaste sex månaderna och för det närmaste året.
Socker
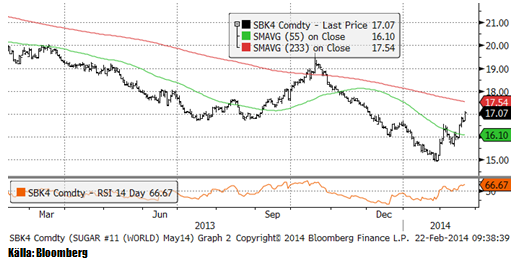
Maj-kontraktet på råsocker på ICE i New York tog, som vi förutspådde, ett nytt kliv uppåt i tisdags förra veckan. 17 cent är en teknisk motståndsnivå och det är möjligt att marknadens hausse tar en paus vid den här nivån.
Gödsel
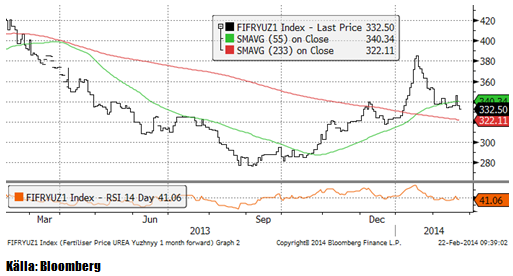
Urean fortsatte att rekylera tillbaka, men är alltjämt i stigande trend och bör få stöd på de här nivåerna.
[box]SEB Veckobrev Jordbruksprodukter är producerat av SEB Commodities Sales desk och publiceras i samarbete och med tillstånd på Råvarumarknaden.se[/box]
Detta marknadsföringsmaterial, framtaget av SEB’s Commodities Sales desk, har upprättats enbart i informationssyfte.
Även om innehållet är baserat på källor som SEB bedömt som tillförlitliga ansvarar SEB inte för fel eller brister i informationen. Den utgör inte oberoende, objektiv investeringsanalys och skyddas därför inte av de bestämmelser som SEB har infört för att förebygga potentiella intressekonflikter. Yttranden från SEB’s Commodities Sales desk kan vara oförenliga med tidigare publicerat material från SEB, då den senare hänvisas uppmanas du att läsa den fullständiga rapporten innan någon åtgärd vidtas.
Dokumentationen utgör inte någon investeringsrådgivning och tillhandahålls till dig utan hänsyn till dina investeringsmål. Du uppmanas att självständigt bedöma och komplettera uppgifterna i denna dokumentation och att basera dina investeringsbeslut på material som bedöms erforderligt. Alla framåtblickande uttalanden, åsikter och förväntningar är föremål för risker, osäkerheter och andra faktorer och kan orsaka att det faktiska resultatet avviker väsentligt från det förväntade. Historisk avkastning är ingen garanti för framtida resultat. Detta dokument utgör inte ett erbjudande att teckna några värdepapper eller andra finansiella instrument. SEB svarar inte för förlust eller skada – direkt eller indirekt, eller av vad slag det vara må – som kan uppkomma till följd av användandet av detta material eller dess innehåll.
Observera att det kan förekomma att SEB, dess ledamöter, dess anställda eller dess moder- och/eller dotterbolag vid olika tillfällen innehar, har innehaft eller kommer att inneha aktier, positioner, rådgivningsuppdrag i samband med corporate finance-transaktioner, investment- eller merchantbankinguppdrag och/eller lån i de bolag/finansiella instrument som nämns i materialet.
Materialet är avsett för mottagaren, all spridning, distribuering mångfaldigande eller annan användning av detta meddelande får inte ske utan SEB:s medgivande. Oaktat detta får SEB tillåta omfördelning av materialet till utvald tredje part i enlighet med gällande avtal. Materialet får inte spridas till fysiska eller juridiska personer som är medborgare eller har hemvist i ett land där sådan spridning är otillåten enligt tillämplig lag eller annan bestämmelse.
Skandinaviska Enskilda Banken AB (publ) är ett [publikt] aktiebolag och står under tillsyn av Finansinspektionen samt de lokala finansiella tillsynsmyndigheter i varje jurisdiktionen där SEB har filial eller dotterbolag.

Selling down on a ”deal”. Brent crude fell 6.2% last week with accelerated weakness towards the end of the week. Close of the week at $87.33/b and low of the week (and on Friday) of $85.8/b. Brent is falling another 4% this morning to $83.7/b on confirmation by Iran that a MoU text has been reached and that it will be signed on Friday this week.

So what is this ”deal” worth? Talk on the desk here this morning is that it is much like ”putting lipstick on a pig” where Trump has to sell this at home as a victory where ”the SoH has reopened”, the nuclear issue will be ironed out over the coming 60 days (or maybe 600 days?) and US consumers are getting a lower gasoline price and maybe US republicans survives the midterm elections.
The importance for Iran is that it emerges as the defacto winner of this war in the eyes of the non-US public world. That Iran now onwards is the ”ruler of the SoH” (combo of geography and new weapons systems like drones) or more softer: ”the guarantor of safe passage through the SoH”.
Iran doesn’t need nuclear weapons any more. Nuclear deterrence doesn’t work any more. Ukraine has made many attacks deep into Russia without being nuked in return. Plenty of Iranian ballistic rockets blasts over Israel but Iran wasn’t nuked in return.
There is no trust between the US and Iran. We don’t know all the details yet of the MoU. But what we do know is that there is no trust between the US and Iran what so ever. This is probably more like a descriptive text on how they can cooperate in a way where both sides keeps tactical leverage. Neither side makes irreversible concessions. Violations can be punished quickly. Cooperation produces immediate benefits.
This is a fragile structure. It can easily break down. There may be details which cannot be overcome. To be seen on Friday. The US has to show that it is willing put enough force behind managing and restraining Israel versus Hezbollah in Lebanon. We have seen that Netanyahu hasn’t listened all that much to Trump’s directives and wishes. This could be a major obstacle.
A gradual reopening is tactically preferable for Iran. A tactical leverage for Iran right now is that global oil stocks have been drawn down towards painful and increasingly dangerous levels with increasing risks for oil price spikes in mid-July to August. This together with US midterm elections on 3 November gives tactical leverage to Iran. Iran probably doesn’t want to fully give up on that leverage. A rapid, full reopening where global stocks are able to refill over the coming 60 days will significantly erode that leverage. If Iran reinstates a closure of the SoH after 60 days (if talks break down again), then the effect won’t be that impactful in terms of prices and the US midterm elections.
So a gradual and partial reopening where global markets gets the oil they need while they are unable to rebuild stocks could be a practical middle way for both parties. Trump can sell it as ”the SoH has reopened” and get affordable gasoline for US consumers. Iran can sell it as ”the SoH has fully reopened, but there is some friction” so flow is only 60-80% of normal.
Not much real demand destruction below $100/b. What we do know is that there is not much real price pain demand destruction for oil globally at an oil price below $100/b. A lot of demand-shock destruction. Fear. But demand should now come roaring back towards normal with fear for exceptionally high prices now is rapidly receding.
Sudden China demand destruction due to EVs? Bullocks. EV share of total Chinese carpool now around 13%. Share of new sales of EVs has reached 50%. This is a very gradual process. It doesn’t make oil demand fall like a rock over night. When EV new sales share reaches 100%, then the gasoline car pool will contract by some 5-10% per year. But that is only gasoline. Sudden reduction in Chinese oil demand is more about shock and risk.
Chinese crude oil imports will come roaring back. At what price? Today’s ”neutral” oil price is $70/b. That is the five year price which has steadily traded around the $70/b mark over the past 3-4 years. With still a risky picture one would think that China and the rest of the world will be big buyers of oil in the range of $70-85/b.
Global demand will likely snap back towards normal, forecasted demand and growth at such prices.
Physical reopening is a gradual process. The physical and practical reopening of the SoH will likely be gradual rather than sudden. And that probably suites Iran tactically as well.
Brent M1 price versus the Brent 5-yr (today’s ”normal” price)

Market is starting to take US/Iran headlines with a pinch of salt. Brent crude rose $2.8/b yesterday to an official close of $112.1/b. But after that it traded as low as $108.05/b before ending late night at around $109.7/b. Through the day it traded in a range of $106.87 – 112.72/b amid a flurry of news or rumors from Iran and the US. ”US temporary sanctions during negotiations” (falls alarm). ”We will bomb Iran” (not anyhow),… etc. While the market is still fluctuating to this kind of news flow, it is starting to take such headlines with a pinch of salt.
We’ll see. Maybe, maybe not. The Brent M1 contract is trading at $110.2/b this morning which very close to the average ticks through yesterday of $110.4/b.
Trump with bearish, verbal intervention whenever Brent trades above $110/b it seems. What seems to be a pattern is that Trump states something like ”very good negotiations going on with Iran”, ”New leaders in Iran are great,..”, ”Great progress in negotiations,…”, ”Deal in sight,..” etc whenever the Brent M1 contract trades above $110/b. An effort to cool the market. These hot air verbal interventions from Trump used to have a heavy bearish impact on prices, but they now seems to have less and less effect unless they are backed by reality.
As far as we can see there has been no real progress in the negotiations between the US and Iran with both sides still standing by their previous demands.
Iran is getting stronger while the cease fire lasts making a return to war for Trump yet harder. Iran is naturally in constant preparation for a return to war given Trump’s steady threats of bombing Iran again. Iran is naturally doing what ever is possible to prepare for a return to war. And every day the cease fire lasts it is better prepared. This naturally makes it more and more difficult and dangerous for the US to return to warring activity versus Iran as the consequences for energy infrastructure in the Persian Gulf will be more and more severe the longer the cease fire lasts. Israel seems to see it this way as well. That the war is not won and that current frozen state of a cease fire gives Iran opportunity to rebuild military and politically.
Global inventories are drawing down day by day. How much? In the meantime the Strait of Hormuz stays closed. There is varying measures and estimates of how much global inventories are drawing down. Our rough estimate, back of the envelope, is that global inventories are drawing down by at least some 10 mb/d or about 300 mb/d in a balance between loss of supply versus demand destruction. Other estimates we see are a monthly draw of 250-270 mb/d. The IEA only ’measured’ a draw in global observable stocks of 117 mb in April with oil on water rising 53 mb while on shore stocks fell 170 mb. But global stocks are hard to measure with large invisible, unmeasured stocks. As such a back of the envelope approach may be better.
Oil products is what the world is consuming. Oil product prices likely to rise while product stocks fall. Strategic Petroleum Reserves (SPR) are predominantly crude oil. Discharging oil from OECD SPR stocks, a sharp reduction in Chinese crude imports and a reduction in global refinery throughput of 6-7 mb/d has helped to keep crude oil markets satisfactorily supplied. But global inventories are drawing down none the less. And oil products is really what the world is consuming. So if global refinery throughput stays subdued, then demand will eventually have to match the supply of oil products. The likely path forward this summer is a steady draw down in jet fuel, diesel and gasoline. Higher prices for these. Then, if possible, higher refinery throughput and higher usage of crude in response to very profitable refinery margins. And lastly sharper draw in crude stocks and higher prices for these. But some 6 mb/d of oil products used to be exported through the Strait of Hormuz. And it may not be so easy to ramp up refinery activity across the world to compensate. Especially as Ukraine continues to damage Russian refineries as well as Russian crude production and export facilities.
Watch oil product stocks and prices as well as Brent calendar 2027. What to watch for this summer is thus oil product inventories falling and oil product premiums to crude rising. Another measure to watch is the Brent crude 2027 contract as it rises steadily day by day as the Strait of Hormuz stays closed and global oil inventories decline. The latter is close to the highest level since the start of the war and keeps rising.
The Brent M1 contract and the Brent 2027 prices and current price of jet fuel in Europe (ARA). All in USD/b

Our back of the envelope calculation of the global shortage created by the closure of the Strait of Hormuz. Note that 3.5 mb/d of discharge from SPR is also a draw. Note also that ’Forced demand loss’ of 2.5 mb/d is probably temporary and will fall back towards zero as logistics are sorted out leaving ’Price demand loss’ to do the job of balancing the market. Thus a shortfall of at least 9 mb/d created by the closure. More if SPR discharge is included and more if Forced demand loss recedes.

Brent is climbing higher. Front-month is at USD 106.3/bl this morning, close to a weekly high and a USD 9/bl jump from Mondays open. This is the move we flagged as a risk earlier in the week: the market shifting from ”a deal is around the corner” to ”this is going to take longer than we thought”.

Analyst Commodities, SEB
During April, rest-of-year Brent remained remarkably stable around USD 90/bl. A stability which rested on one single assumption: the SoH reopens around 1 May. That assumption is now slowly falling apart.
As we highlighted yesterday: every week of delay beyond 1 May adds (theoretically) ish USD 5/bl to the rest-of-year average, as global inventories draw 100 million barrels per week. i.e., a mid-May reopening implies rest-of-year Brent closer to USD 100/bl, and anything pushing into June or July takes us meaningfully higher.
What’s changed in the last 48 hours:
#1: The US military has formally warned that clearing suspected sea mines from SoH could take up to six months. That is a completely different timescale from what the financial market is pricing. Even a political deal tomorrow does not immediately reopen the strait.
#2: Trump has shifted his tone from urgency to ”strategic patience”. In yesterday’s press conference: ”Don’t rush me… I want a great deal.” The market is reading this as a president no longer feeling pressured by timelines, with the naval blockade running in the background.
#3: So far, the military activity is escalating, not de-escalating. Axios reports Iran is laying more mines in SoH. The US 3rd carrier strike group (USS George H.W. Bush) is arriving with two countermine vessels. Trump yesterday ordered the US Navy to destroy any Iranian boats caught laying mines. While CNN reports that the Pentagon is actively drawing up plans to strike Iranian SoH capabilities and individual Iranian military leaders if the ceasefire collapses. i.e., NOT a attitude consistent with an imminent deal!
Spot crude and product prices eased off the early-April highs on a combination of system rerouting and deal optimism. Both now weakening. Goldman estimates April Gulf output is reduced by 14.5 mbl/d, or 57% of pre-war supply, a number that keeps getting worse the longer this drags on.
Demand-side adaptation is ongoing: S. Korea has cut its Middle East crude dependence from 69% to 56% by pulling more from the Americas and Africa, and Japan is kicking off a second round of SPR releases from 1 May. But SPRs are finite.
Ref. to the negotiations, we should not bet on speed. The current Iranian leadership is dominated by genuine hardliners willing to absorb economic pain and run the clock to extract concessions. That is not a setup for a rapid resolution. US/Israeli media briefings keep framing the delay as ”internal Iranian divisions”, the reality is more complicated and points toward weeks and months, not days.
Our point is that the complexity is large, and higher prices have only just started (given a scenario where the negotiations drag out in time). The market spent April leaning on the USD 90/bl rest-of-year assumption; that case is diminishing by the hour. If ”early May reopening” is replaced by ”June, July or later” over the next week or two, both crude and products have meaningful room to reprice higher from here. There is a high risk being short energy and betting on any immediate political resolution(!).


Vattenfalls och Industrikrafts kärnkraftsbolag Videberg Kraft har valt Rolls-Royce SMR
Selling down on a ”deal”

Sommarväder skapar prisrally på elbörsen
Oil product price pain is set to rise as the Strait of Hormuz stays closed into summer

Solkraften pressar elpriserna dagtid
Oil product price pain is set to rise as the Strait of Hormuz stays closed into summer
Sommarväder skapar prisrally på elbörsen
Vattenfalls och Industrikrafts kärnkraftsbolag Videberg Kraft har valt Rolls-Royce SMR
Selling down on a ”deal”
-
Analys4 veckor sedan
Oil product price pain is set to rise as the Strait of Hormuz stays closed into summer
-
Nyheter2 veckor sedan
Sommarväder skapar prisrally på elbörsen
-
 Nyheter2 dagar sedan
Vattenfalls och Industrikrafts kärnkraftsbolag Videberg Kraft har valt Rolls-Royce SMR
-
Analys2 dagar sedan
Selling down on a ”deal”