Analys
SEB Jordbruksprodukter, 24 februari 2014

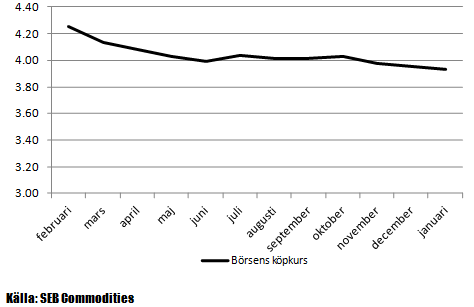
 En kund till SEB har prissäkrat mjölk i kronor per kilo för första gången, basis Eurex terminer på SMP och smör. Marknadsläget är bra för det. Dels är priset på börsen högt och dels är skillnaden till det svenska avräkningspriset stor.
EURSEK har stigit från 8.82 för en vecka sedan till 8.97 i fredags, eller med nästan 2%. Det innebär att priset på jordbruksprodukter i svenska kronor gått upp med motsvarande nästan 4 euro på vetepriset och 8 öre på mjölkpriset.
Det har varit stora prisuppgångar på jordbruksprodukter, men mest på sådant som inte produceras i Sverige. Kaffepriset steg 20% på torkan i Brasilien och amerikanska Lean Hogs, de korta kontrakten, steg med 15% pga stark ekonomi och efterfrågan och att spridningen av PED-viruset inte nått kulmen än. Gammal skörd av havre rusade också, men även det är på den amerikanska marknaden. Majspriset steg, drivet av etanolpriset, som drev av oljepriset och sojaoljan steg samtidigt som palmoljan i Malaysia nådde årshögsta. På den här sidan Atlanten var det också en positiv vecka med prisuppgångar på 2% på det mesta.
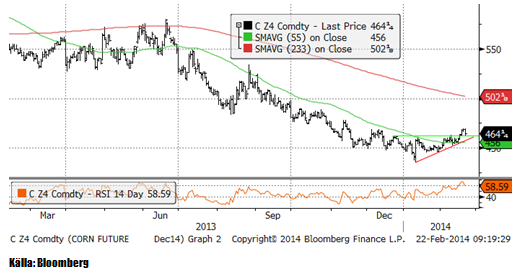
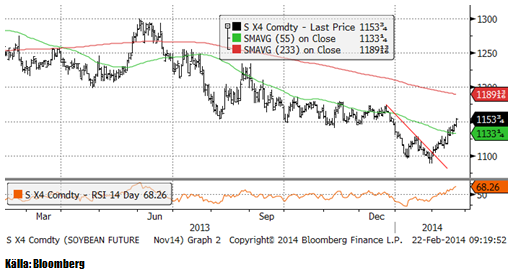
USDA:s Outlook Conference i torsdags och i fredags, som mest handlade om majs och sojabönor med vetet i skymundan, förutspår ett genomsnittpris på majs under marknadsföringsåret som börjar den första september 2014, på 390 cent per bushel (från 450 i år). För sojabönor förutspår USDA ett genomsnittligt pris på 965 cent (från 1270 i år). Priserna på december-majs ligger just nu på 464 cent och november-sojabönor på 1153.
Odlingsväder
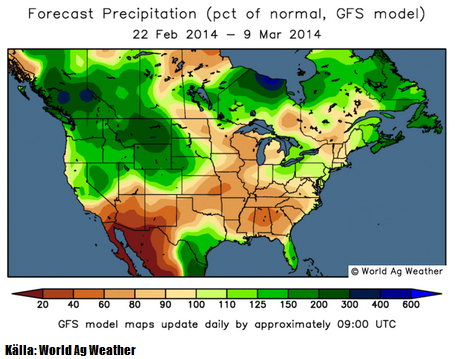
Iskylan och snöstormarna i norra USA har avlöst varandra och en ny storm väntas om några dagar. Det finns en oro för torka längre söderut. I kartbilden nedanför ser vi avvikelsen från det normala i tvåveckorsprognosen enligt GFS-modellen. Som synes väntas mindre nederbörd än normalt i de för jordbruk viktigaste delstaterna i USA.
Trots det latenta hotet om torka i USA förutspår USA en hektarskörd på majs som är högre än vad som kan väntas rent statistiskt, inklusive trenden till högre hektarskörd alltså.
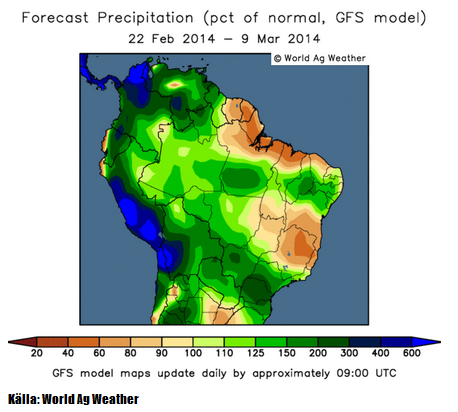
Västra Brasilien har fått – och väntas som vi ser av prognosbilden nedan, få mer nederbörd. Allt annat lika fördröjer det skörden av sojabönor i Mato Grosso, men är bra för sommargrödans start. Delstaten Minas Gerais, där kaffe odlas, väntas fortsätta få 40 – 90% av normal nederbörd. Södra delen av Brasilien väntas få upp till 3 gånger den normala nederbörden, med fokus på São Paulo och Paraná. Den främsta grödan i dessa delstater är nuförtiden sockerrör och i Paraná även sojabönor. Regnet kommer för sent för att påverka sojan där, som redan är torkskadad.
Ännu inte så uppmärksammat är den myckna nederbörd som fallit över stora delar av Indien. I den norra delen ligger Indiens centrum för sockerproduktionen. Rapporter därifrån säger att produktionen blir mindre, eftersom regnet försämrar kvaliteten på sockerrören i och med förseningarna.
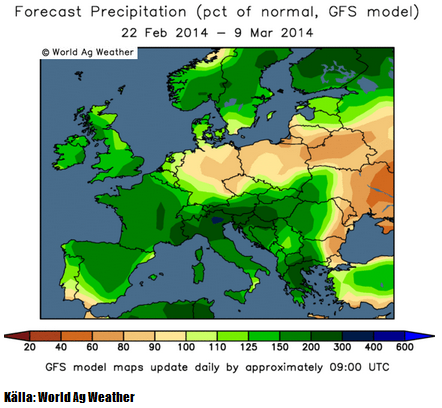
EU har överlag bra väder med nederbörd något över det normala och så väntas det fortsätta. Vi ser inte ens speciellt mycket regn över England och dess massivt översvämmade Somerset Levels. Det har nu visat sig att översvämningarna där inte beror på regnet i sig, utan på att förra Labour-regeringen och Naturvårdsverket i England, i samarbete med WWF medvetet ville skapa våtmark och därmed förbjöd den sedvanliga muddringen av floden, tog bort pumpar och började vattenfylla landet redan i höstas, trots att det inte funnits våtmark generellt där sedan 1200-talet. Översvämningskatastrofen är alltså ”man made” i miljövårdande syfte och inte representativ för resten av England eller resten av EU. Istället är höstvetet i mycket gott skick i t ex Frankrike, som fått lika mycket nederbörd. Det kan tilläggas att endast 30% av arealen i Somerset Levels odlas, resten är betesmark. Påverkan på spannmålsmarknaden är noll.
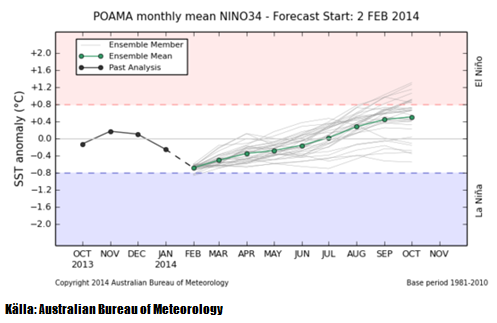
Ett hot skulle kunna vara om ett La Niña utvecklade sig till norra halvklotet sommar. Som vi ser i ensembleprognosen från Australiens meteorologiska byrå, kan man vänta sig neutral ENSO. Risken är snarare större för El Niño framåt södra halvklotets vår. El Niño gör att det blir torrt i Australien och vått Nord- och Sydamerika. Medan La Niña har en korrelation med högre pris på spannmål och oljeväxter, har El Niño ingen sådan korrelation alls. Men det mest sannolika är just nu enligt prognosen, att det blir neutrala förhållanden.
Vete
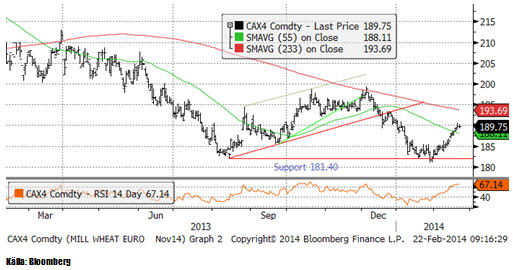
Matifs novemberkontrakt har nått upp till 190 euro, vilket tidigare har utgjort en teknisk stödnivå och nu alltså kan vara en motståndsnivå. RSI (nedre delen av diagrammet) är nästan på ”överköpt” nivå, vilket antyder att uppgången kan ha kört slut på kraft.
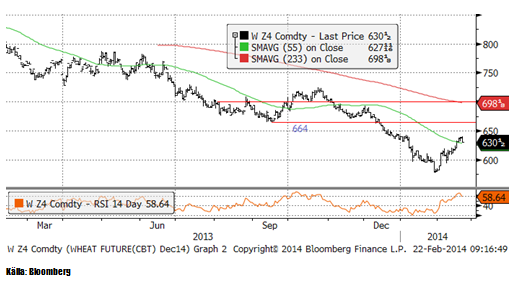
Nedanför ser vi Chicagovetet (Dec 14), som steg under nästan hela veckan, men avslutade med ett relativt stort prisfall.
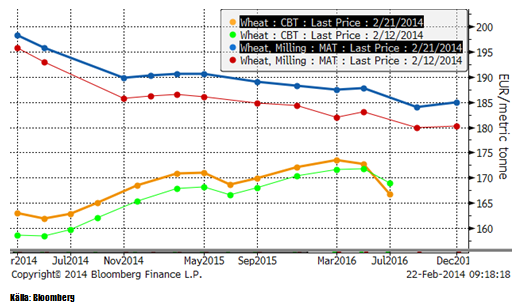
Nedan ser vi terminskurvorna för Chicagovete och Matif i fredags och veckan innan.
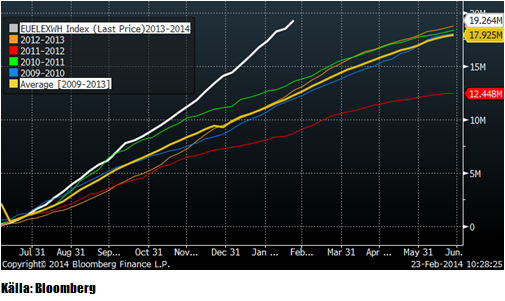
EU:s export har varit exceptionellt stark den här säsongen. Enligt EU:s statistik har 19.3 mt exporterats sedan säsongen började den 1 juli. Ett tidigare normalår skulle ligga på ungefär 12.5 mt så här års.
Oroligheterna i Ukraina verkar vara över, men det återstår att bilda en övergångsregering till dess val ska hållas i maj. Ordning, krediter, utsäde, drivmedel och gödsel ska fram för att vårbruket ska kunna starta i ett land som är bankrutt. Ryssland har stoppat köpen av Ukrainska statspapper (ett ryskt hjälpprogram) till dess oppositionen också lämnar in sina vapen, så allt är inte frid och fröjd i landet än. Höstvetet verkar dock må väldigt bra, precis som i EU, när det nu är på väg ur vintervilan.
Vid Outlook-konferensen angav USDA höstsådd areal till 57 mA, ner med 1.5 mA. Det var egentligen positiva nyheter, men vetepriset föll ändå ovanligt kraftigt på fredagen. USDA förutspådde att amerikanska lager stiger till 587 Mbu före skörden nästan år, jämfört med 558 Mbu som förutspås för den första juni i år. De väntar sig att produktionen stiger med 1.4% till 2.16 Bbu eftersom andelen skördad areal stiger. USA:s export väntas samtidigt falla med 11% till 1.05 Bbu från 1.175 Bbu i år. De förklarar detta med att Kanadas logistiska problem lättar när vädret tillåter och att Kanada tar allt mer exportefterfrågan. EU har hittills, som vi sett ovan, skördat stora framgångar på exportmarknaden.
Vi tror att prisuppgången stannar av i veckan som kommer och fortsätter med neutral rekommendation.
Maltkorn
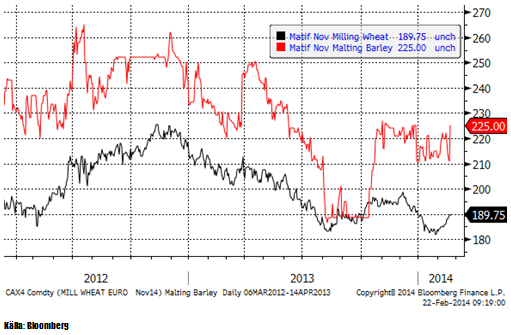
November 2014 – kontraktet på maltkorn steg 5 euro till 225 euro per ton – trots en starkare Euro.
Majs
Vi noterade förra veckan att decemberkontraktet på majs blidat en så kallad ”triangelformation”. I veckan bröt marknaden den och steg, vilket är en teknisk köpsignal. I fredags föll dock marknaden efter att USDA presenterat en negativ framtid för majs vid sin Outlook Conference. Vi tycker att en del är märkligt och den känns väldigt världsfrånvänd med en prognos på majspriset på 390 cent i genomsnitt under kommande marknadsföringsår. Spekulantkollektivet håller inte heller med, eftersom de köpt tillbaka nästan 200,000 terminskontrakt de senaste månaderna. De är fortfarande netto korta marknaden, men bara med 20,000 kontrakt. Givet att inte priset går ner under stödlinjen, utan öppnar ungefär oförändrat på måndag, tror jag det är ett köptillfälle.
USDA:s Outlook Conference gav följande prognos för majsmarknaden i USA. Hektarskörden stiger med 4.1% och ger en rekordskörd på 13.99 miljarder bushels. Det gör att utgående lager den 31 augusti 2015 blir 2.1 miljarder bushels, det största lagret sedan år 2005 och 43% högre än 1.48 miljarder som väntas bli utgående lager i år. Detta kommer enligt USDA att ge ett pris på 390 cent / bu i genomsnitt under 2014/15.
För att beräkna den här skörden har man använt sig av en yield / acre som ligger över den som ges av trenden för de senaste åren. Det är märkligt. Vi håller med om tendensen till lagerpåfyllnad och lägre pris. Det ges av demografiska faktorer och det faktum att produktionsökningen kommer ikapp efterfrågetakten, när den avtar av demografiska skäl. Men det är alltjämt torrt i USA och det är problem både i Ukraina och i Argentina.
Det finns mer som talar för en prisuppgång i majs. Etanolpriset (vit kurva) i diagrammet nedan, har stigit ganska kraftigt de senaste veckorna. Styrkan i etanolpriset är inte förvånande, mot bakgrund av det starkare råoljepriset. Etanol har de senaste fyra månaderna handlats till ett pris som ligger lägre än relationen till råolja de senaste fem åren. Trots uppgången i etanolpriset är prisrelationen (etanol/råolja) lägre än den var i fem år, fram till september förra året, när etanolpriset föll. En väl motiverad prisuppgång i etanol, talar alltså för ett högre pris på majs. Mot detta talar på lite längre sikt (12 månader), ett lägre råoljepris pga spridningen av fracking, samt Libyens och Irans återkomst som råoljeexportörer.
Sojabönor
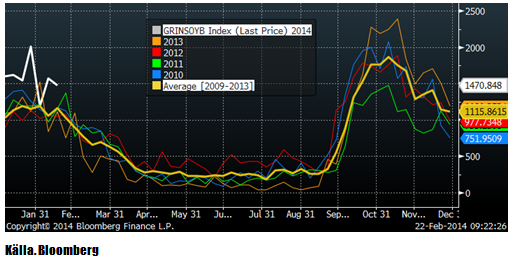
Sojabönorna handlades upp i veckan på såväl stark export från USA som hög ”crush” i USA. CONAB justerade också ner skörden i Brasilien. Trots detta har tiden i praktiken runnit ut för skador på den Brasilianska skörden. 12% är redan skördat och takten accelererar nu enligt känt mönster. Tekniskt har priset kommit upp till ”gamla bottennoteringar” från perioden augusti till december. Det gör att 1150 nu är ett starkt motstånd. Man kan vänta sig att priset får problem att gå högre och att vi istället kan få en förlängning på fredagens svaga stängning.
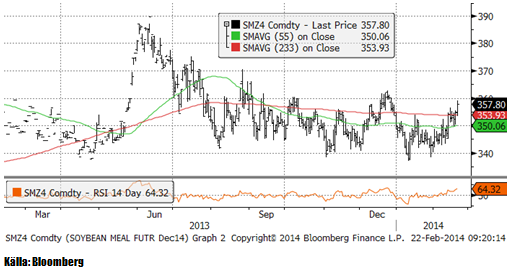
Sojamjölet håller sig kvar i intervallet 340 – 360 dollar per short ton. Nu är priset i den övre delen av intervallet, vilket säkerligen lockar fram säljare.
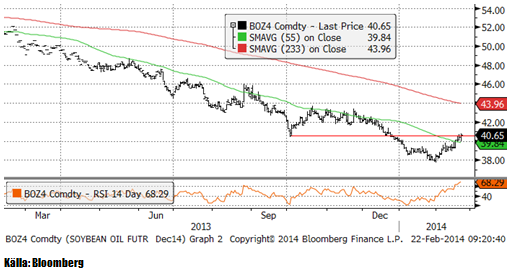
Sojaoljan testade återigen 40 dollar, men även den här gången var det säljarna som vann. Det är ett negativt tecken.
Exportstatistiken (inspections) var lite lägre än veckan innan, men fortfarande på en mycket högre nivå än något år tidigare. Inga nya avbeställningar från Kina har gjorts i veckan.
USDA:s Outlook Conference prognosticerade en produktion på 3.55 miljarder bushels och en fördubbling av utgående lager nästa år till 285 miljoner bushels, upp från estimerade 150 miljoner i år. USDA angav en prognos för priset på sojabönor under 2014/15, på 965 cent i genomsnitt. För innevarande år estimerar de 1270 cent. USDA räknar med att sådd areal ökar med 3.9% till 79.5 mA.
I takt med att skörden av sojabönor fortskrider i olika delar av Brasilien, kommer bilder på små och russinliknande bönor via nätet. Sojaskörden i södra Brasilien är skadad eftersom det varit torrt där i fyra veckor, samtidigt som baljorna fylls i februari i den södra delen av landet. I Mato Grosso innebär det torra vädret endast att skörden kan gå snabbare. Södra Brasilien får som vi sett på odlingsvädret, rejält med nederbörd nu, men det är för sent för stora delar av sojan där.
Privata firmor har justerat ner skörden till ca 89 mt. Det är troligt att ytterligare nedjusteringar kommer. För bara drygt en månad sedan talade jordbruksministern om 95 mt, så det har gått fort utför i förväntningarna. Om skörden stannar på 89 mt, blir det ändå, trots allt, en mycket större skörd än förra årets.
Vi fortsätter med säljrekommendation på sojabönor.
Raps
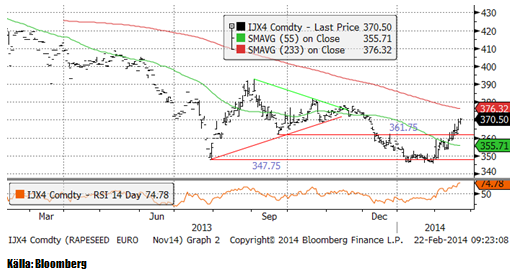
November 2014-kontraktet på raps fortsatte stiga kraftigt i veckan som gick, pga oron för möjligheterna att importera oljefrön från Ukraina. Med helgens lösning på den politiska toppnivån, torde den värsta oron kunna stillas. Därmed inte sagt att det är slut på volatiliteten som krisen i Ukraina skapat. För novemberkontraket är 370 euro en teknisk motståndsnivå och det kan vara en nivå som säljare tycker är lämplig att sälja på.
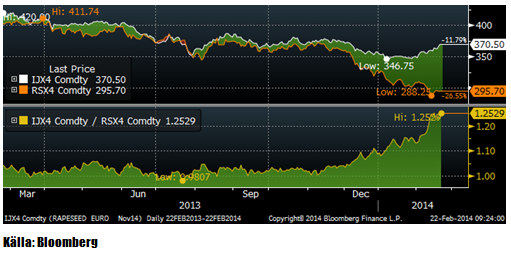
Canolan i Winnipeg steg i veckan som gick, men prisrelationen till Matifs rapsfrö är fortfarande på rekordnivå. Skillnaden är, alldeles bortsett att det inte omedelbart går att köpa importera canola till EU pga GMO-problematiken. Frankrike har sin vana trogen, fattat ett preliminärt förbud mot all GMO inom landet.. Det problematiska med relativ-värde-positioner av typen ”köp raps, sälj canola” är att det är svårt att ta en stop-loss, eftersom en försämring för positionen innebär att skillnaden ser ännu mer attraktiv ut. Det är svårt att tänka sig att den här prisskillnaden inte skulle rätta till sig fram till november.
Vi fortsätter med säljrekommendation på raps.
Potatis
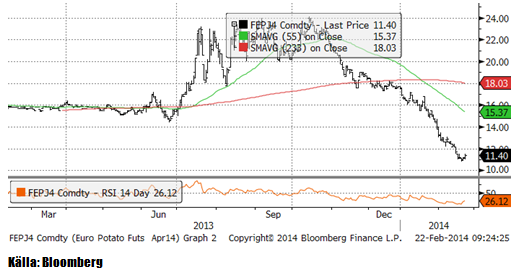
Potatis av gammal skörd har halverats sedan oktober och föll i fredags ner från 11.70 euro per 100 Kg förra veckan till 11.40 i fredags, efter att ha varit nere på 10.80 tidigare i veckan.
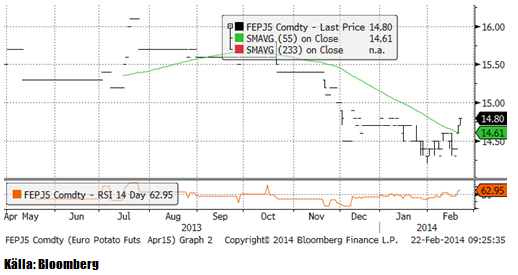
Kontraktet för den kommande skörden börjar nu handlas allt mer. Nedan ser vi kurdiagrammet för april 2015-kontraktet. Kontraktet fortsätter att handlas upp. För två veckor sedan låg det på 14.40, förra veckan på 14.50 och i fredags när börsen stängde, hade den nått 14.80 Euro per 100 Kg.
Gris
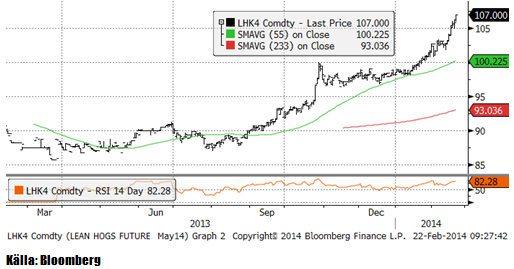
Lean hogs maj-kontrakt steg i veckan till 107 cent från förra veckans 104 cent. Efterfrågan i USA är stark, samtidigt som PED-virusets fortsatta spridning, som ännu inte nått kulmen, gör det svårt att möta efterfrågan. Priset får uppgiften att ransonera efterfrågan.
Relationen mellan grispris och majspris har dragit iväg. Just nu säger den att efterfrågan på majs kan väntas öka, då ett attraktivt pris på gris leder till högre produktion och därmed högre foderefterfrågan. Så skulle det vara under normala förhållanden, men inte när antalet grisar inte kan öka, på grund av PED-viruset. På lite längre sikt kommer dock sjukdomen att bemästras och efterfrågan öka.
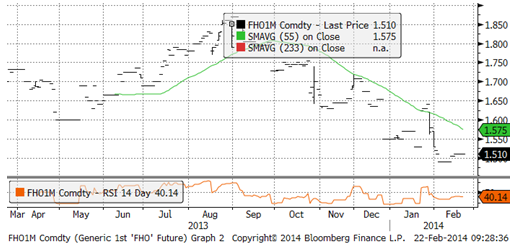
Spotkontraktet på EUREX Hogs har forsätter att handlas till bottennivåer på 1.51 Euro per kilo.
Mjölk
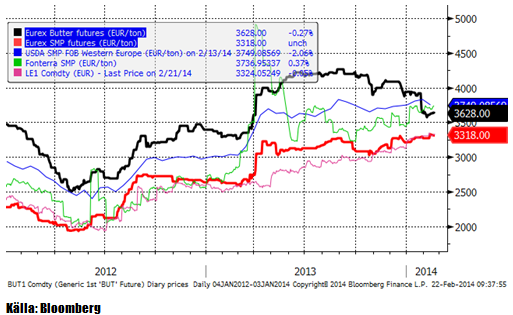
Både smör och skummjölkspulver handlades till oförändrade terminspriser, i några fall ett par procent lägre i eurotermer, jämfört med förra veckan. Eftersom euron steg mot svenska kronor med ett par procent, blev det en liten prisuppgång i svenska kronor räknat.
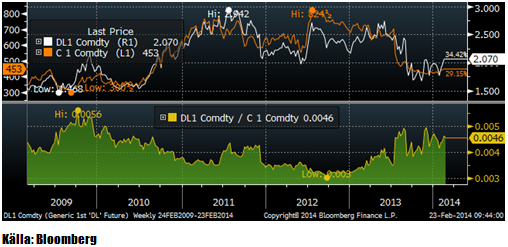
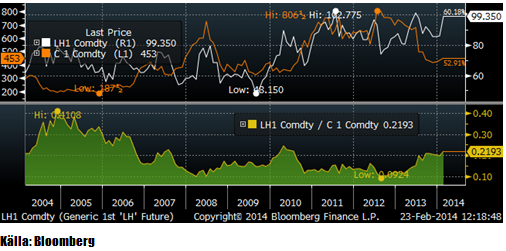
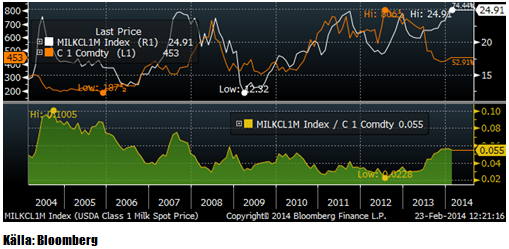
Om vi jämför priset på majs (typiskt foder i USA) med USDA:s spotprisnotering för First Class Milk, ser vi att relationen mellan foderpris och mjölkpris nästan fördubblades från mitten av förra året. Om man tittar noggrant ser man också att mjölkpriset ser ut att följa majspriset med några månaders eftersläpning. Om man ska tro på detta, kan det komma en rekyl nedåt på mjölkpriset.
Nedan ser vi terminspriserna man får i svenska kronor från terminspriserna på SMP och smör på Eurex, omräknat till kronor per kilo mjölkråvara. Notera att hela den här prisnivån alltid ska ligga över avräkningspriset på mjölkråvara med ca 50 öre, som är en uppskattning av kostnaden för att förädla mjölkråvara till SMP och smör.
Som vi ser är genomsnittspriset som det är möjligt att säkra in över 4 kr både de närmaste sex månaderna och för det närmaste året.
Socker
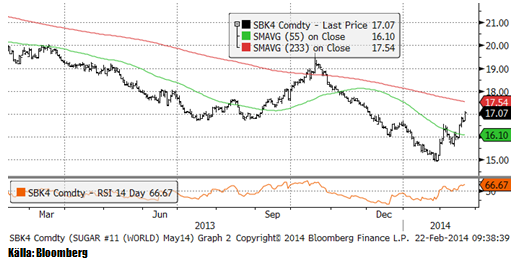
Maj-kontraktet på råsocker på ICE i New York tog, som vi förutspådde, ett nytt kliv uppåt i tisdags förra veckan. 17 cent är en teknisk motståndsnivå och det är möjligt att marknadens hausse tar en paus vid den här nivån.
Gödsel
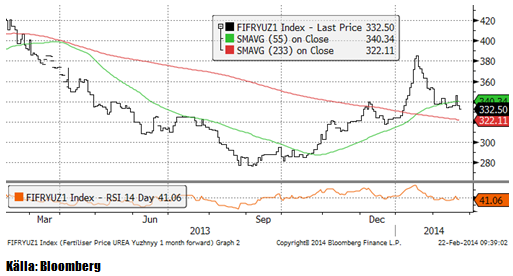
Urean fortsatte att rekylera tillbaka, men är alltjämt i stigande trend och bör få stöd på de här nivåerna.
[box]SEB Veckobrev Jordbruksprodukter är producerat av SEB Commodities Sales desk och publiceras i samarbete och med tillstånd på Råvarumarknaden.se[/box]
Detta marknadsföringsmaterial, framtaget av SEB’s Commodities Sales desk, har upprättats enbart i informationssyfte.
Även om innehållet är baserat på källor som SEB bedömt som tillförlitliga ansvarar SEB inte för fel eller brister i informationen. Den utgör inte oberoende, objektiv investeringsanalys och skyddas därför inte av de bestämmelser som SEB har infört för att förebygga potentiella intressekonflikter. Yttranden från SEB’s Commodities Sales desk kan vara oförenliga med tidigare publicerat material från SEB, då den senare hänvisas uppmanas du att läsa den fullständiga rapporten innan någon åtgärd vidtas.
Dokumentationen utgör inte någon investeringsrådgivning och tillhandahålls till dig utan hänsyn till dina investeringsmål. Du uppmanas att självständigt bedöma och komplettera uppgifterna i denna dokumentation och att basera dina investeringsbeslut på material som bedöms erforderligt. Alla framåtblickande uttalanden, åsikter och förväntningar är föremål för risker, osäkerheter och andra faktorer och kan orsaka att det faktiska resultatet avviker väsentligt från det förväntade. Historisk avkastning är ingen garanti för framtida resultat. Detta dokument utgör inte ett erbjudande att teckna några värdepapper eller andra finansiella instrument. SEB svarar inte för förlust eller skada – direkt eller indirekt, eller av vad slag det vara må – som kan uppkomma till följd av användandet av detta material eller dess innehåll.
Observera att det kan förekomma att SEB, dess ledamöter, dess anställda eller dess moder- och/eller dotterbolag vid olika tillfällen innehar, har innehaft eller kommer att inneha aktier, positioner, rådgivningsuppdrag i samband med corporate finance-transaktioner, investment- eller merchantbankinguppdrag och/eller lån i de bolag/finansiella instrument som nämns i materialet.
Materialet är avsett för mottagaren, all spridning, distribuering mångfaldigande eller annan användning av detta meddelande får inte ske utan SEB:s medgivande. Oaktat detta får SEB tillåta omfördelning av materialet till utvald tredje part i enlighet med gällande avtal. Materialet får inte spridas till fysiska eller juridiska personer som är medborgare eller har hemvist i ett land där sådan spridning är otillåten enligt tillämplig lag eller annan bestämmelse.
Skandinaviska Enskilda Banken AB (publ) är ett [publikt] aktiebolag och står under tillsyn av Finansinspektionen samt de lokala finansiella tillsynsmyndigheter i varje jurisdiktionen där SEB har filial eller dotterbolag.
Analys
Tightening fundamentals – bullish inventories from DOE

The latest weekly report from the US DOE showed a substantial drawdown across key petroleum categories, adding more upside potential to the fundamental picture.

Commercial crude inventories (excl. SPR) fell by 5.8 million barrels, bringing total inventories down to 415.1 million barrels. Now sitting 11% below the five-year seasonal norm and placed in the lowest 2015-2022 range (see picture below).
Product inventories also tightened further last week. Gasoline inventories declined by 2.1 million barrels, with reductions seen in both finished gasoline and blending components. Current gasoline levels are about 3% below the five-year average for this time of year.
Among products, the most notable move came in diesel, where inventories dropped by almost 4.1 million barrels, deepening the deficit to around 20% below seasonal norms – continuing to underscore the persistent supply tightness in diesel markets.
The only area of inventory growth was in propane/propylene, which posted a significant 5.1-million-barrel build and now stands 9% above the five-year average.
Total commercial petroleum inventories (crude plus refined products) declined by 4.2 million barrels on the week, reinforcing the overall tightening of US crude and products.


Analys
Bombs to ”ceasefire” in hours – Brent below $70

A classic case of “buy the rumor, sell the news” played out in oil markets, as Brent crude has dropped sharply – down nearly USD 10 per barrel since yesterday evening – following Iran’s retaliatory strike on a U.S. air base in Qatar. The immediate reaction was: “That was it?” The strike followed a carefully calibrated, non-escalatory playbook, avoiding direct threats to energy infrastructure or disruption of shipping through the Strait of Hormuz – thus calming worst-case fears.

After Monday morning’s sharp spike to USD 81.4 per barrel, triggered by the U.S. bombing of Iranian nuclear facilities, oil prices drifted sideways in anticipation of a potential Iranian response. That response came with advance warning and caused limited physical damage. Early this morning, both the U.S. President and Iranian state media announced a ceasefire, effectively placing a lid on the immediate conflict risk – at least for now.
As a result, Brent crude has now fallen by a total of USD 12 from Monday’s peak, currently trading around USD 69 per barrel.
Looking beyond geopolitics, the market will now shift its focus to the upcoming OPEC+ meeting in early July. Saudi Arabia’s decision to increase output earlier this year – despite falling prices – has drawn renewed attention considering recent developments. Some suggest this was a response to U.S. pressure to offset potential Iranian supply losses.
However, consensus is that the move was driven more by internal OPEC+ dynamics. After years of curbing production to support prices, Riyadh had grown frustrated with quota-busting by several members (notably Kazakhstan). With Saudi Arabia cutting up to 2 million barrels per day – roughly 2% of global supply – returns were diminishing, and the risk of losing market share was rising. The production increase is widely seen as an effort to reassert leadership and restore discipline within the group.
That said, the FT recently stated that, the Saudis remain wary of past missteps. In 2018, Riyadh ramped up output at Trump’s request ahead of Iran sanctions, only to see prices collapse when the U.S. granted broad waivers – triggering oversupply. Officials have reportedly made it clear they don’t intend to repeat that mistake.
The recent visit by President Trump to Saudi Arabia, which included agreements on AI, defense, and nuclear cooperation, suggests a broader strategic alignment. This has fueled speculation about a quiet “pump-for-politics” deal behind recent production moves.
Looking ahead, oil prices have now retraced the entire rally sparked by the June 13 Israel–Iran escalation. This retreat provides more political and policy space for both the U.S. and Saudi Arabia. Specifically, it makes it easier for Riyadh to scale back its three recent production hikes of 411,000 barrels each, potentially returning to more moderate increases of 137,000 barrels for August and September.
In short: with no major loss of Iranian supply to the market, OPEC+ – led by Saudi Arabia – no longer needs to compensate for a disruption that hasn’t materialized, especially not to please the U.S. at the cost of its own market strategy. As the Saudis themselves have signaled, they are unlikely to repeat previous mistakes.
Conclusion: With Brent now in the high USD 60s, buying oil looks fundamentally justified. The geopolitical premium has deflated, but tensions between Israel and Iran remain unresolved – and the risk of missteps and renewed escalation still lingers. In fact, even this morning, reports have emerged of renewed missile fire despite the declared “truce.” The path forward may be calmer – but it is far from stable.
Analys
A muted price reaction. Market looks relaxed, but it is still on edge waiting for what Iran will do

Brent crossed the 80-line this morning but quickly fell back assigning limited probability for Iran choosing to close the Strait of Hormuz. Brent traded in a range of USD 70.56 – 79.04/b last week as the market fluctuated between ”Iran wants a deal” and ”US is about to attack Iran”. At the end of the week though, Donald Trump managed to convince markets (and probably also Iran) that he would make a decision within two weeks. I.e. no imminent attack. Previously when when he has talked about ”making a decision within two weeks” he has often ended up doing nothing in the end. The oil market relaxed as a result and the week ended at USD 77.01/b which is just USD 6/b above the year to date average of USD 71/b.

Brent jumped to USD 81.4/b this morning, the highest since mid-January, but then quickly fell back to a current price of USD 78.2/b which is only up 1.5% versus the close on Friday. As such the market is pricing a fairly low probability that Iran will actually close the Strait of Hormuz. Probably because it will hurt Iranian oil exports as well as the global oil market.
It was however all smoke and mirrors. Deception. The US attacked Iran on Saturday. The attack involved 125 warplanes, submarines and surface warships and 14 bunker buster bombs were dropped on Iranian nuclear sites including Fordow, Natanz and Isfahan. In response the Iranian Parliament voted in support of closing the Strait of Hormuz where some 17 mb of crude and products is transported to the global market every day plus significant volumes of LNG. This is however merely an advise to the Supreme leader Ayatollah Ali Khamenei and the Supreme National Security Council which sits with the final and actual decision.
No supply of oil is lost yet. It is about the risk of Iran closing the Strait of Hormuz or not. So far not a single drop of oil supply has been lost to the global market. The price at the moment is all about the assessed risk of loss of supply. Will Iran choose to choke of the Strait of Hormuz or not? That is the big question. It would be painful for US consumers, for Donald Trump’s voter base, for the global economy but also for Iran and its population which relies on oil exports and income from selling oil out of that Strait as well. As such it is not a no-brainer choice for Iran to close the Strait for oil exports. And looking at the il price this morning it is clear that the oil market doesn’t assign a very high probability of it happening. It is however probably well within the capability of Iran to close the Strait off with rockets, mines, air-drones and possibly sea-drones. Just look at how Ukraine has been able to control and damage the Russian Black Sea fleet.
What to do about the highly enriched uranium which has gone missing? While the US and Israel can celebrate their destruction of Iranian nuclear facilities they are also scratching their heads over what to do with the lost Iranian nuclear material. Iran had 408 kg of highly enriched uranium (IAEA). Almost weapons grade. Enough for some 10 nuclear warheads. It seems to have been transported out of Fordow before the attack this weekend.
The market is still on edge. USD 80-something/b seems sensible while we wait. The oil market reaction to this weekend’s events is very muted so far. The market is still on edge awaiting what Iran will do. Because Iran will do something. But what and when? An oil price of 80-something seems like a sensible level until something do happen.
-

 Nyheter3 veckor sedan
Mahvie Minerals växlar spår – satsar fullt ut på guld
-

 Nyheter4 veckor sedan
Uppgången i oljepriset planade ut under helgen
-

 Nyheter4 veckor sedan
Låga elpriser i sommar – men mellersta Sverige får en ökning
-

 Analys3 veckor sedan
A muted price reaction. Market looks relaxed, but it is still on edge waiting for what Iran will do
-

 Nyheter3 veckor sedan
Jonas Lindvall är tillbaka med ett nytt oljebolag, Perthro, som ska börsnoteras
-

 Nyheter3 veckor sedan
Oljan, guldet och marknadens oroande tystnad
-

 Analys4 veckor sedan
Very relaxed at USD 75/b. Risk barometer will likely fluctuate to higher levels with Brent into the 80ies or higher coming 2-3 weeks
-

 Nyheter3 veckor sedan
Domstolen ger klartecken till Lappland Guldprospektering


