

Analys
SEB Jordbruksprodukter, 20 maj 2013


 Statistiken hamrar på marknaderna. Ur vinterns torka blandas massiva rapporter som WASDE-rapporten för en vecka sedan med sin prognostiserade rekordskörd av spannmål – så stor att många först inte kunde tro den, med rapporter om den sena såddens allt snabbare takt. Global ekonomi står samtidigt och stampar. Trots att centralbanker håller räntan på rekordlåg nivå och förser ekonomin med pengar, vill inte tillväxten ta fart. Pengarna hamnar istället på aktiebörsen. Anledningen är att Kina faktiskt kommit ganska långt upp på utvecklingsstegen. En inkomstökning leder inte som förr till en stor ökning av köttkonsumtionen. Att Kina börjar växa in som ett väsentligt mycket mer konkurrenskraftigt alternativ till Europas och Japans äldre delar av industrin innebär också att problemet inte är pengar, utan konkurrens från tillväxtländer.
Pristrenden på spannmål är definitivt nedåtriktad. Sojabönor (Chicago) handlades upp, till stor del beroende på den tighta situationen för amerikanska sojabönor. Sydamerika har gott om dem.
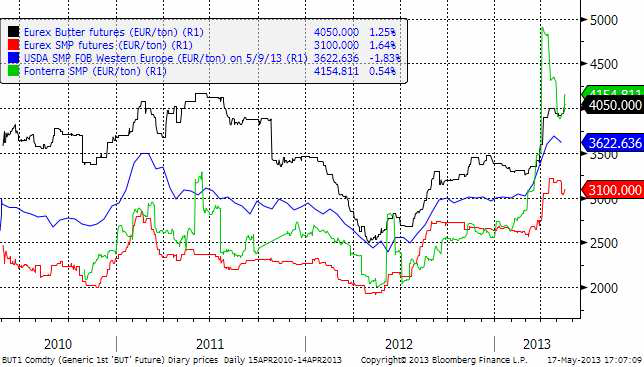
Mjölkmarknaden fortsätter falla, Fonterra lite mindre, men den kom från hög höjd. Eurex terminer på smör och mjölkpulver ligger fortfarande på hög nivå.
Odlingsväder
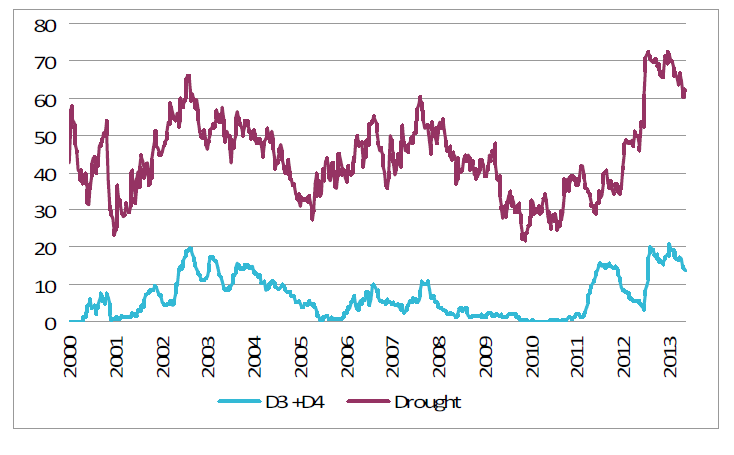
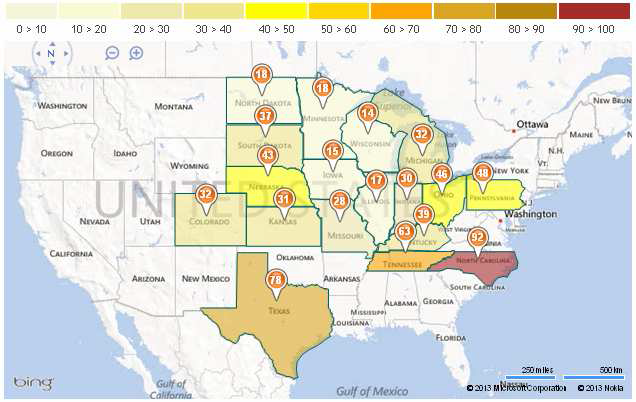
Torkan i USA har fortsatt att avta, i allt raskare takt. Det är nu 61.7% av USA som är torrare än normalt. Som mest på Juldagen var det 72% som var drabbat av torka. De två allra mest extrema graderna av torka lider 13.64% av landet av. Andelen minskade med 0.5% sedan förra veckan.
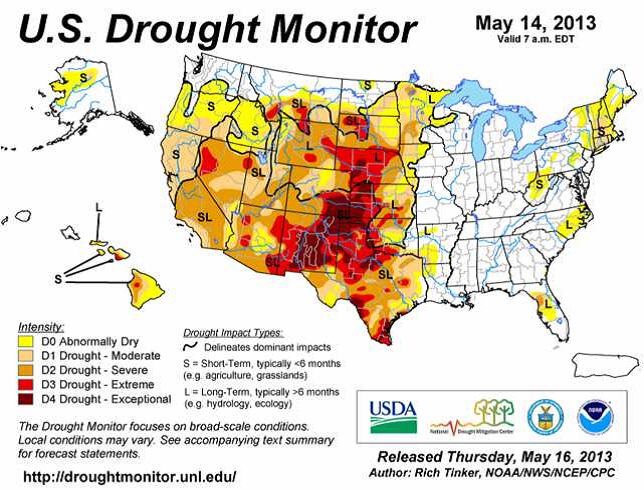
Som vi ser i kartbilden nedan är det västra delen av prärien och längs Klippiga bergen som det råder torka. Mellanvästern är praktiskt taget fri från torka. Östra delarna av Kansas och andra delstater hör dock till de som är hårdast drabbade av de svåraste typerna av torka.
Vete
Vetepriset började falla i torsdags och kursfallet accelererade under fredagens sista timmar. Bakom ligger sannolikt de spekulationer om att sådden av majs ska ha tagit ett rekordkliv framåt i måndagkvällens statistik. Siffror på att 70% (28% förra veckan) skulle vara sått. Det tror inte jag, men att sådden kommer att ha tagit ett stort kliv framåt ska man vänta sig. Innebörden av WASDE-rapporten kanske också börjar sjunka in. De flesta jag talat med om WASDE-rapporten har inte reagerat, helt enkelt för att den stora skörden av spannmål som prognosticeras är så enorm. En reaktion på ett seminarium i Malmö var ”Men hur ska det då gå med lönsamheten!?”. Jag tror dock att ju förr man fattar att priset kommer att gå ner rejält, desto bättre är det. För då kan man raskt göra något åt det.
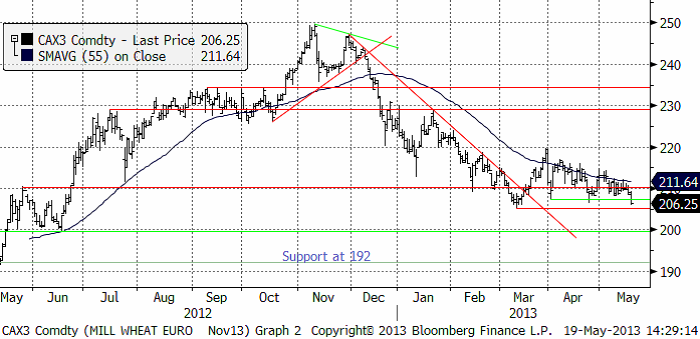
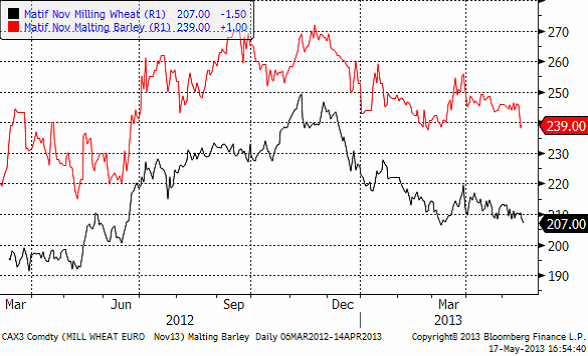
Priset på novemberterminen på Matif stängde på 206.25 euro per ton. Det är lägre än föregående botten. Nästa tekniska stöd ligger på 205.25 och under det förstås 200. Trenden är nedåtriktad och dessa stöd ska testas.
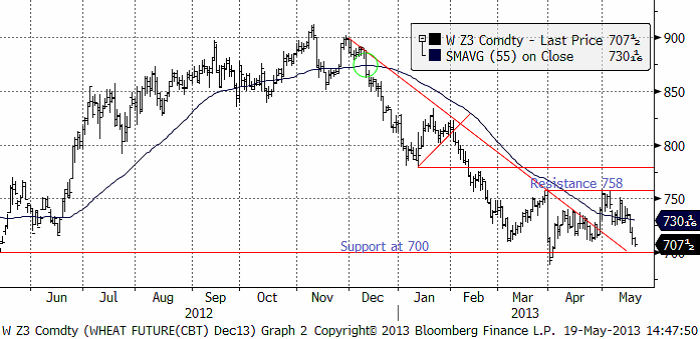
Decemberkontraktet på CBOT fortsatte falla och är nu nära stödet på 700 cent, som jag tror det är hög sannolikhet att marknaden till slut faller genom.
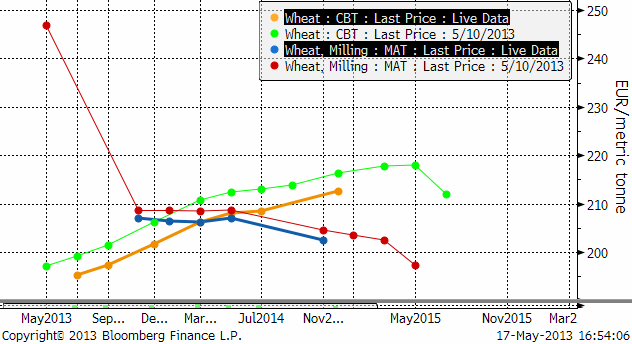
Nedan ser vi förändringen i terminskurvorna fredag till fredag. Maj-kontraktet på Matif är nu borta ur leken.
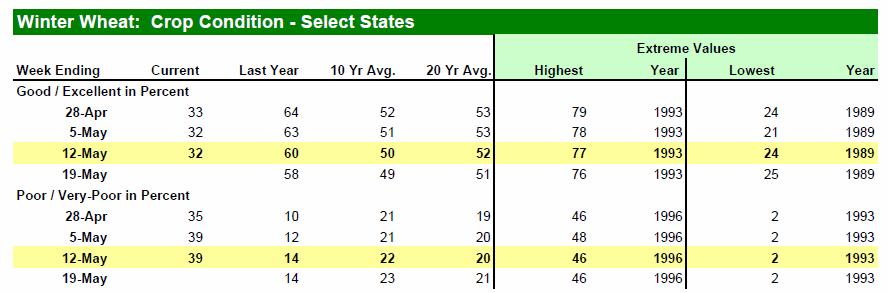
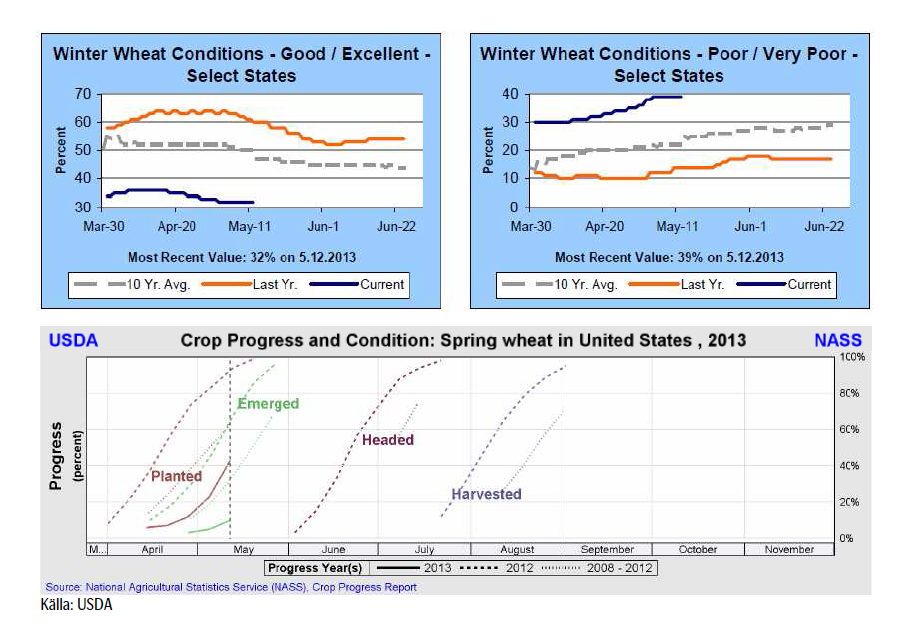
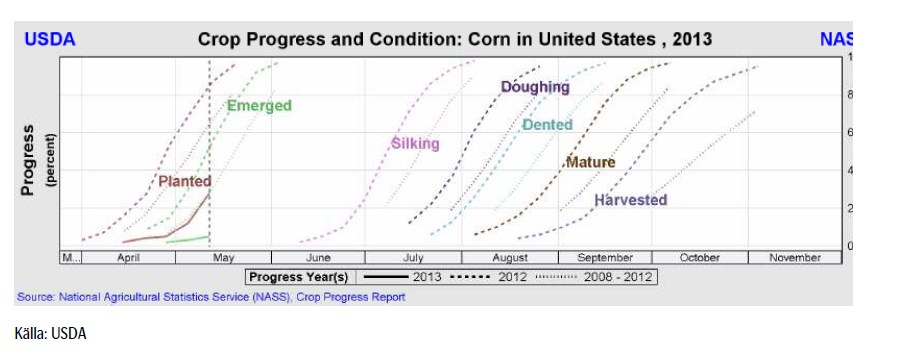
Måndagens Crop Progress rapport från USDA visar att tillståndet för det amerikanska höstvetet i stort sett var oförändrat i de 18 stater som rapporterar. Vete i merparten av de HRW producerande staterna klassas fortfarande som ”poor/very poor”, medan vete i de SRW producerande staterna mestadels klassas som ”good/excellent”. För de 18 staterna sammantaget så klassas 32% som ”good/excellent”, oförändrat från förra veckan men väl under förra årets 60% vid samma tid. Höstvete klassat som ”poor/very poor” uppgår till 39%, också oförändrat från förra veckan men väl över förra årets 14% vid samma tid.
Totalt har endast 29% av höstvetet gått i ax, vilket är långt efter förra årets 73% vid samma tid och det femåriga genomsnittet på 51% vid denna tidpunkt.
Sådden av vårvete i de 6 största staterna gjorde framsteg i veckan som gick och avancerade till 43%, upp rejält från 23% en vecka innan men fortfarande väl efter förra årets 92% och det femåriga genomsnittet på 63%.
Slutsatsen är att vi behåller vår säljrekommendation på vete.
Maltkorn
Maltkorn föll relativt kraftigt i veckan vilket gjorde att prisskillnaden mellan maltkorn och kvarnvete fick en ”återställare”. Relationen mellan maltkorn och vete har historiskt varit väldigt stabil.
Majs
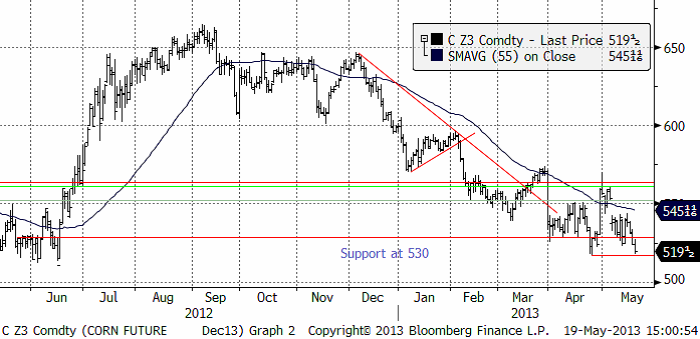
Majspriset (december 2013) är nu nere och testar årets bottennotering från april. Det ser ut att kunna bli ett brott nedåt. Det beror sannolikt på ”planting progress”-rapporten på måndag kväll klockan 22:00, eller på spekulationer om att sådden har varit rekordsnabb i det gynnsamma vädret.
Sådden ligger efter i USA, men hade i måndags tagit sig upp till 28% färdigt.
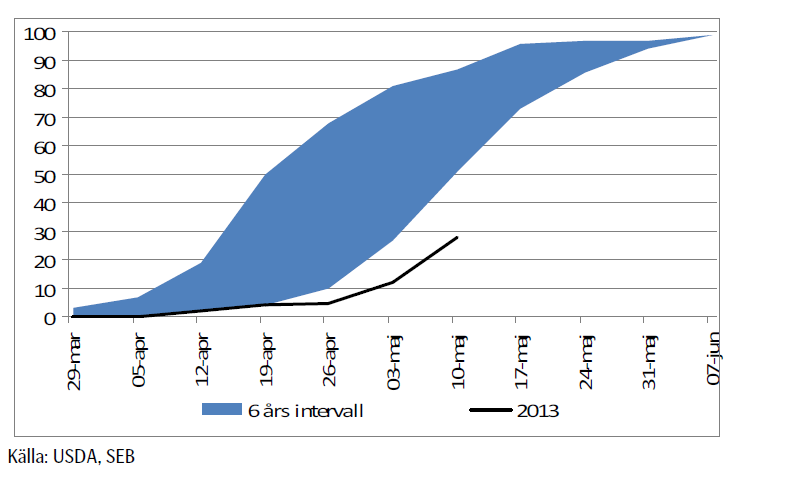
Spekulationerna går just nu varma om vad måndagens siffra kommer att bli. Den mest optimistiska siffran är att 70% ska vara sått. Det skulle vara en ökning med 42 procentenheter. Den största veckovisa ökningstakten som lantbrukarna har mäktat med är 30% sedan 2007 är 30%. Det skedde mellan 26 mars och 3 maj. Om lantbrukarna lyckas så 30% igen, hamnar vi på 58% sått. Det gör att sådden hamnar strax under den lägre delen av intervallet för 2007 – 2012, där sådden år 2008 utgör botten. Att det är just 2008 får oss naturligtvis att minnas att priserna på spannmål det året föll kraftigt.
Sådden i Iowa, den största producenten, är nu avklarad till 15% – långt efter det femåriga genomsnittet på 79% – medan sådden hos den näst största producenten, Illinois, nu är avklarad till 17% – även det långt efter det femåriga genomsnittet på 64%.
En studie från University of Illinois visat att sådden av majs som görs efter den 10 maj riskerar att ge 8% lägre avkastning i Illinois. Sådd efter den 20 maj kan ge en 15% lägre avkastning och efter den 1 juni så riskerar lantbrukarna en 25% lägre avkastning.
I kartan nedan ser vi hur mycket som var sått för en vecka sedan, i delstat för delstat.
Det ligger dock en hel del ”luft” i efterfrågeprognosen från USDA, som vi skrev om förra veckan. Farmdoc har som vi tidigare skrivit om, beräknat att även en 14% lägre majsskörd än väntat ger högre utgående lager. Slutsatsen är att vi behåller vår säljrekommendation på majs.
Sojabönor
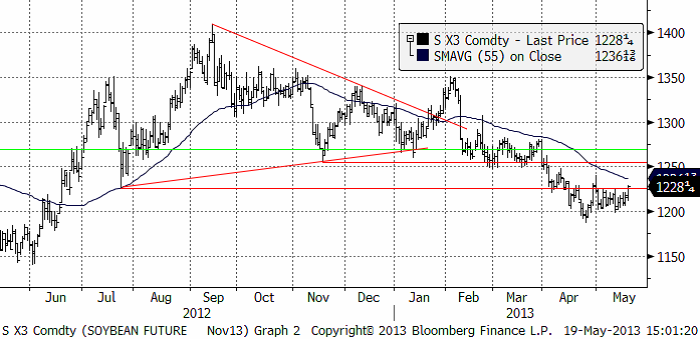
Sojabönorna visade förvånande styrka i fredags. Samtidigt som sådden väntas gå framåt för majs, faller förhoppningarna om att det som inte blir sått med majs blir besått med sojabönor. Starkare import från Kina bidrog också till att få upp sojabönspriset.
Måndagens Crop Progess visar att sådden av sojabönor nu är avklarad till 6%, vilket kan jämföras med 43% vid den här tiden förra året och det femåriga genomsnittet på 24%.
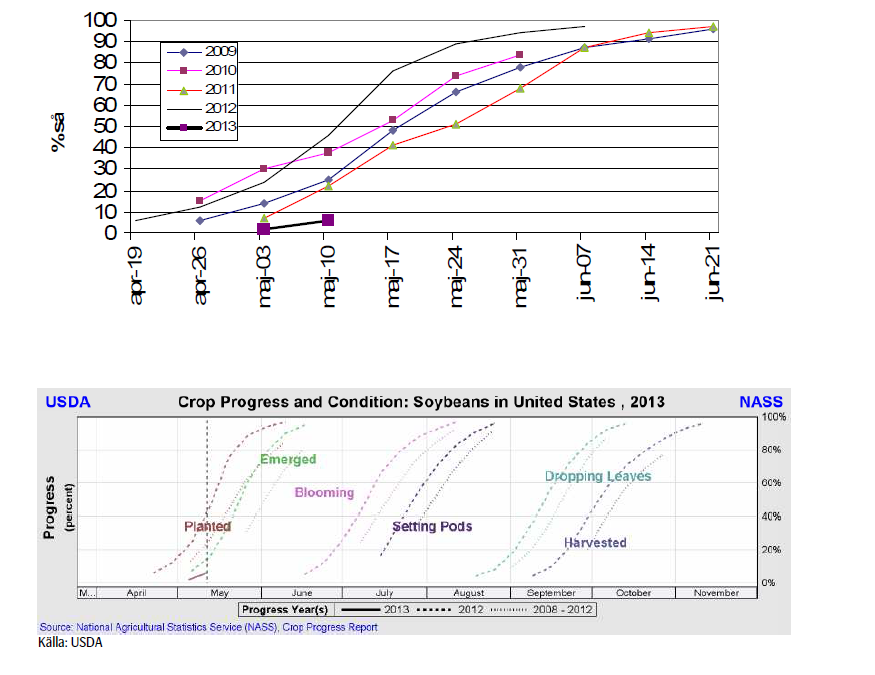
I Iowa, den största producenten, är sådden endast avklarad till 1% – vilket är långt efter det femåriga genomsnittet på 30% vid denna tid – samtidigt som sådden hos den näst största producenten, Illinois, inte ens har påbörjats. Det femåriga genomsnittet för Illinois vid den här tiden ligger på 19%.
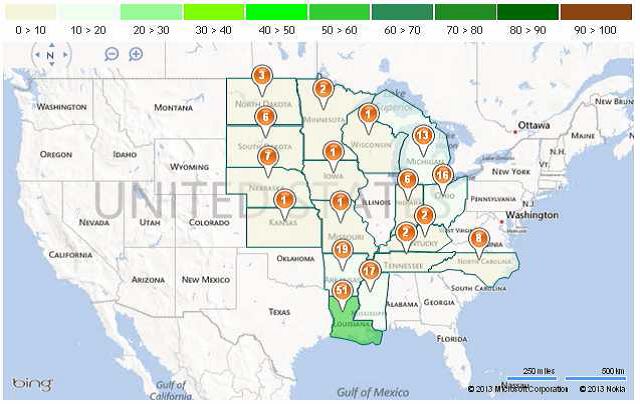
Nedan ser vi en karta som visar såddens framåtskridande i delstat för delstat.
Samtidigt som exporten från USA är stark, håller exporten från Brasilien på att ta fart. Det har bland annat (till och med) gått tre fartyg med USA som destination.
Jag tror att det vi ser nu är en rekyl mot den fallande trenden och alltså ett tillfälle att sälja.
Slutsatsen är att vi behåller och upprepar vår säljrekommendation på sojabönor.
Raps
Rapspriset som förra veckan hade studsat på det tekniska stödet, rekylerade uppåt, men orkade inte hålla sig över 430 euro per ton. Under inflytande av sojamarknaden, kan priset hålla sig på den här nivån, men jag tror annars att det är ett bra tillfälle att sälja raps på.
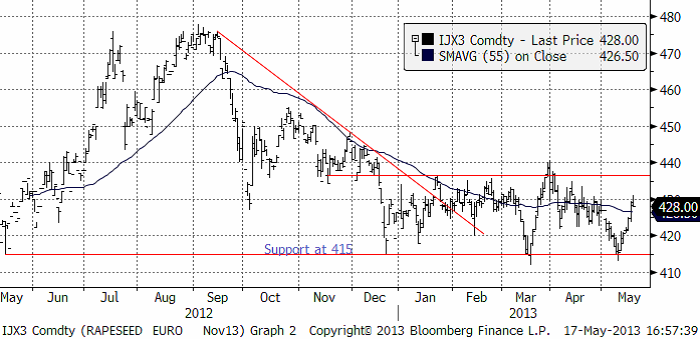
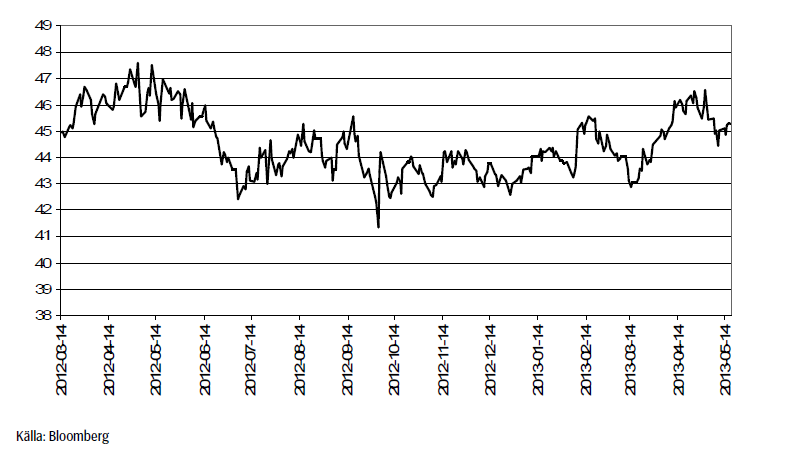
Nedanför ser vi kvoten mellan rapsterminspriset (nov) mot sojabönspriset (nov). Vi ser att raps fram till maj månads början handlades allt dyrare i förhållande till sojabönor, men att detta, som vi påpekat börjat normaliseras genom ett större prisfall på raps än på sojabönor. Ännu finns det extra fallhöjd i rapspriset, eftersom rapsen fortfarande är dyr i ett historiskt perspektiv, i förhållande till sojabönor.
Skulle det tekniska stödet på 415 euro brytas, är detta en rejäl säljsignal. Jag tror att rapspriset kommer att falla. Dels för att sojabönorna bör ha en lång tid av fallande priser framför sig och dels för att rapsen är ovanligt dyr i förhållande till sojabönor.
Mjölk
Fonterras notering fortsatte ner på deras Global Dairy Trade auktion i onsdags.
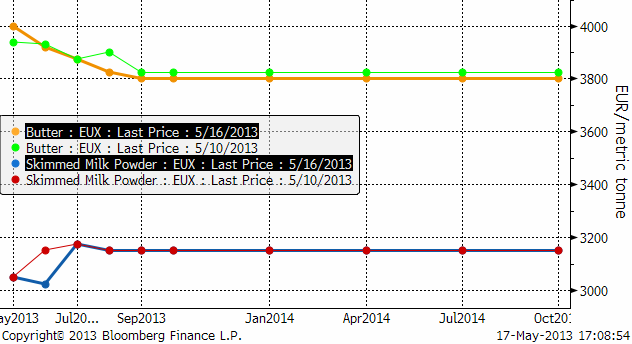
Nedan ser vi terminspriserna framåt i tiden i fredags och veckan innan. Det är ett litet nedställ på SMP, men smöret ligger i princip på samma nivå som förra veckan.
[box]SEB Veckobrev Jordbruksprodukter är producerat av SEB Merchant Banking och publiceras i samarbete och med tillstånd på Råvarumarknaden.se[/box]
Disclaimer
The information in this document has been compiled by SEB Merchant Banking, a division within Skandinaviska Enskilda Banken AB (publ) (“SEB”).
Opinions contained in this report represent the bank’s present opinion only and are subject to change without notice. All information contained in this report has been compiled in good faith from sources believed to be reliable. However, no representation or warranty, expressed or implied, is made with respect to the completeness or accuracy of its contents and the information is not to be relied upon as authoritative. Anyone considering taking actions based upon the content of this document is urged to base his or her investment decisions upon such investigations as he or she deems necessary. This document is being provided as information only, and no specific actions are being solicited as a result of it; to the extent permitted by law, no liability whatsoever is accepted for any direct or consequential loss arising from use of this document or its contents.
About SEB
SEB is a public company incorporated in Stockholm, Sweden, with limited liability. It is a participant at major Nordic and other European Regulated Markets and Multilateral Trading Facilities (as well as some non-European equivalent markets) for trading in financial instruments, such as markets operated by NASDAQ OMX, NYSE Euronext, London Stock Exchange, Deutsche Börse, Swiss Exchanges, Turquoise and Chi-X. SEB is authorized and regulated by Finansinspektionen in Sweden; it is authorized and subject to limited regulation by the Financial Services Authority for the conduct of designated investment business in the UK, and is subject to the provisions of relevant regulators in all other jurisdictions where SEB conducts operations. SEB Merchant Banking. All rights reserved.

Down to the lowest since early May. Brent crude has fallen sharply the latest four days. It closed at USD 64.11/b yesterday which is the lowest since early May. It is staging a 1.3% rebound this morning along with gains in both equities and industrial metals with an added touch of support from a softer USD on top.

What stands out the most to us this week is the collapse in the Dubai one to three months time-spread.
Dubai is medium sour crude. OPEC+ is in general medium sour crude production. Asian refineries are predominantly designed to process medium sour crude. So Dubai is the real measure of the balance between OPEC+ holding back or not versus Asian oil demand for consumption and stock building.
A sharp weakening of the front-end of the Dubai curve. The front-end of the Dubai crude curve has been holding out very solidly throughout this summer while the front-end of the Brent and WTI curves have been steadily softening. But the strength in the Dubai curve in our view was carrying the crude oil market in general. A source of strength in the crude oil market. The core of the strength.
The now finally sharp decline of the front-end of the Dubai crude curve is thus a strong shift. Weakness in the Dubai crude marker is weakness in the core of the oil market. The core which has helped to hold the oil market elevated.
Facts supports the weakening. Add in facts of Iraq lifting production from Kurdistan through Turkey. Saudi Arabia lifting production to 10 mb/d in September (normal production level) and lifting exports as well as domestic demand for oil for power for air con is fading along with summer heat. Add also in counter seasonal rise in US crude and product stocks last week. US oil stocks usually decline by 1.3 mb/week this time of year. Last week they instead rose 6.4 mb/week (+7.2 mb if including SPR). Total US commercial oil stocks are now only 2.1 mb below the 2015-19 seasonal average. US oil stocks normally decline from now to Christmas. If they instead continue to rise, then it will be strongly counter seasonal rise and will create a very strong bearish pressure on oil prices.
Will OPEC+ lift its voluntary quotas by zero, 137 kb/d, 500 kb/d or 1.5 mb/d? On Sunday of course OPEC+ will decide on how much to unwind of the remaining 1.5 mb/d of voluntary quotas for November. Will it be 137 kb/d yet again as for October? Will it be 500 kb/d as was talked about earlier this week? Or will it be a full unwind in one go of 1.5 mb/d? We think most likely now it will be at least 500 kb/d and possibly a full unwind. We discussed this in a not earlier this week: ”500 kb/d of voluntary quotas in October. But a full unwind of 1.5 mb/d”
The strength in the front-end of the Dubai curve held out through summer while Brent and WTI curve structures weakened steadily. That core strength helped to keep flat crude oil prices elevated close to the 70-line. Now also the Dubai curve has given in.

Brent crude oil forward curves

Total US commercial stocks now close to normal. Counter seasonal rise last week. Rest of year?

Total US crude and product stocks on a steady trend higher.

Analys
OPEC+ will likely unwind 500 kb/d of voluntary quotas in October. But a full unwind of 1.5 mb/d in one go could be in the cards
Down to mid-60ies as Iraq lifts production while Saudi may be tired of voluntary cut frugality. The Brent December contract dropped 1.6% yesterday to USD 66.03/b. This morning it is down another 0.3% to USD 65.8/b. The drop in the price came on the back of the combined news that Iraq has resumed 190 kb/d of production in Kurdistan with exports through Turkey while OPEC+ delegates send signals that the group will unwind the remaining 1.65 mb/d (less the 137 kb/d in October) of voluntary cuts at a pace of 500 kb/d per month pace.
Signals of accelerated unwind and Iraqi increase may be connected. Russia, Kazakhstan and Iraq were main offenders versus the voluntary quotas they had agreed to follow. Russia had a production ’debt’ (cumulative overproduction versus quota) of close to 90 mb in March this year while Kazakhstan had a ’debt’ of about 60 mb and the same for Iraq. This apparently made Saudi Arabia angry this spring. Why should Saudi Arabia hold back if the other voluntary cutters were just freeriding? Thus the sudden rapid unwinding of voluntary cuts. That is at least one angle of explanations for the accelerated unwinding.
If the offenders with production debts then refrained from lifting production as the voluntary cuts were rapidly unwinded, then they could ’pay back’ their ’debts’ as they would under-produce versus the new and steadily higher quotas.
Forget about Kazakhstan. Its production was just too far above the quotas with no hope that the country would hold back production due to cross-ownership of oil assets by international oil companies. But Russia and Iraq should be able to do it.
Iraqi cumulative overproduction versus quotas could reach 85-90 mb in October. Iraq has however steadily continued to overproduce by 3-5 mb per month. In July its new and gradually higher quota came close to equal with a cumulative overproduction of only 0.6 mb that month. In August again however its production had an overshoot of 100 kb/d or 3.1 mb for the month. Its cumulative production debt had then risen to close to 80 mb. We don’t know for September yet. But looking at October we now know that its production will likely average close to 4.5 mb/d due to the revival of 190 kb/d of production in Kurdistan. Its quota however will only be 4.24 mb/d. Its overproduction in October will thus likely be around 250 kb/d above its quota with its production debt rising another 7-8 mb to a total of close to 90 mb.
Again, why should Saudi Arabia be frugal while Iraq is freeriding. Better to get rid of the voluntary quotas as quickly as possible and then start all over with clean sheets.
Unwinding the remaining 1.513 mb/d in one go in October? If OPEC+ unwinds the remaining 1.513 mb/d of voluntary cuts in one big go in October, then Iraq’s quota will be around 4.4 mb/d for October versus its likely production of close to 4.5 mb/d for the coming month..
OPEC+ should thus unwind the remaining 1.513 mb/d (1.65 – 0.137 mb/d) in one go for October in order for the quota of Iraq to be able to keep track with Iraq’s actual production increase.
October 5 will show how it plays out. But a quota unwind of at least 500 kb/d for Oct seems likely. An overall increase of at least 500 kb/d in the voluntary quota for October looks likely. But it could be the whole 1.513 mb/d in one go. If the increase in the quota is ’only’ 500 kb/d then Iraqi cumulative production will still rise by 5.7 mb to a total of 85 mb in October.
Iraqi production debt versus quotas will likely rise by 5.7 mb in October if OPEC+ only lifts the overall quota by 500 kb/d in October. Here assuming historical production debt did not rise in September. That Iraq lifts its production by 190 kb/d in October to 4.47 mb/d (August level + 190 kb/d) and that OPEC+ unwinds 500 kb/d of the remining quotas in October when they decide on this on 5 October.

U.S. commercial crude inventories posted a marginal draw last week, falling by 0.6 million barrels to 414.8 million barrels. Inventories remain 4% below the five-year seasonal average, but the draw is far smaller than last week’s massive 9.3-million-barrel decline. Higher crude imports (+803,000 bl d WoW) and steady refinery runs (93% utilization) helped keep the crude balance relatively neutral.

Yet another drawdown indicates commercial crude inventories continue to trend below the 2015–2022 seasonal norm (~440 million barrels), though at 414.8 million barrels, levels are now almost exactly in line with both the 2023 and 2024 trajectory, suggesting stable YoY conditions (see page 3 attached).
Gasoline inventories dropped by 1.1 million barrels and are now 2% below the five-year average. The decline was broad-based, with both finished gasoline and blending components falling, indicating lower output and resilient end-user demand as we enter the shoulder season post-summer (see page 6 attached).
On the diesel side, distillate inventories declined by 1.7 million barrels, snapping a two-week streak of strong builds. At 125 million barrels, diesel inventories are once again 8% below the five-year average and trending near the low end of the historical range.
In total, commercial petroleum inventories (excl. SPR) slipped by 0.5 million barrels on the week to ish 1,281.5 million barrels. While essentially flat, this ends a two-week streak of meaningful builds, reflecting a return to a slightly tighter situation.
On the demand side, the DOE’s ‘products supplied’ metric (see page 6 attached), a proxy for implied consumption, softened slightly. Total demand for crude oil over the past four weeks averaged 20.5 million barrels per day, up just 0.9% YoY.
Summing up: This week’s report shows a re-tightening in diesel supply and modest draws across the board, while demand growth is beginning to flatten. Inventories remain structurally low, but the tone is less bullish than in recent weeks.


A sharp weakening at the core of the oil market: The Dubai curve

Guld nära 4000 USD och silver 50 USD, därför kan de fortsätta stiga
OPEC+ will likely unwind 500 kb/d of voluntary quotas in October. But a full unwind of 1.5 mb/d in one go could be in the cards

Blykalla och amerikanska Oklo inleder ett samarbete

Fortsatt stabilt elpris – men dubbelt så dyrt som i fjol

Eurobattery Minerals satsar på kritiska metaller för Europas självförsörjning

Mahvie Minerals i en guldtrend

Guldpriset kan närma sig 5000 USD om centralbankens oberoende skadas

OPEC signalerar att de inte bryr sig om oljepriset faller kommande månader
Volatile but going nowhere. Brent crude circles USD 66 as market weighs surplus vs risk
-
 Nyheter4 veckor sedan
Eurobattery Minerals satsar på kritiska metaller för Europas självförsörjning
-
 Nyheter3 veckor sedan
Mahvie Minerals i en guldtrend
-
 Nyheter4 veckor sedan
Guldpriset kan närma sig 5000 USD om centralbankens oberoende skadas
-
 Nyheter4 veckor sedan
OPEC signalerar att de inte bryr sig om oljepriset faller kommande månader
-
Analys3 veckor sedan
Volatile but going nowhere. Brent crude circles USD 66 as market weighs surplus vs risk
-

 Nyheter3 veckor sedan
Aktier i guldbolag laggar priset på guld
-

 Nyheter3 veckor sedan
Kinas elproduktion slog nytt rekord i augusti, vilket även kolkraft gjorde
-
 Nyheter2 veckor sedan
Tyskland har så höga elpriser att företag inte har råd att använda elektricitet