

Analys
SEB Jordbruksprodukter, 2 augusti 2012
 Inledning
Den senaste veckan har priserna inte rört sig mycket. Även orderflödet har varit lugnare. Folk verkar ha stannat upp och funderat på vad som kommer att hända härnäst. På fredag nästa vecka publicerar USDA augustis WASDE-rapport. Kanske kommer det att vara lugnt fram tills den rapporten ger mer vägledning.
Vi fortsätter att ha en vy om högre priser på vete, maltkorn, majs, och sojabönor. Priset på socker står och väger, vid ett vägskäl, kan man säga.
Odlingsväder
Bilder på det varma vädret i Ryssland och Svartahavsområdet börjar komma ut nu. Nedan ser vi en kartbild publicerad av Martell Crop Projections.


Southern Oscillation Index har tagit sig upp till neutrala förhållanden igen, men det anses vara temporärt, eftersom de flesta prognosmodeller pekar på att ENSO ska vara nära El Niño-förhållanden, dvs med SOI närmare eller lägre än -8.

Australiensarnas prognos för ENSO pekar som vi ser nedan på att El Niño kan utveckla sig under hösten, men att det än så länge är osäkert. ENSO surfar precis på gränsen till El Niño.

Eurokrisen
Vad som sker i EU är att det finns en social acceptans att banker tas över av staten därför att man inte vill uppleva obehaget av att bankerna går under var och en för sig, Detta gör att det är rimligt att anta att staternas i fråga egentliga skulder är deras egen statsskuld + bankernas skulder. När man studerar den typen av skuldberg i förhållande till de här ländernas skatteintäkter, får man en skrämmande bild. Än så länge försöker man skjuta upp det oundvikliga. ECB:s satsning på att få ner räntorna i Spanien är det senaste och främsta exemplet på detta. Vi ser nedan hur räntorna har på deras tioårs statsobligation har fallit från 7.75 till 6.68. Förmodligen får vi se räntemarknaden ta ett nytt kliv uppåt inom kort. Skuldberg av den här storleken blir man av med genom att inte betala (skuldnedskrivning / konkurs) eller genom att betala med nytryckta pengar (inflation).

Inköpschefsindex, PMI, för de stora ekonomierna har sjunkit stadigt det senaste året. Tysklands PMI för tillverkningsindustrin ligger nu under Frankrikes, på 43 mot 43.4. Eurozonen ligger på 44. Storbritannien har bromsat in fort de senaste tre månaderna och har sjunkit från 50.2 i april till 45.4 i juli. USA har halkat under 50. Endast Kina ligger över 50. Gårdagens kinesiska PMI kom in på 50.1, vilket är en tiondel lägre än i juni (50.2). PMI anses vara en ”ledande indikator” för ekonomins utveckling.

PMI, som är en ledande indikator, är för Eurozonen på samma nivå som månaden före Lehmankraschen 2008.
Vete
Matifvetet med novemberleverans nådde upp till 271.50 den 19 juli, men har sedan dess rekylerat ner till 257.25 euro i skrivande stund. Det är en nedgång med undefär 2.5 euro sedan förra veckobrevet. Frågan är om det här är en konsolidering inför vidare uppgång eller en toppnivå? Vi tror att marknaden kan komma att röra sig sidledes ännu en liten tid, men att priset sedan kommer att gå ännu högre.

IGC (International Grains Council) kom med sin rapport i förra veckan. Den globala produktionen av vete 2012/13 beräknas uppgå till 665 mt, vilket är oförändrat från tidigare prognos men lägre än förra årets 696 mt. Prognosen för veteproduktionen i Ryssland och Kazakstan justeras ned med 4 mt till 45 mt respektive 3 mt till 12 mt, medan utsikterna för produktionen i Kina och Indien justeras upp. Globala vete lager i slutet på säsongen 2012/13 justeras upp med 1 mt till 183 mt, vilket dock kvarstår som ett fyra-årslägsta. Nedan ser vi Chicagovetet med leverans i december. Dollarn stärks hela tiden mot euron, som faller stadigt i takt med att euroland blir mindre värt. Därför tyngs prisutvecklingen i cent mer än på Matif. På den punkten, betänk också att eurons fall gör att jordbruksmarken faller i pris i dessa länder; kostnaden rent allmänt utom för drivmedel och gödsel, för att producera spannmål sjunker.

Nedan ser vi hur terminspriserna på Matif och Chicago förändrats den senaste veckan. Det är på terminer med kort löptid vi sett att priset gått ner. De längre terminspriserna är i praktiken oförändrade. Det är naturligt eftersom det är den här skörden just nu, som är föremål för osäkerhet om hur stor den blir.

Vi ser i terminskurvorna ovan att Chicago fortfarande ligger över Matif för alla löptider. Ska man prissäkra framåt i tiden ger Chicago alltså ett högre pris än Matif.
Antalet artiklar på global basis som handlar om wheat+export+ban minskade den senaste veckan till 70 artiklar. Förra veckan var det 102 artiklar.

Vi ser att när det blir populärt att prata om wheat+export+ban i nyheterna, stiger vetepriset mot riktigt höga höjder. En panel av indiska (delstats) ministrar träffades i tisdags för att diskutera torkan i landet. De värst drabbade områdena är Punjab, Haryana, Karnataka och delar av Maharashtra och Gujarat. Andra delar av landet har fått för mycket nederbörd och istället drabbats av översvämningar. Punjab och Haryana är stora producenter av ris, medan de västra delstaterna Maharashtra och Gujarat är betydande producenter av oljeväxter och bomull.
 Centralbanken har också precis sänkt landets tillväxtprognos pga torkan. De åtgärder som ministrarna beslutade sig för var att öka stödet för dieselkonsumtion för jordbrukare, ökade stödet för utsäde. Man tog också bort importskatten på proteinmjöl. Man hade nämnt att man skulle diskutera att införa begränsningar i terminshandeln innan mötet, men detta gjorde man alltså inte. Skörden av linser, etc väntas bli avsevärt lägre i år än förra året, men landet har betydande lager sedan rekordskörden år 2007.
I Ryssland har den södra Krasnodar-regionen, en av få som nu är klara, skördat ca 5 mt spannmål, ungefär en tredjedel av förra årets skörd. På vissa ställen i västra Sibirien och Ural har temperaturen inte gått under 30 grader på över en månad, vilket också har lett till skogsbränder. Även om den ryska torkan är långt ifrån lika allvarlig som den i USA, har den extrema värmen fått landets jordbruksministerium att förra månaden sänka sin prognos för produktionen av spannmål till 80 mt, en minskning med 15 procent från förra året. I måndags sänkte Federal Metereorological and Environmental Monitoring Service sin prognos till 77 mt från 80 mt, något som förväntas följas av jordbruksministeriet. Ryssland behöver ca 72 mt spannmål för inhemska behov, och exporterar i allmänhet det som blir över. Oron över att Ryssland ska inför exportförbud eller exportrestriktioner kvarstår, men skulle kunna vara något som blir svårare för landet att införa i och med Rysslands inträde i WTO där reglerna för den globala handeln begränsar sådana genomföranden.
En nybildad kommission för tryggad livsmedelsförsöjning, som leds av Rysslands vice premiärminister Arkady Dvorkovich, kommer att träffas den 8 augusti för att diskutera spannmålssituationen i Ryssland.
Som ett resultat av det mycket torra vädret i vissa delar av Kazakstan förväntas landets spannmålsproduktion 2012 att sjunka kraftigt till drygt hälften av fjolårets rekordnivå. Men trots kraftigt minskad produktion, kommer sannolikt välfyllda lager att tillåta fortsatta höga exportvolymer under 2012/13. Per den 1 juli 2012 uppgick spannmåls-lagren till 9.8 mt, varav 9.4 mt vete.

Produktionen av vete förväntas sjunka till 12 mt, jämfört med rekordet på nästan 23 mt under 2011. Medan spannmålsarealen kvarstår stadigt på 16.3 miljoner hektar, ser man däremot betydande förändringar mellan grödor. Arealen för vete har sjunkit med 2%, medan den totala arealen för korn har ökat kraftigt med 140 000 hektar till 1.8 miljoner hektar med den största ökningen i de nordliga regionerna.
Torka i vissa norra delar av Buenos Aires, den provins där mer än hälften av all vete produceras, och i södra Cordoba provinsen i Argentina har börjat påverka 2012/13 års gröda, där lantbrukarna ännu inte är klara med sådden. Landet är världens 6:e största vete exportör och den största leverantören till grannlandet Brasilien. Regeringen uppskattar att landets lantbrukare kommer att så 3.8 miljoner hektar med grödan denna säsong, en minskning från 4.6 miljoner hektar förra säsongen. I förra veckan hade lantbrukarna sått 88% av den estimerade arealen, upp 9% från veckan innan. BAGE estimerar landets vete areal till 3,6 miljoner hektar och USDA beräknar Argentinas veteproduktion till 12 mt under 2012/13, en minskning från 14.5 mt förra säsongen.
Maltkorn
Novemberkontraktet på maltkorn ligger kvar över stödet på 260 euro. Så länge priset håller sig över den nivån tror vi att man bör avvakta med att sälja för att se om priset kan gå högre.

Potatis
Potatispriset för leverans nästa år, har fortsatt att röta sig i det prisintervall vi skrivit om tidigare, mellan 14 och 16 euro per deciton. Om priset går utanför intervallet är det en signal om att priset kan dra iväg, men så länge priset håller sig inom intervallet är 16 = högt pris och 14 = billigt pris.

Majs
Priset på decembermajs ligger nu kring 800 cent. Jämna siffror brukar dra till sig mycket handel, eftersom det är psykologiskt lättare för folk att lägga en order på ”800 cent”, än t ex ”792.25”. 800 cent är alltså ett motstånd. Det har gått mycket fort att handla upp priset och någon slags rekyl eller konsolidering ”borde” kunna äga rum.

Nedan ser vi den av USDA enligt WASDE-rapporterna väntade avkastningen i bushels per acre i USA.

Som vi ser är trenden stadigt uppåtriktad och Monsanto, t ex förutspår att det kommer att vara normalt med 300 bushels per acre år 2030. Längs vägarna i ”corn belt” kan man se skyltar som den reklamskylt vi ser nedanför:

Crop conditions rapporterades i måndags kväll som 24% av majsskörden i good eller excellent condition. Detta fick priserna naturligtvis att stiga ännu mer. Studerar vi förhållandet mellan crop condition och majspris ser vi att korrelationen över tiden mellan förändringar i crop condition och majspris är kraftigt negativ, som den borde vara. Vi ser detta nedan, med de faktiska noteringarna i den övre delen och korrelationen dem emellan i den nedre.

IGC (International Grains Council) kom med sin rapport i förra veckan och sänkte sin prognos kraftigt för den globala majsproduktionen 2012/13, med hänvisning till den värsta amerikanska torkan sedan 1956, och estimerar samtidigt att majslagren kommer att sjunka till ett sex-års-lägsta i slutet av säsongen. Den globala majsproduktionen beräknas nu uppgå till 864 mt, en nedjustering med 53 mt från tidigare prognos, vilket också är lägre än föregående säsongs 870 mt. Majsproduktionen i USA justeras ned med 50 mt till 300 mt, vilket är lägre än USDA’s senaste estimat på 329.5 mt.

Sojabönor
IGC (International Grains Council) kom med sin rapport i förra veckan (se tabellen ovan). Prognosen för den globala produktionen av sojabönor förväntas återhämta sig kraftigt under 2012/13, med en uppgång på 9% på årsbasis till 259 mt, även om prognosen hänger på en stark återhämtning av produktionen i Sydamerika där sådden börjar i fjärde kvartalet 2012. Däremot så justeras produktionen i USA ned med 8.3 mt till 79 mt. Nedan ser vi kursgrafen för november-bönorna. Vi ser att pristrenden är obruten uppåtriktad.

Nedan ser vi sojabönsodlarnas situation i USA. Det är ovanligt stora arealer som är i poor eller very poor condition. Andelen har ökat med 2%-enheter sedan förra veckan.

Celeres rapport visar att 41% av den brasilianska sojabönsskörden för 2012/13 har sålts, jämfört med 39% förra veckan och jämfört med 10% för ett år sedan. 97% av skörden 2011/12 har sålts, oförändrat från förra veckan och jämfört med 79% för ett år sedan.
Raps
Priset på novemberterminen befinner sig alltjämt i en obruten uppåtgående trend. 500 euro fungerar som ett starkt stöd. Skulle den nivån brytas finns nästa stöd på 480 euro.

Oil World höjer sin prognos för EU’s rapsproduktion, för andra gången på två veckor, till åtminstone 19.0 mt från tidigare 18.2 mt. Det blöta vårvädret har gynnat grödorna hos de ledande rapsproducenterna i Europa och den förväntade ökade avkastningen har justerats upp framförallt i Tyskland där produktionen beräknas uppgå till ca 4.9-5.0 mt och skörden där är nu avklarad till 20-25%. Produktionen i Frankrike beräknas uppgå till 5.4-5.5 mt, jämfört med förra årets 5.37 mt, utifrån en avkastning på 3.4-3.5 ton per hektar.
I Storbritannien däremot förväntas en minskning med 100 000 ton från förra årets rekordskörd på 2.7 mt, trots ökad sådd, men det är fortfarande oklart hur de senaste tidens kraftiga regn kommer att påverka grödorna. Med tanke på att rapsen noteras i euro, som är svag, kan man tänka sig högre priser (i euro) framöver.
Gris
Decemberkontraktet har etablerat ett bekräftat stödområde på 76 – 77 cent. Med högre foderkostnader och den minskande lönsamheten för grisproducenterna bör det finnas utsikter för ett högre pris på lean hogs.

Mjölk
Mjölkpriset drivs naturligtvis upp pga av torkan i USA och Ryssland, som även drabbar höproduktionen. Priset på skimmed milk powder på tyska börsen har fått från 1950 i maj till 2275 euro per ton idag, som vi ser i diagrammet för priset på spotkontraktet på tyska Eurex nedan.
Samtidigt kunde vi läsa på ATL.nu igår att Arla sänkt avräkningspriset till mjölbönder med motivationen ”Det är mycket, mycket mjölk i marknaden just nu och det pressar priserna hos alla bolag”.

På den amerikanska börsen, där torkan som drabbat foderproduktionen är mycket allvarligare än i Europa, har priset rusat. Nedan ser vi decemberkontraktet.

Socker
Priset på socker ligger fortfarande och balanserar: antingen bryts stödet och då för vi troligtvis en större prisnedgång mot 19 cent. – Eller så bryts motståndet som nu ligger på ca 23 cent, och då får vi antagligen en prisuppgång till 26 cent i första hand, kanske ännu mer.

[box]SEB Veckobrev Jordbruksprodukter är producerat av SEB Merchant Banking och publiceras i samarbete och med tillstånd på Råvarumarknaden.se[/box]
Disclaimer
The information in this document has been compiled by SEB Merchant Banking, a division within Skandinaviska Enskilda Banken AB (publ) (“SEB”).
Opinions contained in this report represent the bank’s present opinion only and are subject to change without notice. All information contained in this report has been compiled in good faith from sources believed to be reliable. However, no representation or warranty, expressed or implied, is made with respect to the completeness or accuracy of its contents and the information is not to be relied upon as authoritative. Anyone considering taking actions based upon the content of this document is urged to base his or her investment decisions upon such investigations as he or she deems necessary. This document is being provided as information only, and no specific actions are being solicited as a result of it; to the extent permitted by law, no liability whatsoever is accepted for any direct or consequential loss arising from use of this document or its contents.
About SEB
SEB is a public company incorporated in Stockholm, Sweden, with limited liability. It is a participant at major Nordic and other European Regulated Markets and Multilateral Trading Facilities (as well as some non-European equivalent markets) for trading in financial instruments, such as markets operated by NASDAQ OMX, NYSE Euronext, London Stock Exchange, Deutsche Börse, Swiss Exchanges, Turquoise and Chi-X. SEB is authorized and regulated by Finansinspektionen in Sweden; it is authorized and subject to limited regulation by the Financial Services Authority for the conduct of designated investment business in the UK, and is subject to the provisions of relevant regulators in all other jurisdictions where SEB conducts operations. SEB Merchant Banking. All rights reserved.

Brent M1 moving below the 200 dma of $78.7/b. Brent crude continued its move lower yesterday with a decline of 3.3% to $77.9/b. This morning it is adding another drop of 1.4% to $76.8/b. Israel bombing Lebanon during the weekend was a violence of the MoU and Iran was quick to declare the SoH closed again. But the willingness to move forward by both the US and Iran obviously trumped the bombing in Lebanon making the event more of a hiccup on the road of further negotiations.

The US has now waived sanctions against Iranian oil exports for two months allowing Iran to sell its oil all over the world, though sanctions instated in Europe will take more time to unwind. Oil from Iran, Russia as well as Venezuela can for the time being be sold across the world without any sharp discount due to sanctions. Chinese Tea-pot refineries will suffer as they previously could buy rebated crude while selling products at market prices.
Crude oil is no flowing out of the SoH with latest number close to 7 mb/d on a three day moving average. That is still well below the 14 mb/d of crude and 6 mb/d of products normally flowing out of the SoH. Latest estimate is that there is around 80 mb of crude on water inside the Persian Gulf and maybe another 80 mb of oil products on water as well. If crude is exiting the SoH at a rate of around 7 mb/d, then the 80 mb of crude would be depleted within 10-15 days and there after the flow would rely on new crude tankers entering, loading and then exiting the SoH to continue further flows. Given the uncertainties surrounding the status of the SoH with Iran stating that it was closed again as recent as this weekend, there is likely an asymmetry here where ships and oil stranded in the SoH for months are much more eager to exit than new ships are eager to enter.
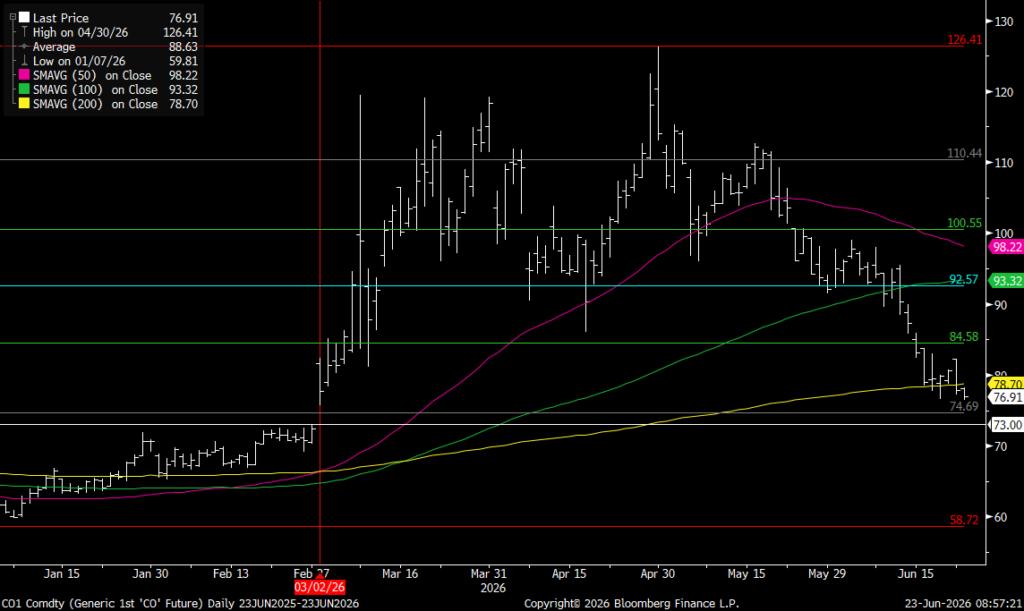
For now Brent crude keeps falling like a rock with the front-end Brent contract now only trading at a premium of $7.6/b above the five year contract. Quickly heading towards parity. The Brent M1 contract has now broken below its 200 dma of $78.7/b and is closing in on the Fibo-level at $74.7/b. Below that there is not much more supporting levels to be found before $73/b which would close the gap from February 3.
Brent crude M1 technical levels
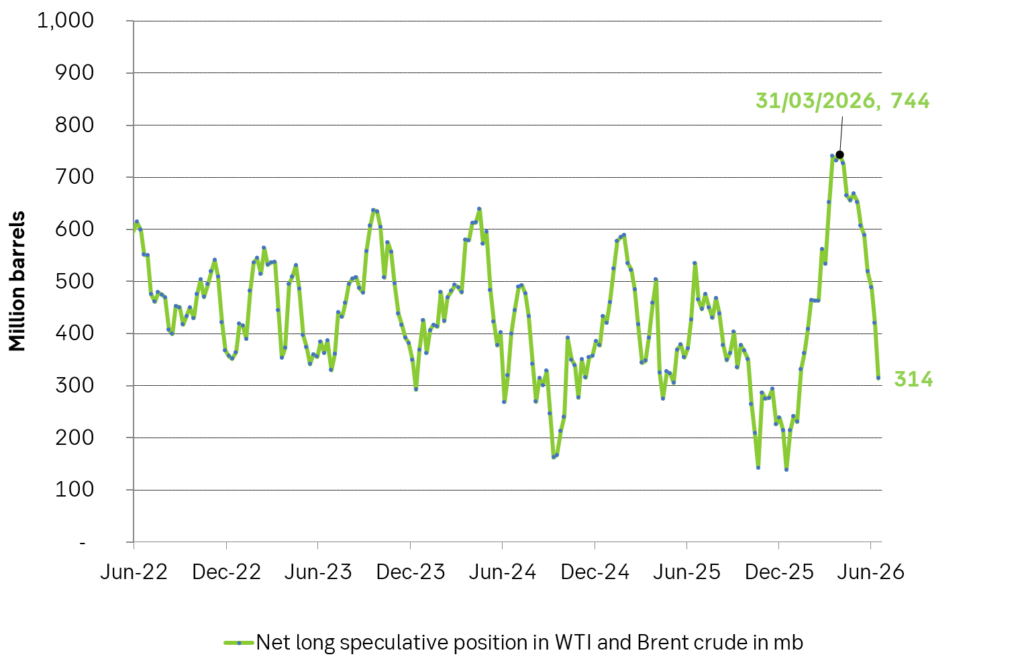
Net long speculative positions are also falling like a rock and as of Tuesday last week the net long positioning in Brent and WTI together summed to 314 million barrels and falling fast.
Will there be a rebound? A possible combination could be an exhaustion of the oil blob caught within the SoH within 1-2 weeks if exits continue at current rate while new ships entering are much more cautious, more Israeli bombardments in Lebanon as Netanyahu fights for re-election, a temporary closure of the SoH again while speculative short positions take cover buying back and covering their positions.
US and Israeli stands versus Iran could harden beyond elections so 2027 surplus is far from given. But Iran and the US are all in all moving towards a set of solutions with both clearly eager to reopen the SoH and keep it open. And that is what the market is pricing along with sharply falling prices. The ongoing discussions will likely take months and last beyond both the upcoming Israeli election (before 27 oct) and the US midterm elections on 3 Nov. Beyond those dates the stance by both Israel and the US may harden again versus Iran. But Iran knows that and is most likely preparing for such a hardening turn. Thus a surplus of oil and global oil stock rebuilding in 2027 (as now is mostly projected) is far from given.
Selling down on a ”deal”. Brent crude fell 6.2% last week with accelerated weakness towards the end of the week. Close of the week at $87.33/b and low of the week (and on Friday) of $85.8/b. Brent is falling another 4% this morning to $83.7/b on confirmation by Iran that a MoU text has been reached and that it will be signed on Friday this week.
So what is this ”deal” worth? Talk on the desk here this morning is that it is much like ”putting lipstick on a pig” where Trump has to sell this at home as a victory where ”the SoH has reopened”, the nuclear issue will be ironed out over the coming 60 days (or maybe 600 days?) and US consumers are getting a lower gasoline price and maybe US republicans survives the midterm elections.
The importance for Iran is that it emerges as the defacto winner of this war in the eyes of the non-US public world. That Iran now onwards is the ”ruler of the SoH” (combo of geography and new weapons systems like drones) or more softer: ”the guarantor of safe passage through the SoH”.
Iran doesn’t need nuclear weapons any more. Nuclear deterrence doesn’t work any more. Ukraine has made many attacks deep into Russia without being nuked in return. Plenty of Iranian ballistic rockets blasts over Israel but Iran wasn’t nuked in return.
There is no trust between the US and Iran. We don’t know all the details yet of the MoU. But what we do know is that there is no trust between the US and Iran what so ever. This is probably more like a descriptive text on how they can cooperate in a way where both sides keeps tactical leverage. Neither side makes irreversible concessions. Violations can be punished quickly. Cooperation produces immediate benefits.
This is a fragile structure. It can easily break down. There may be details which cannot be overcome. To be seen on Friday. The US has to show that it is willing put enough force behind managing and restraining Israel versus Hezbollah in Lebanon. We have seen that Netanyahu hasn’t listened all that much to Trump’s directives and wishes. This could be a major obstacle.
A gradual reopening is tactically preferable for Iran. A tactical leverage for Iran right now is that global oil stocks have been drawn down towards painful and increasingly dangerous levels with increasing risks for oil price spikes in mid-July to August. This together with US midterm elections on 3 November gives tactical leverage to Iran. Iran probably doesn’t want to fully give up on that leverage. A rapid, full reopening where global stocks are able to refill over the coming 60 days will significantly erode that leverage. If Iran reinstates a closure of the SoH after 60 days (if talks break down again), then the effect won’t be that impactful in terms of prices and the US midterm elections.
So a gradual and partial reopening where global markets gets the oil they need while they are unable to rebuild stocks could be a practical middle way for both parties. Trump can sell it as ”the SoH has reopened” and get affordable gasoline for US consumers. Iran can sell it as ”the SoH has fully reopened, but there is some friction” so flow is only 60-80% of normal.
Not much real demand destruction below $100/b. What we do know is that there is not much real price pain demand destruction for oil globally at an oil price below $100/b. A lot of demand-shock destruction. Fear. But demand should now come roaring back towards normal with fear for exceptionally high prices now is rapidly receding.
Sudden China demand destruction due to EVs? Bullocks. EV share of total Chinese carpool now around 13%. Share of new sales of EVs has reached 50%. This is a very gradual process. It doesn’t make oil demand fall like a rock over night. When EV new sales share reaches 100%, then the gasoline car pool will contract by some 5-10% per year. But that is only gasoline. Sudden reduction in Chinese oil demand is more about shock and risk.
Chinese crude oil imports will come roaring back. At what price? Today’s ”neutral” oil price is $70/b. That is the five year price which has steadily traded around the $70/b mark over the past 3-4 years. With still a risky picture one would think that China and the rest of the world will be big buyers of oil in the range of $70-85/b.
Global demand will likely snap back towards normal, forecasted demand and growth at such prices.
Physical reopening is a gradual process. The physical and practical reopening of the SoH will likely be gradual rather than sudden. And that probably suites Iran tactically as well.
Brent M1 price versus the Brent 5-yr (today’s ”normal” price)

Market is starting to take US/Iran headlines with a pinch of salt. Brent crude rose $2.8/b yesterday to an official close of $112.1/b. But after that it traded as low as $108.05/b before ending late night at around $109.7/b. Through the day it traded in a range of $106.87 – 112.72/b amid a flurry of news or rumors from Iran and the US. ”US temporary sanctions during negotiations” (falls alarm). ”We will bomb Iran” (not anyhow),… etc. While the market is still fluctuating to this kind of news flow, it is starting to take such headlines with a pinch of salt.
We’ll see. Maybe, maybe not. The Brent M1 contract is trading at $110.2/b this morning which very close to the average ticks through yesterday of $110.4/b.
Trump with bearish, verbal intervention whenever Brent trades above $110/b it seems. What seems to be a pattern is that Trump states something like ”very good negotiations going on with Iran”, ”New leaders in Iran are great,..”, ”Great progress in negotiations,…”, ”Deal in sight,..” etc whenever the Brent M1 contract trades above $110/b. An effort to cool the market. These hot air verbal interventions from Trump used to have a heavy bearish impact on prices, but they now seems to have less and less effect unless they are backed by reality.
As far as we can see there has been no real progress in the negotiations between the US and Iran with both sides still standing by their previous demands.
Iran is getting stronger while the cease fire lasts making a return to war for Trump yet harder. Iran is naturally in constant preparation for a return to war given Trump’s steady threats of bombing Iran again. Iran is naturally doing what ever is possible to prepare for a return to war. And every day the cease fire lasts it is better prepared. This naturally makes it more and more difficult and dangerous for the US to return to warring activity versus Iran as the consequences for energy infrastructure in the Persian Gulf will be more and more severe the longer the cease fire lasts. Israel seems to see it this way as well. That the war is not won and that current frozen state of a cease fire gives Iran opportunity to rebuild military and politically.
Global inventories are drawing down day by day. How much? In the meantime the Strait of Hormuz stays closed. There is varying measures and estimates of how much global inventories are drawing down. Our rough estimate, back of the envelope, is that global inventories are drawing down by at least some 10 mb/d or about 300 mb/d in a balance between loss of supply versus demand destruction. Other estimates we see are a monthly draw of 250-270 mb/d. The IEA only ’measured’ a draw in global observable stocks of 117 mb in April with oil on water rising 53 mb while on shore stocks fell 170 mb. But global stocks are hard to measure with large invisible, unmeasured stocks. As such a back of the envelope approach may be better.
Oil products is what the world is consuming. Oil product prices likely to rise while product stocks fall. Strategic Petroleum Reserves (SPR) are predominantly crude oil. Discharging oil from OECD SPR stocks, a sharp reduction in Chinese crude imports and a reduction in global refinery throughput of 6-7 mb/d has helped to keep crude oil markets satisfactorily supplied. But global inventories are drawing down none the less. And oil products is really what the world is consuming. So if global refinery throughput stays subdued, then demand will eventually have to match the supply of oil products. The likely path forward this summer is a steady draw down in jet fuel, diesel and gasoline. Higher prices for these. Then, if possible, higher refinery throughput and higher usage of crude in response to very profitable refinery margins. And lastly sharper draw in crude stocks and higher prices for these. But some 6 mb/d of oil products used to be exported through the Strait of Hormuz. And it may not be so easy to ramp up refinery activity across the world to compensate. Especially as Ukraine continues to damage Russian refineries as well as Russian crude production and export facilities.
Watch oil product stocks and prices as well as Brent calendar 2027. What to watch for this summer is thus oil product inventories falling and oil product premiums to crude rising. Another measure to watch is the Brent crude 2027 contract as it rises steadily day by day as the Strait of Hormuz stays closed and global oil inventories decline. The latter is close to the highest level since the start of the war and keeps rising.
The Brent M1 contract and the Brent 2027 prices and current price of jet fuel in Europe (ARA). All in USD/b

Our back of the envelope calculation of the global shortage created by the closure of the Strait of Hormuz. Note that 3.5 mb/d of discharge from SPR is also a draw. Note also that ’Forced demand loss’ of 2.5 mb/d is probably temporary and will fall back towards zero as logistics are sorted out leaving ’Price demand loss’ to do the job of balancing the market. Thus a shortfall of at least 9 mb/d created by the closure. More if SPR discharge is included and more if Forced demand loss recedes.


Brent falling like a rock with oil likely to flow from SoH until at least 3 November

Vattenfalls och Industrikrafts kärnkraftsbolag Videberg Kraft har valt Rolls-Royce SMR
Selling down on a ”deal”

Sommarväder skapar prisrally på elbörsen
Oil product price pain is set to rise as the Strait of Hormuz stays closed into summer
Sommarväder skapar prisrally på elbörsen
Vattenfalls och Industrikrafts kärnkraftsbolag Videberg Kraft har valt Rolls-Royce SMR
Selling down on a ”deal”
Brent falling like a rock with oil likely to flow from SoH until at least 3 November
-
Nyheter3 veckor sedan
Sommarväder skapar prisrally på elbörsen
-
 Nyheter1 vecka sedan
Vattenfalls och Industrikrafts kärnkraftsbolag Videberg Kraft har valt Rolls-Royce SMR
-
Analys1 vecka sedan
Selling down on a ”deal”
-
Analys5 timmar sedan
Brent falling like a rock with oil likely to flow from SoH until at least 3 November