

Analys
SEB Jordbruksprodukter, 14 januari 2013
 I fredags på den nya tiden 18:00 publicerade det amerikanska jordbruksdepartementet årets första World Agricultural Supply and Demand Estimates (WASDE) och lagerstatistiken per den 1 december samt sådd höstvete-areal. Vi går igenom WASDE-statistiken under respektive råvara längre fram i veckobrevet.
 Lagerstatistiken i miljoner bushels visade att det fanns mindre sojabönor och majs i lager i USA än marknaden hade väntat sig. Viktigast för dessa var majs, eftersom lagersituationen där är mest ansträngd efter sommarens torka i USA. Lagren visade sig vara ännu mindre än vad marknaden hade väntat sig. Det betyder att foderefterfrågan inom USA har varit större än vad marknaden hade väntat sig. Etanolproduktion och export har vi ju god koll på. Vi minns också att USDA i september gjorde en märklig uppjustering av lagren (1 september), som vi skrev att vi inte trodde på (att lagret borde vara lägre). Man hade ökat lagret per 1 september med den del som var skördad tidigt, skörden var ju ovanligt tidig, men inte i motsvarande mån minskat skörden resten av hösten.
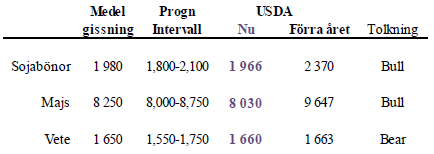
Lagren av sojabönor indikerar att priset bör gå upp något för att nå marknadsjämvikten. För vete motiveras något lägre pris, men det är så lite att det nästan är försumbart.
Om vi så går vidare med vetet för att se hur mycket som var sått i miljoner acres, enligt USDA:s statistik, av höstvete, kan vi se att det är väsentligt mindre Hard Red Winter Wheat, den sort som handlas på Kansas City Board of Trade. Det har såtts mindre HRWW än förra året, till och med. HRWW innehåller mer protein än Chicago-sorten, Soft Red Winter Wheat. Det har såtts mer SRWW än väntat och betydligt mer än förra året. Vi kan alltså vänta oss i år att premien för protein ökar i år.
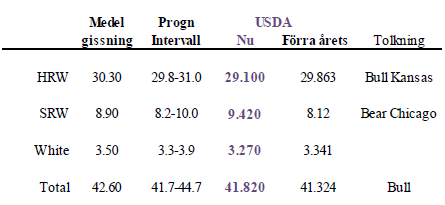
Sammantaget är det en rapport som indikerar högre priser för vete. Möjligtvis kommer detta att locka fram mer sådd av vårvete och i så fall mindre sådd av majs och sojabönor. I vilket fall, sammantaget en rapport som pekar på högre priser på alla dessa grödor.
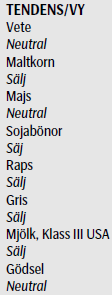
Vi ändrar nu rekommendationen för vete och majs till neutral från sälj.
Odlingsväder
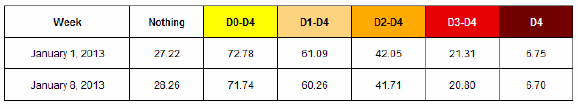
Torkan i USA håller i sig, som vi ser i den senaste ”Drought Monitor”, som publicerades i torsdags. Sedan förra veckan är det en marginell förbättring i torkan, dvs något lite mindre yta är drabbad av torka.
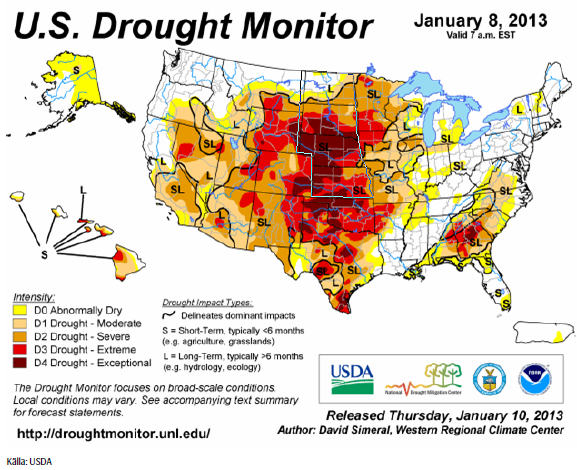
Sedan förra veckan har alla kategorier av torka (D0 – D4) minskat, som vi ser i nedanstående tabell.
I Kina har det varit extremt kallt vilket fått priset på höstvete att nå en rekordnivå. Mer om det nedan. I England har det regnat extremt mycket den senaste veckan. Höstvetet befaras ha tagit skada. Argentina fick tillbaka torrt väder i veckan (majs, sojabönor).
Vete
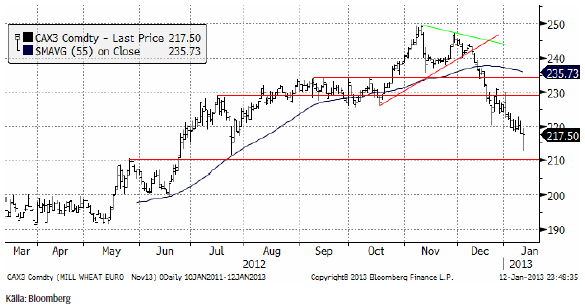
Nedan ser vi november (2013) kontraktet, där priset föll kraftigt i fredags, men återhämtade sig och stängde på 217.50, nästan oförändrat på dagen.
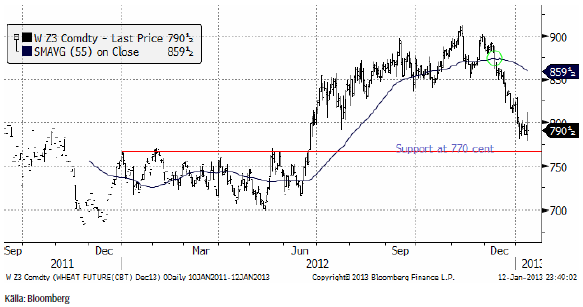
Nedan ser vi decemberkontraktet på CBOT. Chicago stängde upp efter fredagens handel, till skillnad från Matif. GASC, den Egyptiska statens huvudsakliga veteimportör, köpte 115,000 ton amerikanskt och kanadensiskt vete i den senaste tendern, som publicerades i veckan. Till nästa tender GASC franskt vete. Det amerikanska vetet är det billigaste i världen, men frågan är om man lyckas exportera allt eftersom Mississippi-floden har stängts på grund av lågt vattenstånd (orsakat av torkan).
Vi ser här en bild på terminskurvorna för Matif och Chicago, båda omräknade till euro per ton.
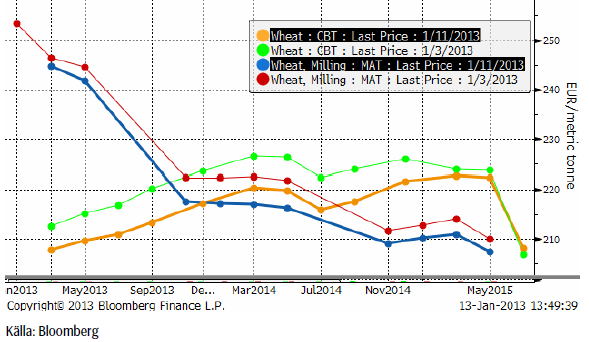
Av diagrammet ovan ser man att gammal skörd av Matif-vete är avsevärt mycket dyrare än Chicagovetet. Maj-terminen handlas dessutom lägre än mars-terminen. Det säger att den som väntar med att sälja till maj riskerar att få väsentligt sämre betalt – och dessutom får bära ränte- och lagerkostnader fram till dess. Den som vill ta en position på högre priser och har fysiskt vete i lager gör därför sannolikt bäst i att sälja den fysiska varan och istället köpa terminer.
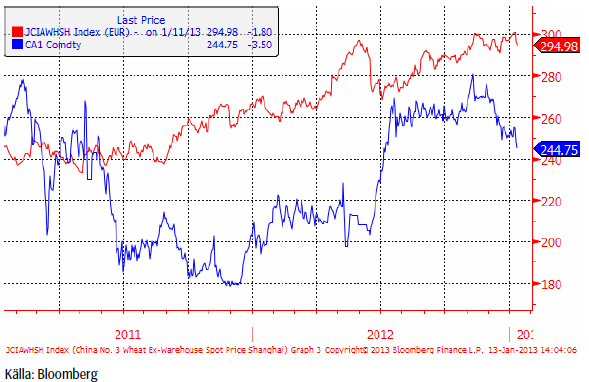
I Kina har priset på vete stigit till en ny rekordnotering. Det har i våra ”mainstream” media helt missats att Kina drabbats av den värsta kylan på över 30 år och den har skadat höstvetet långt söderut i landet. Priset var efter årsskiftet uppe på över 300 euro per ton för spotleverans i Shanghai. I diagrammet är priset omräknat från Renminbi till euro per ton. Vi ser också spotkontraktet på Matif som jämförelse.
Kina har inte varit någon nettoimportör av vete sedan 2004/05, men risken finns att de måste importera mer framöver. I år räknar USDA med att Kina ska importera 3 mt, som vi ser i diagrammet nedan.
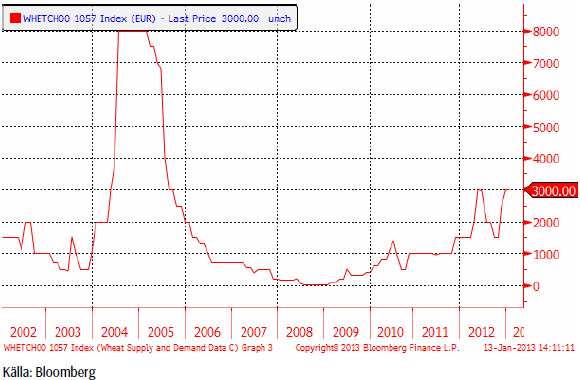
De råvaror som Kina blivit blivit nettoimportör av har rusat iväg i pris.
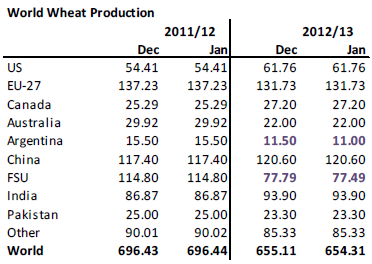
I fredagens WASDE-rapport sänkte USDA produktionsestimatet för skörden i år med 0.8 mt, fördelat i Argentina och Ryssland/Ukraina.
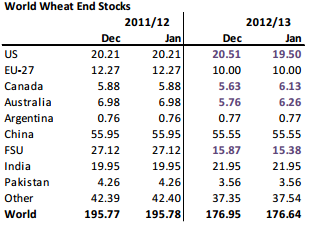
Utgående lager enligt USDA ser vi nedan. Vi ser att det är en liten sänkning. Sänkningar gjordes för USA och Ryssland/Ukraina. Höjningar gjordes däremot för Australien och Kanada på grund av att man antagit lägre export.
Själva WASDE-rapporten innehöll inget speciellt kursdrivande. Förväntad sådd areal, däremot, som vi gick igenom i inledningen till veckobrevet, indikerade att priset ”bör” kunna gå upp.
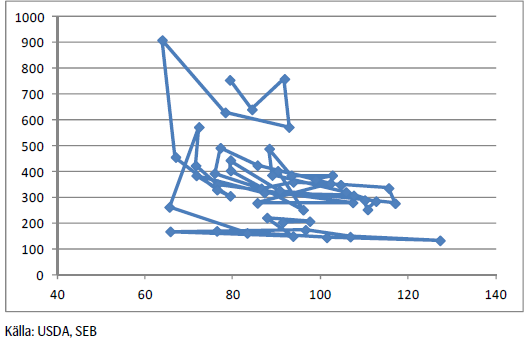
Ser vi förhållandet mellan pris och utgående lager i ett historiskt perspektiv, ser vi att priset för spotkontraktet (det med kortast återstående löptid) på CBOT ligger ganska mycket i linje med de senaste årens relation mellan utgående lager och pris.
Slutsatsen efter att ha gått igenom såväl den tekniska bilden, som WASDE-rapporten, lager per 1 december och höstvete-areal, är att marknaden bör etablera en botten på de här nivåerna och stabilisera sig. Vi går därför över till en neutral rekommendation. Ytterligare motiv för detta är att situationen i majsmarknaden är ännu mer ”bullish”.
Maltkorn
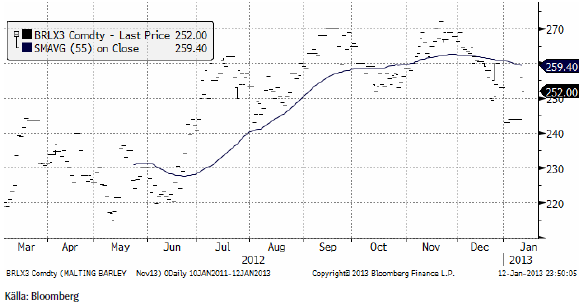
November 2013-kontraktet fortsätter att hoppa sig framåt. I veckan steg priset upp nästan till 260 euro per ton, men föll i fredags ner till 252 euro. 240 euro är en tydlig stödnivå strax under. Det förefaller som om de allra ivrigaste maltkornsköparna har den som ”fyndnivå”. Vi kan också se att de lite mindre ivriga maltkornsköparna tycks vara villiga att köpa kring 220 euro per ton. Det finns alltså ganska gott om stödnivåer för priset strax under dagens prisnivå för kommande skörd.
Potatis
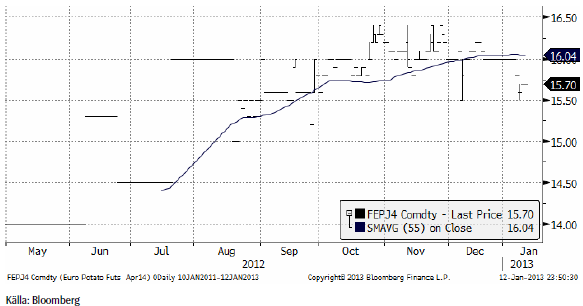
Potatispriset för leverans i april nästa år (2014) har sjunkit något sedan förra veckan och handlas på 15.70 euro per deciton. Det är i den nedre delen av det prisintervall som potatisen som skördas i höst har handlats till sedan september.
Majs
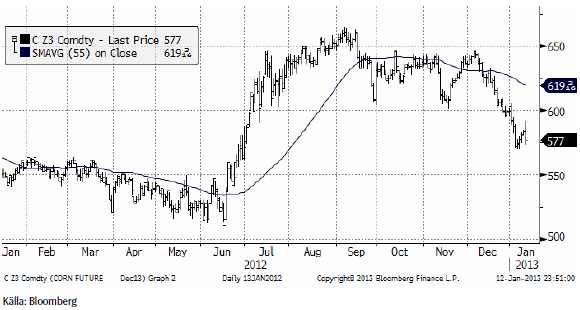
Majspriset (december 2013) reagerade på fredagens WASDE-rapport med att först stiga och sedan falla. Tekniskt stöd finns på 550 cent i decemberkontraktet, som vi ser i diagrammet nedan. Vi tycker inte att rapporten från USDA motiverar lägre pris.
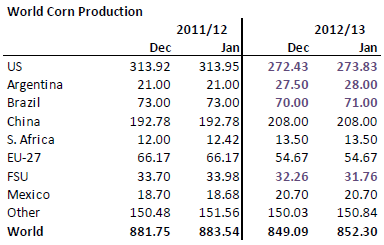
WASDE-rapportens produktionsestimat ser vi nedan och det är alltså en höjning från december med 3 mt på global basis. Höjningarna gjordes för USA, Argentina och Brasilien.
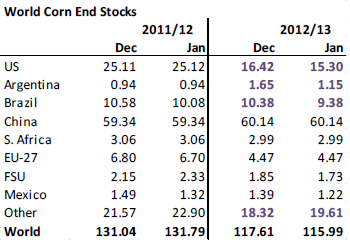
Utgående lager sänktes på global basis till 116 mt från 117.6 beroende på att man antagit en högre foderefterfrågan och för att lagren per 1 december var lägre än vad USDA tidigare antagit. Att foderefterfrågan var högre under det fjärde kvartalet än vad USDA antagit innebär att den kommer att vara det även under det första och kanske andra kvartalet i år också. Med så pass låga som lagren är, behövs en riktigt stor skörd i år. Och för att det ska ske kan inte priset fortsätta att falla.
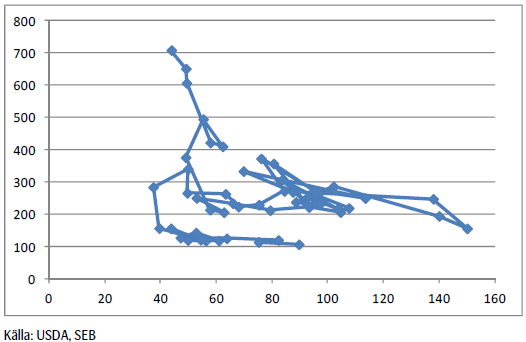
Nedanμ ser vi förhållandet mellan lager och pris. Vi ser att priset är exceptionellt högt i ett historiskt perspektiv, men lagren är också exceptionellt låga.
Vi ska titta på lagren i ett historiskt perspektiv nu i termer av dagars konsumtion:
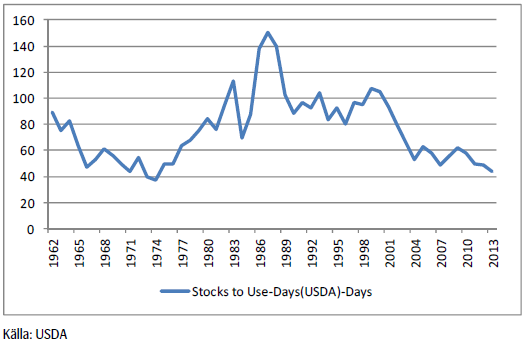
Sammanfattnignsvis: Det behövs en riktigt ordentlig skörd av majs i USA för att utbudet ska återställas. Lagerrapporten tyder på att foderefterfrågan är större än väntat och globala lager är nära rekordlåga nivåer. Vi går därför över till en neutral rekommendation på majsen.
Sojabönor
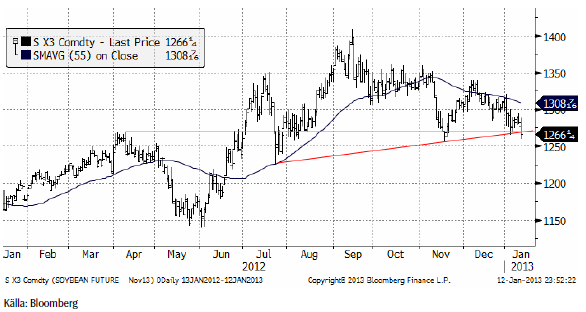
Efter lager- och WASDE-rapporten i fredags föll priset på sojabönor. Lagerrapporten indikerade högre priser, men WASDE-rapportens utbuds- och efterfrågebalans (sammanfattad som utgående lager) innehöll inget som skrämde marknaden. Priset i förhållande till utgående lager visar att priset ligger något ”högt” i förhållande till väntad lagernivå.
Tekniskt gjorde prisfallet i fredags ett en stödlinje bröts, vilket signalerar att ytterligare prisfall kan väntas de närmaste dagarna då säljarna verkar vara mer motiverade än köparna. 1225 cent / bushel på novemberkontraktet kan kanske tas som en första målkurs.
USDA justerade upp sojabönsproduktionen 2012/13 i fredagens WASDE-rapport. Brasilien höjdes, vilket är i linje med lokala prognoser. USA höjdes också, men Argentina sänktes. USDA sänkte även Argentinas uppskattade skörd förra året, vilket då slår på utgående lager för 12/13.
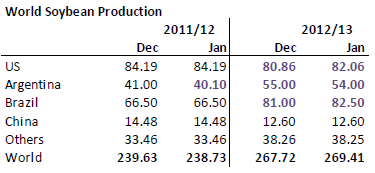
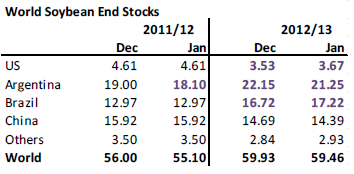
Nedan ser vi USDA:s uppskattning av utgående lager 2011/12 och prognos för 2012/13. Som vi ser resulterade det i en liten sänkning, främst i USA och Argentina (pga sänkt ingående lager, huvudsakligen).
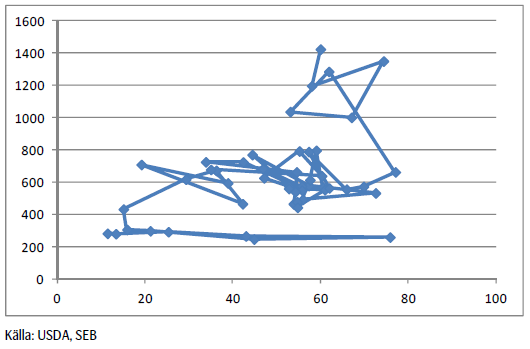
Nedan ser vi förhållandet mellan pris och förväntade utgående lager 2012/13 i termer av dagars konsumtion. På basis av den här bilden ser vi att priset ser ”högt” ut.
Sammanfattningsvis: Prisfall ner mot 1225 cent på novemberkontraktet ser ut att kunna vara ett riktmärke.
Raps
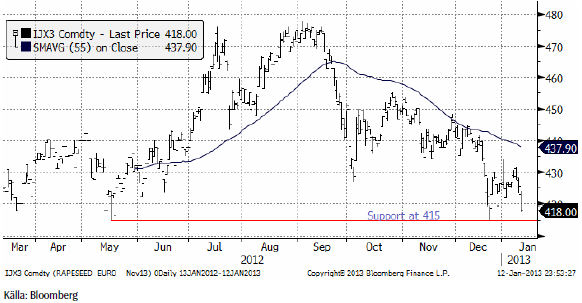
Rapspriset (november 2013) föll i pris i fredags som en följd av prisfallet i sojabönorna. Tekniskt finns en stödnivå på 415 euro per ton. Det är troligt att den ska testas – och kanske brytas på nedsidan – i veckan som kommer.
Gris
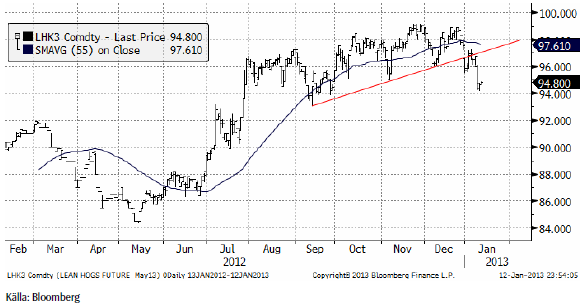
Grispriset (Maj 13), amerikansk Lean Hogs, har brutit en teknisk stödnivå (röd linje i diagrammet nedan). 94 cent per pund var första stödnivån, men antagligen fortsätter priset ner mot 92 cent i första hand.
Mjölk
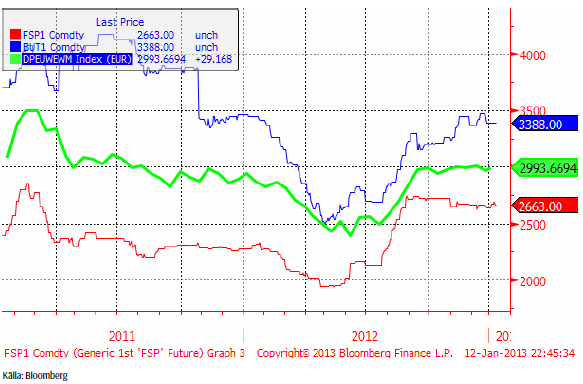
I diagrammet nedan ser vi tre kurvor.Den gröna linjen är priset på skummjölkspulver i euro per ton på Eurex-börsen. Den blå är priset på smör på Eurex börsen. Priserna på Eurex anges i euro per ton.
Slutligen så den gröna linjen. Den visar priset på helmjölkspulver (WMP) FOB Västeuropa. Källan är USDA och priserna uppdateras varannan vecka. Vi ser att WMP-priset legat stabilt det fjärde kvartalet förra året, med en liten nedgång mot slutet av året. 2013 har dock börjat med en liten prisuppgång.
Det börsbaserade priset i svenska kronor beräknas med formeln:
![]()
där
BUT = priset på smör i euro per ton
SMP = priset på skummjölkspulver i euro per ton
FX = växelkursen för EURSEK.
SEB erbjuder, som första bank i världen, sina kunder att prissäkra ovanstående pris (marknad) i kronor per kilo med terminskontrakt.
EURSEK
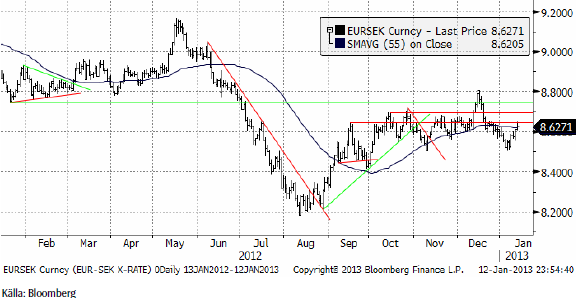
EURSEK stärktes successivt under veckan som gick och nådde upp till de gamla motståndsnivåerna. Det finns inte mycket ny information som ger anledning till att anta annat än att den ”sidledes” rörelse vi sett de senaste månaderna ska fortsätta.
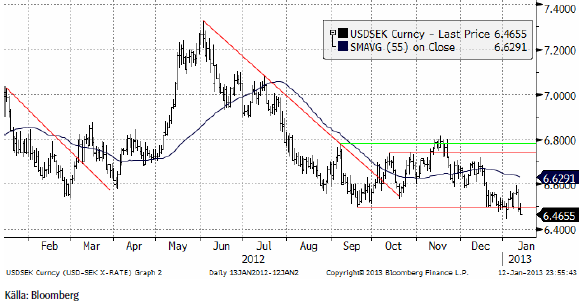
USDSEK
Dollarn föll mot kronan i veckan som gick. Det är fortsatt instabilt finansiellt och politiskt i USA. Stödnivån från botten i september är bruten och det ser ut som om vi ska vänta oss ytterligare dollarförsvagning i veckan som kommer.
[box]SEB Veckobrev Jordbruksprodukter är producerat av SEB Merchant Banking och publiceras i samarbete och med tillstånd på Råvarumarknaden.se[/box]
Disclaimer
The information in this document has been compiled by SEB Merchant Banking, a division within Skandinaviska Enskilda Banken AB (publ) (“SEB”).
Opinions contained in this report represent the bank’s present opinion only and are subject to change without notice. All information contained in this report has been compiled in good faith from sources believed to be reliable. However, no representation or warranty, expressed or implied, is made with respect to the completeness or accuracy of its contents and the information is not to be relied upon as authoritative. Anyone considering taking actions based upon the content of this document is urged to base his or her investment decisions upon such investigations as he or she deems necessary. This document is being provided as information only, and no specific actions are being solicited as a result of it; to the extent permitted by law, no liability whatsoever is accepted for any direct or consequential loss arising from use of this document or its contents.
About SEB
SEB is a public company incorporated in Stockholm, Sweden, with limited liability. It is a participant at major Nordic and other European Regulated Markets and Multilateral Trading Facilities (as well as some non-European equivalent markets) for trading in financial instruments, such as markets operated by NASDAQ OMX, NYSE Euronext, London Stock Exchange, Deutsche Börse, Swiss Exchanges, Turquoise and Chi-X. SEB is authorized and regulated by Finansinspektionen in Sweden; it is authorized and subject to limited regulation by the Financial Services Authority for the conduct of designated investment business in the UK, and is subject to the provisions of relevant regulators in all other jurisdictions where SEB conducts operations. SEB Merchant Banking. All rights reserved.

Brent crude has climbed roughly USD 1.5-2 per barrel since Friday, yet falling USD 0.3 per barrel this mornig and currently trading near USD 67.25/bbl after yesterday’s climb. While the rally reflects short-term geopolitical tension, price action has been choppy, and crude remains locked in a broader range – caught between supply-side pressure and spot resilience.

Prices have been supported by renewed Ukrainian drone strikes targeting Russian infrastructure. Over the weekend, falling debris triggered a fire at the 20mtpa Kirishi refinery, following last week’s attack on the key Primorsk terminal.
Argus estimates that these attacks have halted ish 300 kbl/d of Russian refining capacity in August and September. While the market impact is limited for now, the action signals Kyiv’s growing willingness to disrupt oil flows – supporting a soft geopolitical floor under prices.
The political environment is shifting: the EU is reportedly considering sanctions on Indian and Chinese firms facilitating Russian crude flows, while the U.S. has so far held back – despite Bessent warning that any action from Washington depends on broader European participation. Senator Graham has also publicly criticized NATO members like Slovakia and Hungary for continuing Russian oil imports.
It’s worth noting that China and India remain the two largest buyers of Russian barrels since the invasion of Ukraine. While New Delhi has been hit with 50% secondary tariffs, Beijing has been spared so far.
Still, the broader supply/demand balance leans bearish. Futures markets reflect this: Brent’s prompt spread (gauge of near-term tightness) has narrowed to the current USD 0.42/bl, down from USD 0.96/bl two months ago, pointing to weakening backwardation.
This aligns with expectations for a record surplus in 2026, largely driven by the faster-than-anticipated return of OPEC+ barrels to market. OPEC+ is gathering in Vienna this week to begin revising member production capacity estimates – setting the stage for new output baselines from 2027. The group aims to agree on how to define “maximum sustainable capacity,” with a proposal expected by year-end.
While the IEA pegs OPEC+ capacity at 47.9 million barrels per day, actual output in August was only 42.4 million barrels per day. Disagreements over data and quota fairness (especially from Iraq and Nigeria) have already delayed this process. Angola even quit the group last year after being assigned a lower target than expected. It also remains unclear whether Russia and Iraq can regain earlier output levels due to infrastructure constraints.
Also, macro remains another key driver this week. A 25bp Fed rate cut is widely expected tomorrow (Wednesday), and commodities in general could benefit a potential cut.
Summing up: Brent crude continues to drift sideways, finding near-term support from geopolitics and refining strength. But with surplus building and market structure softening, the upside may remain capped.
Brent crude is essentially flat on the week, but after a volatile ride. Prices started Monday near USD 65.5/bl, climbed steadily to a mid-week high of USD 67.8/bl on Wednesday evening, before falling sharply – losing about USD 2/bl during Thursday’s session.
Brent is currently trading around USD 65.8/bl, right back where it began. The volatility reflects the market’s ongoing struggle to balance growing surplus risks against persistent geopolitical uncertainty and resilient refined product margins. Thursday’s slide snapped a three-day rally and came largely in response to a string of bearish signals, most notably from the IEA’s updated short-term outlook.
The IEA now projects record global oversupply in 2026, reinforcing concerns flagged earlier by the U.S. EIA, which already sees inventories building this quarter. The forecast comes just days after OPEC+ confirmed it will continue returning idle barrels to the market in October – albeit at a slower pace of +137,000 bl/d. While modest, the move underscores a steady push to reclaim market share and adds to supply-side pressure into year-end.
Thursday’s price drop also followed geopolitical incidences: Israeli airstrikes reportedly targeted Hamas leadership in Doha, while Russian drones crossed into Polish airspace – events that initially sent crude higher as traders covered short positions.
Yet, sentiment remains broadly cautious. Strong refining margins and low inventories at key pricing hubs like Europe continue to support the downside. Chinese stockpiling of discounted Russian barrels and tightness in refined product markets – especially diesel – are also lending support.
On the demand side, the IEA revised up its 2025 global demand growth forecast by 60,000 bl/d to 740,000 bl/d YoY, while leaving 2026 unchanged at 698,000 bl/d. Interestingly, the agency also signaled that its next long-term report could show global oil demand rising through 2050.
Meanwhile, OPEC offered a contrasting view in its latest Monthly Oil Market Report, maintaining expectations for a supply deficit both this year and next, even as its members raise output. The group kept its demand growth estimates for 2025 and 2026 unchanged at 1.29 million bl/d and 1.38 million bl/d, respectively.
We continue to watch whether the bearish supply outlook will outweigh geopolitical risk, and if Brent can continue to find support above USD 65/bl – a level increasingly seen as a soft floor for OPEC+ policy.
Brent crude makes some gains as Israel’s attack on Hamas in Qatar rattles markets. Brent crude spiked to a high of USD 67.38/b yesterday as Israel made a strike on Hamas in Qatar. But it wasn’t able to hold on to that level and only closed up 0.6% in the end at USD 66.39/b. This morning it is starting on the up with a gain of 0.9% at USD 67/b. Still rattled by Israel’s attack on Hamas in Qatar yesterday. Brent is getting some help on the margin this morning with Asian equities higher and copper gaining half a percent. But the dark cloud of surplus ahead is nonetheless hanging over the market with Brent trading two dollar lower than last Tuesday.

Geopolitical risk premiums in oil rarely lasts long unless actual supply disruption kicks in. While Israel’s attack on Hamas in Qatar is shocking, the geopolitical risk lifting crude oil yesterday and this morning is unlikely to last very long as such geopolitical risk premiums usually do not last long unless real disruption kicks in.
US API data yesterday indicated a US crude and product stock build last week of 3.1 mb. The US API last evening released partial US oil inventory data indicating that US crude stocks rose 1.3 mb and middle distillates rose 1.5 mb while gasoline rose 0.3 mb. In total a bit more than 3 mb increase. US crude and product stocks usually rise around 1 mb per week this time of year. So US commercial crude and product stock rose 2 mb over the past week adjusted for the seasonal norm. Official and complete data are due today at 16:30.
A 2 mb/week seasonally adj. US stock build implies a 1 – 1.4 mb/d global surplus if it is persistent. Assume that if the global oil market is running a surplus then some 20% to 30% of that surplus ends up in US commercial inventories. A 2 mb seasonally adjusted inventory build equals 286 kb/d. Divide by 0.2 to 0.3 and we get an implied global surplus of 950 kb/d to 1430 kb/d. A 2 mb/week seasonally adjusted build in US oil inventories is close to noise unless it is a persistent pattern every week.
US IEA STEO oil report: Robust surplus ahead and Brent averaging USD 51/b in 2026. The US EIA yesterday released its monthly STEO oil report. It projected a large and persistent surplus ahead. It estimates a global surplus of 2.2 m/d from September to December this year. A 2.4 mb/d surplus in Q1-26 and an average surplus for 2026 of 1.6 mb/d resulting in an average Brent crude oil price of USD 51/b next year. And that includes an assumption where OPEC crude oil production only averages 27.8 mb/d in 2026 versus 27.0 mb/d in 2024 and 28.6 mb/d in August.
Brent will feel the bear-pressure once US/OECD stocks starts visible build. In the meanwhile the oil market sits waiting for this projected surplus to materialize in US and OECD inventories. Once they visibly starts to build on a consistent basis, then Brent crude will likely quickly lose altitude. And unless some unforeseen supply disruption kicks in, it is bound to happen.
US IEA STEO September report. In total not much different than it was in January

US IEA STEO September report. US crude oil production contracting in 2026, but NGLs still growing. Close to zero net liquids growth in total.


Tyskland har så höga elpriser att företag inte har råd att använda elektricitet
Brent crude ticks higher on tension, but market structure stays soft

Kinas elproduktion slog nytt rekord i augusti, vilket även kolkraft gjorde

Det stigande guldpriset en utmaning för smyckesköpare

Aktier i guldbolag laggar priset på guld

Meta bygger ett AI-datacenter på 5 GW och 2,25 GW gaskraftverk
Aker BP gör ett av Norges största oljefynd på ett decennium, stärker resurserna i Yggdrasilområdet
Brent edges higher as India–Russia oil trade draws U.S. ire and Powell takes the stage at Jackson Hole

Mahvie Minerals är verksamt i guldrikt område i Finland
Increasing risk that OPEC+ will unwind the last 1.65 mb/d of cuts when they meet on 7 September
-
 Nyheter4 veckor sedan
Meta bygger ett AI-datacenter på 5 GW och 2,25 GW gaskraftverk
-
 Nyheter4 veckor sedan
Aker BP gör ett av Norges största oljefynd på ett decennium, stärker resurserna i Yggdrasilområdet
-
Analys4 veckor sedan
Brent edges higher as India–Russia oil trade draws U.S. ire and Powell takes the stage at Jackson Hole
-
 Nyheter3 veckor sedan
Mahvie Minerals är verksamt i guldrikt område i Finland
-
Analys4 veckor sedan
Increasing risk that OPEC+ will unwind the last 1.65 mb/d of cuts when they meet on 7 September
-

 Nyheter4 veckor sedan
Neil Atkinson spår att priset på olja kommer att stiga till 70 USD
-

 Nyheter2 veckor sedan
Eurobattery Minerals satsar på kritiska metaller för Europas självförsörjning
-
Analys2 veckor sedan
OPEC+ in a process of retaking market share